

Updated April 2025
Woodlands Financial Services is a small, local bank that does what it’s supposed to—keep things steady, serve its community, and keep paying out a dividend to shareholders. It’s that last part that makes it worth a second look, especially if you’re the kind of investor who cares more about consistent income than flashy quarterly surprises.
The company might be facing some headwinds, but its dividend continues to hold up—and that’s the part that matters for income-focused portfolios.
Here are the dividend metrics that income investors should know right off the bat:
📈 Forward Yield: 5.27%
💰 Annual Dividend: $1.16 per share
🧱 Payout Ratio: 52.04%
📊 5-Year Average Yield: 4.45%
📆 Next Ex-Dividend Date: February 14, 2025
These numbers speak to a company that, despite its small size, takes its dividend seriously. Let’s dive into what’s been happening recently and how the payout looks under the hood.
Recent Events
Over the last year, WDFN shares have seen a decent run, climbing nearly 24%. That’s a strong showing for a community bank in a fairly tough economic environment. But it hasn’t been a smooth ride. The stock has traded between $15 and $26 over the past 12 months and just recently dipped to around $21, pulling back 4% in a single session. That kind of volatility isn’t common in sleepy banking names, and it suggests something is going on below the surface.
And that’s where things get more complicated. Revenue has taken a hit, down nearly 10% year-over-year. Even more concerning is the bottom line—net income came in at a negative $5.21 million. Profit margins have turned sharply negative, and returns on both assets and equity have sunk into the red. A profit margin of -58.18% and ROE of -14.58% don’t exactly scream financial health.
Still, through it all, WDFN has kept its dividend intact. That’s not something every bank can say during tough stretches.
Key Dividend Metrics
Let’s zero in on the dividend numbers that matter most to income investors:
💵 Current Dividend Yield: 5.27%
📅 Last Dividend Date: November 22, 2024
📊 Five-Year Average Yield: 4.45%
🧮 Payout Ratio: 52.04%
🔁 Dividend Frequency: Annual
That 5.27% yield is well above what you’ll find from most names in the financial sector. It’s nearly double the average for the S&P 500, and the payout ratio—while based on earnings—isn’t at nosebleed levels. So, even though the company is operating at a net loss, it hasn’t pushed the dividend into dangerous territory just yet.
Dividend Overview
Woodlands isn’t the kind of company that’s going to churn out double-digit growth or sudden upside surprises. But that’s not the point. For dividend investors, the appeal is in the consistency. And that’s something WDFN still offers.
Despite earnings challenges, the company has kept its dividend steady. That tells us two things: First, there’s likely enough financial flexibility behind the scenes—whether it’s cash reserves or manageable debt—to support the payout. Second, management seems committed to keeping shareholders paid, even when times get tight.
The balance sheet backs this up to some extent. WDFN is sitting on $8.39 million in cash, and with only 1.39 million shares outstanding, that cash provides a decent cushion. On top of that, the stock trades at just 0.86 times book value. That kind of discount implies the market may be pricing in too much pessimism—or, at the very least, giving you some margin of safety.
The low beta of 0.20 also makes this name appealing for those looking to avoid the rollercoaster of broader market swings. It’s the kind of steady name that might not do much day to day, but over time, could quietly deliver value through yield.
Dividend Growth and Safety
When it comes to dividend safety, it’s worth noting that WDFN hasn’t made any cuts. That’s no small feat when earnings have turned negative. It’s a sign that the company sees the dividend as core to its identity—something shareholders can rely on.
The 52% payout ratio based on earnings does raise eyebrows, especially given the losses. But that number might be masking the reality. Net income includes non-cash charges, and in some cases, temporary write-downs or accounting quirks. Without a clear view of operating cash flow or EBITDA, it’s hard to say how tight things really are. But the fact that the dividend has been maintained during a downturn says a lot.
There’s no recent sign of dividend growth, but that’s not surprising in the current environment. The more important thing is that the dividend hasn’t been reduced. That alone gives this stock a certain appeal to yield hunters who are more focused on getting paid than seeing a payout hike every year.
WDFN’s long history, including a stock split back in 2015, hints at a conservative management style. This isn’t a team that’s going to take wild risks or stretch to make headlines. Instead, they focus on keeping the business stable and returning cash to shareholders in a consistent, no-fuss way.
Cash Flow Statement
Woodlands Financial Services Company shows a mixed picture when it comes to cash flow, but the operational side remains solid. For the trailing 12 months, the company generated $4.69 million in operating cash flow, a modest increase over the prior year and in line with its historical range. Free cash flow also stayed healthy at $4.51 million, reinforcing that the business continues to bring in real, spendable cash—even if reported earnings have slipped. Capital expenditures remain low and manageable, sitting at just $174,000 for the same period.
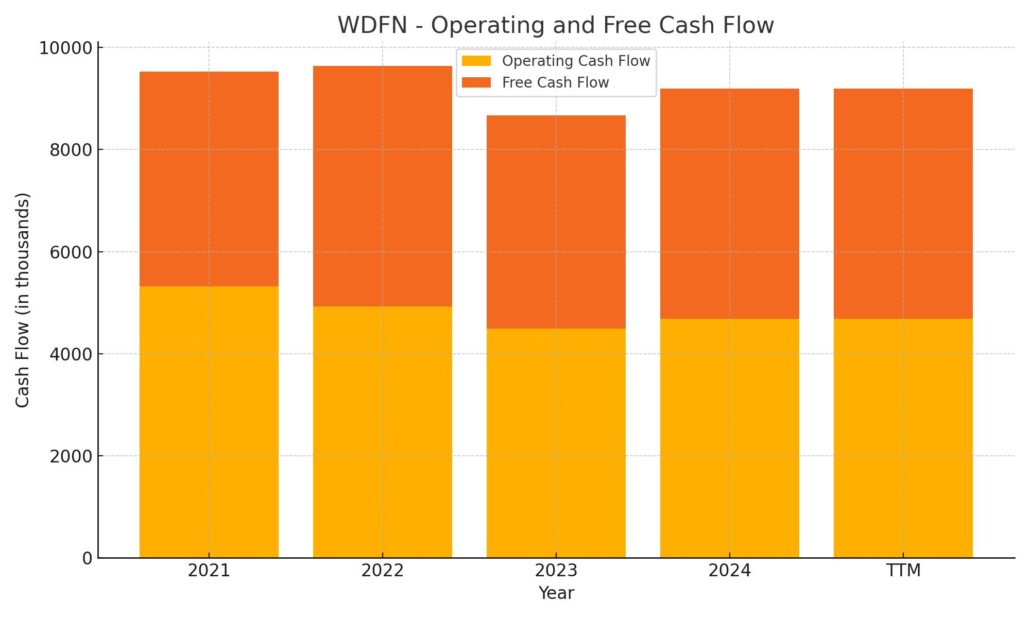
The real story lies in the shifts across investing and financing activities. Investing cash flow turned sharply positive this year at $8.72 million, a stark reversal from heavy outflows in the prior years, which suggests a pullback or wind-down of earlier capital deployment. On the financing side, cash outflows were significant at -$16.60 million. That’s a big shift from years when the company was bringing in financing, and likely reflects a combination of debt repayment and dividend distributions. As a result, the company’s cash balance has continued to shrink, ending at $10.26 million—down meaningfully from past highs, but still providing a reasonable buffer.
Earning Report Summary
Woodlands Financial Services Company had a tough run in 2023. The bank ended the year in the red, posting a net loss of $3.98 million. That’s a sharp turn from the $5.06 million in profit it booked the year before. What caused the swing? Most of it came down to a steep jump in the provision for credit losses. That figure ballooned to $10.27 million, compared to just $390,000 the year before. It’s a clear sign management is preparing for more loan defaults or at least feeling uneasy about parts of the loan book.
Interest Income Up, But Costs Rising Too
There was some good news in the top line. Interest income rose to nearly $25 million, driven mostly by stronger performance from loans and leases. But that gain came with a catch—interest expenses jumped too. The cost of deposits and borrowed money surged to $9.09 million, up from $2.73 million the year before. As a result, net interest income actually dipped a bit, landing at $15.88 million versus $17.23 million in 2022. So even though more money came in, more had to go out to keep it.
Non-Interest Income and Expenses
On the non-interest side of the business, things were more stable. Income here edged up to $4.57 million from $4.15 million, thanks to a mix of service charges and trust-related fees. But expenses didn’t sit still either. Salaries, benefits, and data processing costs all crept up, pushing total non-interest expenses to $15.74 million. It’s not a huge jump from the $15.15 million spent the year before, but it adds pressure at a time when every dollar counts.
Balance Sheet Moves
Looking at the balance sheet, total assets held steady at just over $612 million. But deposits fell to $513 million from $567 million—a decent-sized drop. To make up the difference, the bank leaned on borrowings. Federal funds purchased climbed to $38 million, and long-term debt grew to almost $24 million from under $4 million. That’s a big shift and likely reflects a strategy to keep things running smoothly despite fewer customer deposits.
As expected, shareholders took a hit. Equity slipped from $36.31 million to $33.17 million, mostly due to the year’s net loss. That pushed the book value per share down, reducing what each share is worth based on the company’s underlying assets. It wasn’t a pretty year, but it’s one that shows the bank is adapting—albeit with a few bumps along the way.
Chart Analysis
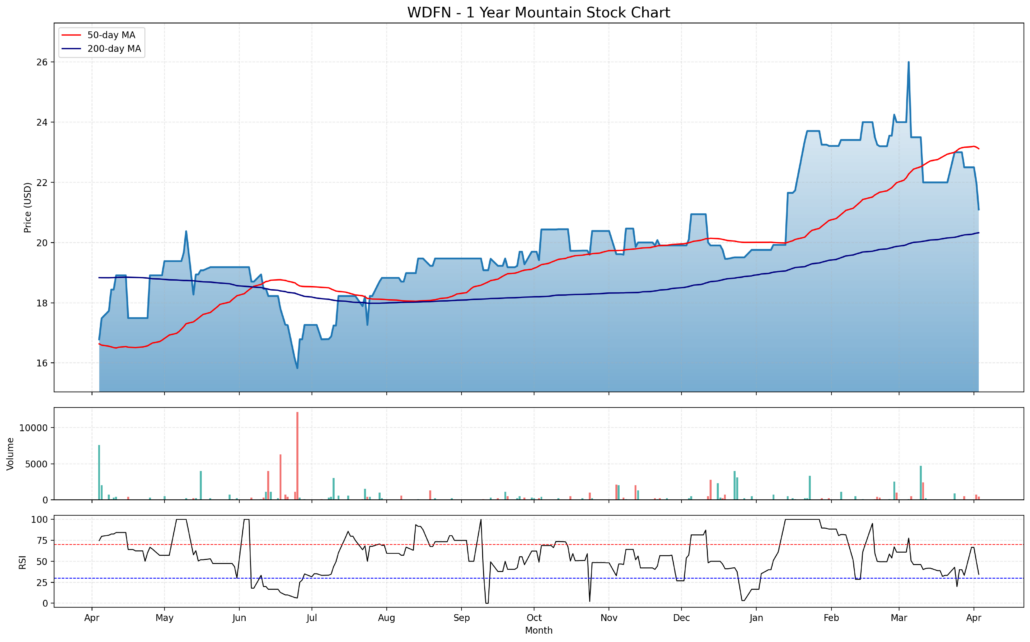
WDFN has had an interesting ride over the past year. The price action shows a slow and steady uptrend that accelerated heading into the early part of this year. The chart begins near the $16 mark and builds gradually toward a high just shy of $26 before pulling back to current levels around $21. That climb wasn’t linear, though—there were a few shakeouts and sideways stretches, especially in mid-summer and again in the fall. What’s noticeable is how well the stock respected its moving averages over time.
Moving Averages
The 50-day moving average (red line) has spent most of the past six months trending higher and recently began flattening out as the stock pulled back. Earlier in the chart, there’s a crossover where the 50-day dipped below the 200-day average, but that was short-lived. The trend flipped back in late summer as the price pushed higher, with the 50-day staying above the 200-day since then. That golden cross held strong until now, where the price recently dipped closer to the 200-day average again. It’s worth watching to see if support holds here or if there’s more room to correct.
Volume and Momentum
Volume has generally been light, which isn’t surprising for a smaller stock. There are occasional spikes—most notably in June and early January—that probably align with earnings or company news. But outside of those moments, trading remains relatively thin, something that can lead to choppier moves. The light volume also means that even small buying or selling pressure can move the stock more than expected.
On the momentum side, the Relative Strength Index (RSI) has danced between overbought and oversold levels throughout the year. Most recently, it’s settled closer to the neutral zone after a strong run early in the year sent it above 70 a few times. That dip in RSI suggests some of the earlier momentum has cooled off, aligning with the recent pullback in price. Still, RSI hasn’t dropped into oversold territory yet, which hints at some underlying strength.
Price Behavior
The recent candles show some indecision. After hitting highs in February, the stock pulled back sharply but hasn’t broken down. Price is still above last year’s levels, and while there’s clear resistance around $25, support seems to be forming near the 200-day moving average. If the stock can stabilize here and volume picks up, there could be a base building for the next leg higher. The long-term trend remains intact for now, but short-term movement will depend on whether this recent pullback holds or rolls over.
Management Team
Woodlands Financial Services Company is guided by a leadership team with deep roots in banking and a steady hand on the wheel. Leading the company is Jon P. Conklin, who has been serving as Chairman, President, and Chief Executive Officer since 2013. With more than a decade in these top roles, Conklin has provided consistent direction through a mix of growth phases and more turbulent times.
Backing him is Joseph F. Farley, the Executive Vice President, Chief Financial Officer, and Chief Operating Officer. Farley plays a central role in overseeing financial strategy, day-to-day operations, and maintaining fiscal discipline—essential for a smaller bank navigating a highly regulated and competitive space.
Technology and information security responsibilities are handled by Matthew A. Gaugler, the Vice President and Chief Information Officer. His presence reflects the growing importance of IT infrastructure even in regional banking institutions.
The board of directors blends continuity with fresh insight. Long-standing members like William C. Brown and Marc D. Lewis bring stability and institutional memory. Meanwhile, more recent additions such as Jay B. Alexander inject fresh thinking into boardroom discussions and decision-making.
Valuation and Stock Performance
As of early April 2025, WDFN shares are trading at $21.10. The stock has traveled a volatile path over the last 12 months, ranging from a low of $15.00 to a high of $26.00. That puts the current price toward the lower end of its recent highs, following a recent pullback of just over 4 percent.
With a market cap of approximately $30.68 million, WDFN is a micro-cap name operating well below Wall Street’s radar. Its trailing price-to-earnings ratio of 9.87 makes it look inexpensive relative to broader market benchmarks, though that valuation must be viewed in context given the company’s recent earnings performance.
The price-to-book ratio sits at 0.86, which suggests the market is assigning a discount to the company’s underlying assets. That may reflect investor caution due to recent losses or could signal an undervalued opportunity if profitability returns.
Over the past year, WDFN has returned close to 24 percent, outpacing the S&P 500’s gains during the same time. Despite its low trading volume and niche status, the stock has proven it can deliver price appreciation under the right conditions. With a beta of just 0.20, price movements tend to be modest and less reactive to the broader market swings, providing a sense of relative calm during more turbulent times.
Risks and Considerations
There are important risks that come with holding WDFN, especially given the company’s recent financial results. For starters, profitability has taken a hit. The most recent data show a negative profit margin of over 58 percent, and return on equity is deeply in the red at -14.58 percent. Those figures paint a clear picture of a company working through some serious headwinds.
The balance sheet shows around $53.34 million in total debt, and while debt is not unusual for banks, the reliance on borrowed capital could pressure future operations if interest rates stay high or earnings don’t rebound. Limited visibility into free cash flow trends also makes it harder to assess how well the company can sustain its dividend and cover fixed obligations.
Being a smaller financial institution, Woodlands is naturally more vulnerable to swings in the local and regional economy. Loan losses, shifts in interest rates, and changes in customer deposit behavior can have an outsized impact here. Add in regulatory oversight, compliance costs, and evolving technology expectations, and the pressure points start to add up.
Another factor to keep in mind is liquidity. Trading volume is light, and that can make the stock more susceptible to wider bid-ask spreads or exaggerated price swings when larger trades come through. That also means it may take more time and care to enter or exit a position at a desired price.
Final Thoughts
Woodlands Financial Services Company offers a unique mix of qualities that might appeal to certain types of investors. It has a seasoned leadership team, a history of returning capital through dividends, and a relatively conservative approach to growth. The stock has delivered solid price performance over the last year, even if the underlying financials have taken a hit.
But the current numbers tell a more cautious story. Profitability has slipped, debt has climbed, and the company is navigating through a stretch of elevated credit concerns. While the long-term outlook could improve if operations stabilize, these are not trivial challenges.
For those comfortable with the risk profile and willing to take a longer view, WDFN may present an interesting case. The stock isn’t widely followed, which means it can be overlooked by larger institutions. That under-the-radar quality, combined with a discounted valuation, adds an element of potential upside. Still, any position here should be approached with a clear understanding of the company’s fundamentals, the sector’s headwinds, and the broader interest rate environment that continues to shape banking outcomes.