

Updated April 2025
Based in Nebraska and rooted in decades of steady growth, Valmont’s story is one of reliability, utility, and resilience. They manufacture infrastructure essentials like utility poles and irrigation systems—unseen by most, yet vital for communities and agriculture around the world.
With business operations split between Infrastructure and Agriculture, Valmont offers a nice balance between growth potential and economic defensiveness. These aren’t hype-driven sectors, but they are dependable. And when a company consistently posts strong numbers and keeps its payout ratio in check, it starts to look like the kind of place long-term investors can park their money with confidence.
Recent Events
Over the past year, Valmont has been focused on refining its operations and making moves that reinforce its long-term position. The most recent earnings call was eye-catching for one main reason—earnings growth surged over 115% compared to the same period last year. That kind of leap isn’t common in this space and speaks volumes about how well Valmont is managing its business.
Revenue climbed slightly to $4.08 billion, up 2.1% year over year. The growth wasn’t massive, but the quality of earnings tells a better story. Profit margins have expanded, now sitting at 8.6%, and the operating margin is a healthy 11.5%. This shows the business isn’t just growing—it’s getting more efficient.
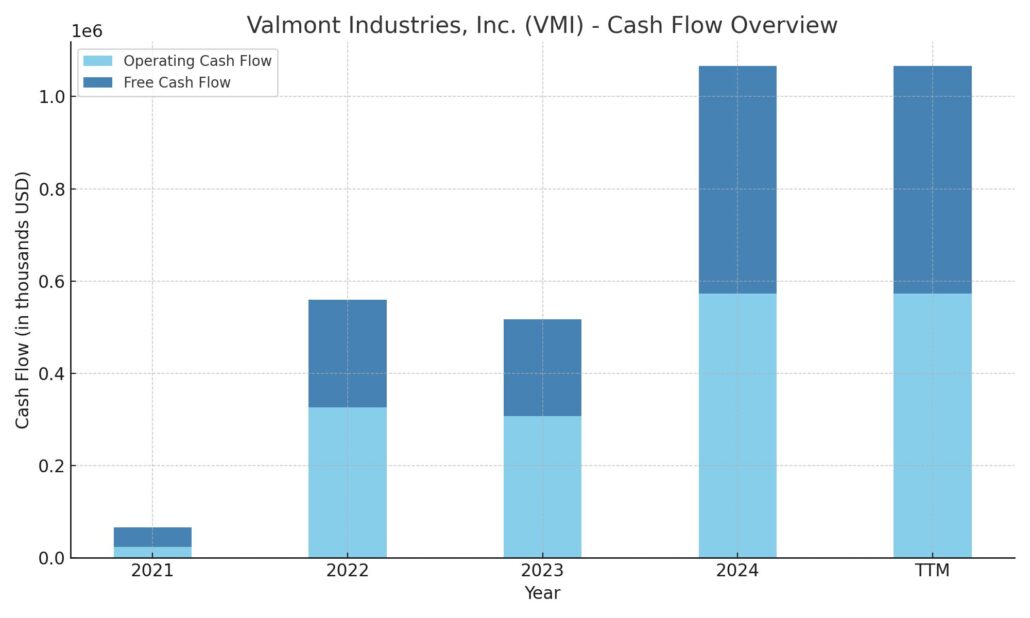
Free cash flow is another bright spot. Valmont generated nearly $489 million in levered free cash flow, a figure that comfortably supports dividends and leaves room for reinvestment or debt paydown. With a consistent track record and a thoughtful approach to capital allocation, this company is showing the kind of financial discipline income investors value.
Key Dividend Metrics
📈 Forward Dividend Yield: 0.92%
💸 Trailing Annual Dividend Yield: 0.83%
🧮 Payout Ratio: 13.96%
📆 Dividend Growth Streak: Over 20 years
🚀 Five-Year Average Dividend Yield: 0.91%
💵 Next Dividend Payable: April 15, 2025
📉 Ex-Dividend Date: March 28, 2025
Dividend Overview
Let’s get one thing out of the way: Valmont’s yield isn’t going to turn heads. Hovering just under 1%, it’s clearly not trying to compete with high-yield plays. But that’s not what it’s here for. Valmont’s dividend is about consistency, not flash.
The company recently increased its annual dividend from $2.40 to $2.72 per share, a respectable 13% bump. That kind of move shows a level of confidence in the underlying business and a willingness to return more to shareholders when the time is right. Importantly, the payout ratio remains comfortably low at just under 14%, signaling that there’s still plenty of room for future hikes.
Valmont also stands out for its conservative financial posture. The debt-to-equity ratio is manageable at 55.8%, and its current ratio of 2.08 provides a solid liquidity cushion. These numbers tell a story of a company that’s not overextending itself, even as it continues to grow and invest in its operations.
And when you see $572 million in operating cash flow in a year, you start to understand how sustainable this dividend really is. There’s more than enough cash coming in to keep the payout going and growing.
Dividend Growth and Safety
One of the strongest signals a dividend investor can look for is history. Valmont has been paying—and more importantly, raising—its dividend for over two decades. That kind of track record doesn’t happen by accident. It’s a reflection of a business that’s structured to endure, and leadership that understands the value of returning capital to shareholders.
The recent dividend increase was a strong vote of confidence, and with a payout ratio still well below average, the company is clearly in no danger of overcommitting. Even in a lower-yield environment, this is the kind of dividend story that holds up—reliable, sustainable, and with plenty of room to grow.
The safety profile looks equally solid. Free cash flow covers the dividend multiple times over. EPS, currently at $17.20, provides a strong buffer. And debt levels, while not negligible, are absolutely manageable in the context of Valmont’s cash-generating ability.
It’s also worth noting that Valmont’s stock carries a beta of 1.08. In plain terms, it tends to move with the broader market but not excessively so. That kind of moderate volatility is often appealing for dividend investors who want returns without the daily drama.
There’s nothing flashy about Valmont’s approach to dividends, and that’s exactly what makes it work. It’s methodical, backed by real numbers, and set up for the long haul. For investors looking to build income over time rather than chase short-term payouts, Valmont fits the bill.
Cash Flow Statement
Utah Medical Products, Inc. generated $14.8 million in operating cash flow over the trailing twelve months, a noticeable drop from the $22.3 million reported in the prior year. Despite the decrease, the business continues to generate strong cash flow relative to its size, and capital expenditures remain minimal at just $235,000. That translates to a free cash flow of $14.6 million, enough to comfortably cover dividend payments and still leave room for strategic flexibility.
The more striking number is the $23.8 million in negative financing cash flow, which largely reflects a substantial $20 million stock repurchase. That’s a bold return of capital move for a company with under $200 million in market cap. With no debt issuance or repayment activity and nearly $83 million in ending cash, UTMD remains highly liquid. While cash balances declined year-over-year, the drop stems from deliberate capital allocation choices, not operational strain.
Analyst Ratings
📈 Valmont Industries (VMI) has recently seen shifts in analyst perspectives. The consensus 12-month price target stands at $402.50, suggesting a potential upside from the current trading levels.
🟢 On February 19, 2025, Stifel Nicolaus raised its price target for Valmont from $387.00 to $425.00, maintaining a buy rating. This adjustment reflects optimism about the company’s future performance and growth prospects. Analysts noted improved earnings quality and stronger-than-expected margins, particularly in the Infrastructure segment, as key drivers behind the upward revision.
🔻 Conversely, on March 21, 2025, William Blair downgraded Valmont from outperform to market perform. This change was influenced by growing concerns over potential tariffs on Mexican imports, which could weigh on Valmont’s bottom line. The company’s operations in Mexico include manufacturing of steel structures that are exported to the U.S., and analysts flagged this as a point of vulnerability if trade restrictions tighten.
🔄 These contrasting views highlight the tension between Valmont’s solid operational metrics and external risks. Analysts continue to see strong fundamentals but are watching policy developments closely, as they may shape short-term earnings visibility.
Earning Report Summary
Valmont Industries just wrapped up a solid year, and their latest earnings report shows a company that’s quietly firing on all cylinders. Even in a market that’s been a bit unpredictable, Valmont kept things moving forward with steady performance across the board.
Strong Finish to the Year
In the fourth quarter, Valmont pulled in $1.04 billion in net sales, which was up slightly from the same time last year. But where the company really impressed was profitability. Operating income nearly doubled, landing at $120 million for the quarter. That’s a strong 11.6% margin, compared to just 6.3% in the fourth quarter of the previous year. On the bottom line, earnings per share came in at $3.84—almost triple from last year’s $1.38 for the same period. It’s the kind of finish that shows this business isn’t just holding steady—it’s getting sharper.
Full-Year Results Show Momentum
For the full year 2024, Valmont reported just over $4 billion in revenue. While that’s a slight dip from 2023, the company made up for it in efficiency. Operating income for the year hit $524.6 million, well above last year’s mark, and margins improved across the board. Annual EPS reached a record $17.19, up significantly from $6.78 in the prior year. That kind of growth in profitability, especially in a slightly softer sales environment, is a clear sign of smart management and operational focus.
Business Segments Holding Their Own
On the segment level, Infrastructure continues to be the workhorse, bringing in over 70% of the company’s revenue. Sales there rose just over 2% in Q4, driven by strength in utility demand and a rebound in telecom infrastructure. The Agriculture side, which makes up the rest, also showed a small gain, despite some headwinds from currency exchange fluctuations. Both segments are holding up well and contributing to the overall stability.
Cash Flow and Capital Moves
Cash generation was another bright spot. Valmont ended the year with $572.7 million in operating cash flow—up nearly 87% from last year. With that kind of cash coming in, the company had no trouble paying down its credit line, and now sits with a very manageable debt load. It’s even earned a credit upgrade, which only adds to its financial flexibility.
They’ve also stepped up capital returns. A 13% boost to the dividend and a new $700 million buyback plan signal confidence from the top and a focus on rewarding shareholders without compromising growth.
Chart Analysis
Price and Moving Averages
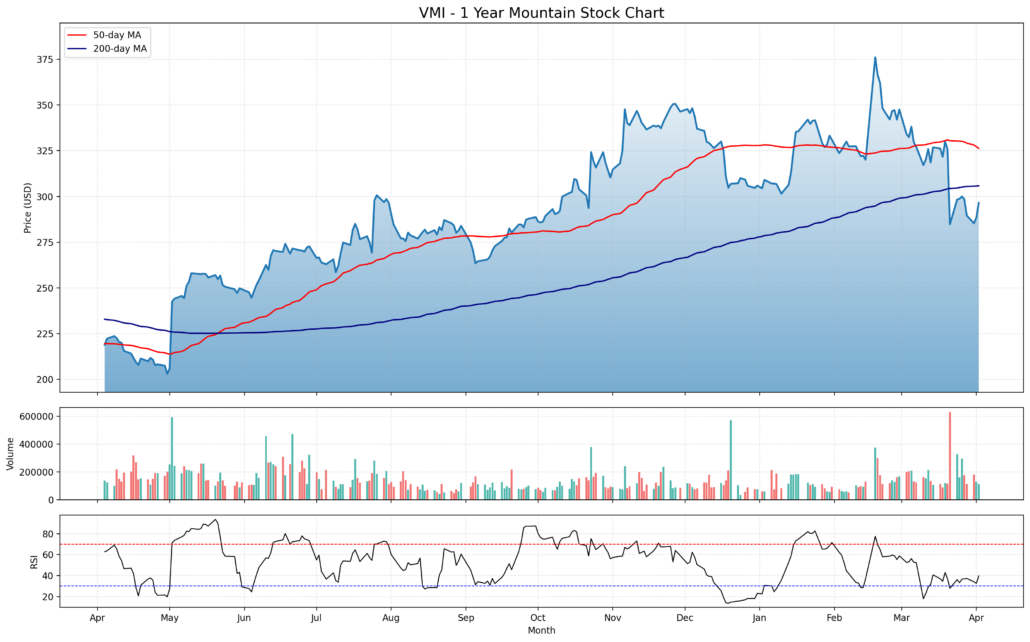
Looking at the chart over the past year, the price action has generally been positive, particularly from late spring through the fall, when the stock moved steadily higher. The 50-day moving average (in red) climbed sharply during that period, eventually pulling well above the 200-day moving average (in blue), which is often considered a sign of strong momentum and underlying strength.
However, more recently, the stock has pulled back from its highs near $375 and is now hovering closer to the 200-day average. The 50-day moving average is now flattening and has started to roll over slightly, suggesting that the upward momentum is cooling off. Still, the price remains above the 200-day for now, which keeps the longer-term trend intact, even if it’s been a bit choppy.
Volume Behavior
Volume spikes in mid-May and again in early March stand out. These bursts were likely driven by earnings or news events and reflect heightened interest. Outside of those peaks, volume has been relatively stable, showing that while attention has come and gone in waves, it hasn’t disappeared entirely. The fact that recent pullbacks didn’t come with sustained high selling volume might suggest a lack of panic, rather than a true change in sentiment.
RSI and Market Sentiment
The Relative Strength Index (RSI) gives us some insight into the emotional tone behind the stock. Over the past year, the RSI has moved through multiple overbought zones (above 70), especially during the stock’s strong run last fall. More recently, though, it’s been stuck below the midline, hovering in the 30–40 range. That puts it near oversold territory, but not quite in the danger zone. This suggests sentiment has cooled, but hasn’t turned overly negative.
Altogether, this chart tells a story of a stock that had a strong run, cooled off, and is now in a consolidation phase. It hasn’t broken down in a meaningful way, and there’s still plenty of technical support from the longer-term trend. The pullback may simply be part of a healthy reset rather than a red flag.
Management Team
Valmont Industries has put together a leadership team that blends deep industry experience with a strong financial foundation. Leading the way is Avner M. Applbaum, who took over as President and Chief Executive Officer in mid-2023. Before stepping into the CEO role, he served as Executive Vice President and Chief Financial Officer, giving him a detailed understanding of the company’s operations and strategy from both a numbers and leadership perspective.
Supporting Applbaum is Thomas Liguori, who came on board as the new Chief Financial Officer in 2024. Liguori brings a background rich in financial and operational leadership, which is already evident in Valmont’s continued improvements in cash flow and capital allocation. Together, the two offer a balance of operational knowledge and strategic oversight.
Other key executives include R. Andrew Massey as the company’s legal and compliance lead and Claudio O. Laterreur, who oversees information technology. This combination of experienced professionals is focused not only on scaling the business but doing so in a way that’s methodical and well-governed. The tone from leadership has been clear—growth, innovation, and shareholder value are all priorities, and they’re aligning the organization accordingly.
Valuation and Stock Performance
Valmont’s valuation metrics reflect a business that’s steady and priced reasonably given its earnings power. With the stock recently trading just under $300 and a trailing P/E ratio around 17, it isn’t demanding a premium multiple, but it also isn’t lagging behind the market. This level of valuation tends to draw investors who prefer steady cash-generating businesses over speculative plays.
The stock’s performance over the past year has been solid. It climbed strongly through much of 2023 before easing back in the early part of 2024. Despite the recent pullback, it remains well above its lows from last spring and has outpaced the broader market in terms of percentage return over the past twelve months.
Analyst sentiment has largely held steady with the consensus view leaning positive. While not universally bullish, there’s a noticeable sense that Valmont is in a good position to continue delivering over the long term. With a price target averaging in the low $400s, analysts are clearly anticipating more upside if execution continues as expected.
Risks and Considerations
Like any global industrial company, Valmont faces a set of risks that investors should keep in mind. Economic sensitivity is a key one—both the Infrastructure and Agriculture segments rely on stable macro conditions and continued investment. A slowdown in construction, reduced government infrastructure spending, or weaker farming markets could all create near-term headwinds.
The company also operates in multiple countries, so it’s exposed to foreign currency fluctuations, changing trade dynamics, and regulatory shifts that come with international operations. These factors can sometimes be unpredictable and may impact margins or revenue, even when core demand remains steady.
From a balance sheet standpoint, Valmont carries just under $900 million in debt. That’s manageable given its cash flow, but it does mean that leadership will need to remain focused on maintaining financial discipline, especially if interest rates remain elevated.
Another area to consider is the evolving regulatory landscape related to sustainability and environmental practices. Valmont has made clear efforts to be proactive here, but as ESG standards tighten, expectations will likely rise. Investors will want to see continued progress in these areas to ensure long-term alignment with stakeholder demands.
Final Thoughts
Valmont has quietly positioned itself as a reliable performer in the industrial space, with leadership that’s focused, financials that are strong, and operations that are built on essential, enduring demand. It’s the kind of business that doesn’t need to chase headlines—it just needs to keep doing what it’s already doing well.
While there are risks worth watching, particularly from global macro factors and policy shifts, the company’s response so far has been measured and strategic. The leadership team is experienced, and they’ve shown a clear focus on execution and shareholder return.
Whether it’s through consistent earnings, careful capital allocation, or steady dividend growth, Valmont continues to carve out a space as a well-run, durable enterprise with room to grow. For those looking at long-term performance grounded in real-world utility and management that thinks several moves ahead, Valmont offers plenty to consider.