

Updated April 2025
Trinity Industries isn’t the kind of stock that grabs headlines, but for investors who prioritize cash flow over flash, there’s something quietly compelling about it. Based in Dallas, Trinity has carved out a solid niche in the railcar industry, covering everything from building freight cars to leasing and maintaining them.
It’s a gritty, grounded business—rooted in infrastructure and tied to the broader economy. But what often gets overlooked is how committed this company is to rewarding shareholders with reliable dividend income. And for investors looking to generate consistent returns from solid industrial players, Trinity has built a case worth listening to.
Recent Events
The last 12 months have been bumpy for Trinity. Revenue slipped over 21% year-over-year, landing at $3.08 billion, and earnings took a bigger hit, with net income growth down more than 50% in the most recent quarter. Some of that is tied to economic slowing, and part of it comes with the territory when your business rides the rails of heavy industry.
That said, it’s not all bad news. Trinity’s railcar leasing segment has held up better than manufacturing, which helps smooth the ride when the economy hits the brakes. And even while top-line numbers stumbled, the company stayed true to its dividend commitment—sending a strong signal about where their priorities lie.
With a forward P/E ratio hovering just above 20 and a price-to-book around 2.17, investors aren’t scooping this up as a bargain, but they are clearly pricing in the stability of its dividend. In times like these, steady income is worth a premium.
Key Dividend Metrics 🔍💰📈
💸 Forward Dividend Yield: 4.27%
📅 Ex-Dividend Date: April 15, 2025
💵 Forward Annual Dividend Rate: $1.20
📉 Payout Ratio: 61.88%
📊 5-Year Average Yield: 3.46%
📈 Dividend Growth: Increasing steadily in recent years
📆 Next Dividend Date: April 30, 2025
Dividend Overview
Trading just under $29, Trinity is throwing off a dividend yield that sits comfortably over 4%. That’s well above its own five-year average and a welcome sight for income-oriented investors. This isn’t just a result of a sliding stock price either—Trinity has been methodically raising its dividend over time.
With a payout ratio under 62%, there’s still a healthy buffer in place. The company is generating over $570 million in operating cash flow, and even though levered free cash flow has been slightly negative, Trinity’s balance sheet carries over $260 million in cash. That helps insulate the dividend, even when things get choppy.
Ownership trends back that up too—nearly 89% of shares are held by institutions. That level of confidence from long-term investors points to a general belief that the dividend is safe and that the company is managing its resources wisely.
Dividend Growth and Safety
When it comes to dividend growth, Trinity has been following a steady, no-drama path. You won’t find eye-popping double-digit hikes here, but that’s okay. This is a company that’s grown its payout thoughtfully, even in years when industrial demand softens.
It’s worth paying attention to how the company handled its most recent earnings dip. Instead of pulling back or freezing the dividend, they chose to keep pushing forward with modest increases. That shows a long-term mindset, the kind you want if you’re planning to collect those checks quarter after quarter.
Still, this is a capital-heavy business. Debt is on the high side—about $5.8 billion—giving it a debt-to-equity ratio well over 400%. That number might make some investors uncomfortable, but in the context of a leasing-heavy model, it’s less alarming. Think of it more like a utility: predictable, asset-based income paired with higher leverage.
The company’s 14.7% operating margin is solid for this kind of business, and a return on equity over 13% suggests they’re making smart use of that capital. Trinity also has a current ratio above 2.0, meaning it has enough short-term assets to comfortably handle its liabilities.
So yes, while the leverage might raise eyebrows at first glance, it’s manageable. And more importantly for dividend investors, it hasn’t stood in the way of ongoing payments—or future growth.
Trinity may not be the most exciting ticker in your portfolio, but if your focus is steady income, it might be one of the most dependable.
Cash Flow Statement
Trinity Industries generated $573.8 million in operating cash flow over the trailing 12 months, a significant improvement compared to $295.6 million the year before. This marks a clear return to form after a brief negative stretch in 2022. The company’s operating performance is back on solid ground, supported by the leasing segment’s ability to consistently generate cash even as revenue dipped. However, after capital expenditures, free cash flow for the same period came in at a modest negative $21.9 million, highlighting the capital-intensive nature of the business.
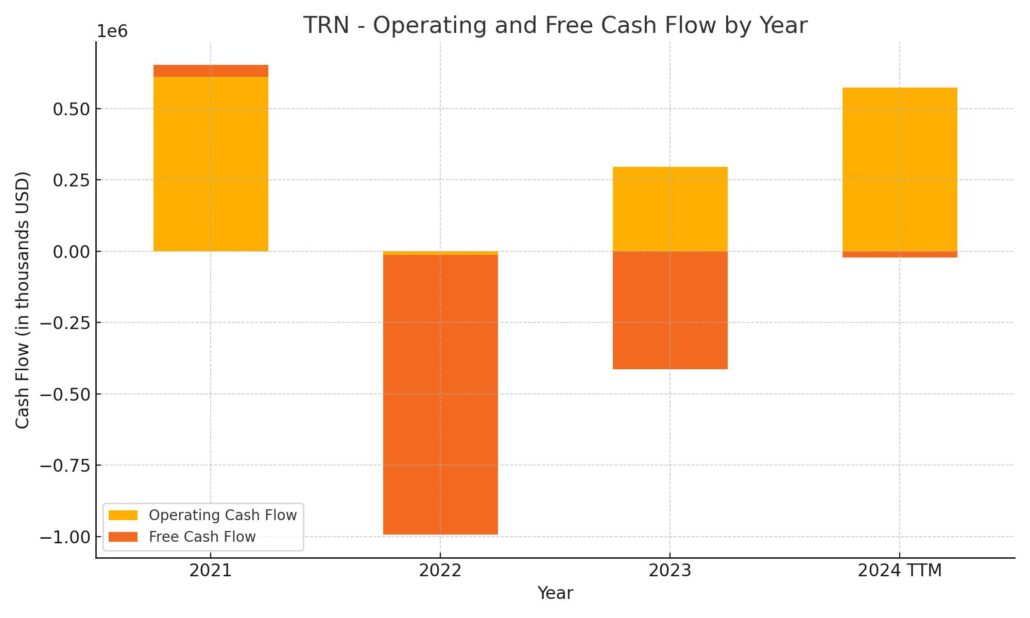
On the investing side, Trinity spent $214.6 million, which reflects continued reinvestment into its fleet and infrastructure. Financing cash flow also turned negative at $219.9 million, largely due to debt repayments and share repurchases. The company did issue nearly $2 billion in debt, showing a reliance on debt markets to maintain flexibility. Despite this, cash on hand rose to $374.4 million, a healthy buffer for operations and dividend coverage. While capital outflows were substantial, the strengthening of operational cash flow and liquidity points to a business that’s managing its cash with long-term obligations in mind.
Analyst Ratings
📉 Trinity Industries has recently seen a shift in analyst sentiment. Around five months ago, one major firm downgraded the stock from a “Positive” to a “Neutral” rating. Interestingly, they still nudged their price target slightly higher, moving it from $34 to $35. The rationale behind the downgrade centered on the company’s heavy debt load. With interest rates elevated, concerns are mounting that higher borrowing costs could strain future cash flow, and there’s even potential for pressure on credit ratings if leverage remains high.
📊 Right now, the general consensus from Wall Street leans toward a “Hold” rating. The average price target sits at $35.50, which represents about 26.5% upside from the current price near $28.86. Analyst expectations don’t vary much, with targets ranging between $35 and $36. That tight range suggests cautious optimism, but not enough conviction to warrant a broad upgrade to “Buy” territory.
💡 The outlook appears to be balancing two key themes: the reliability of Trinity’s leasing model and dividend, versus the financial strain posed by its capital-intensive structure. Analysts seem content to wait for clearer signals before revising ratings more aggressively in either direction.
Chart Analysis
Price Action and Moving Averages
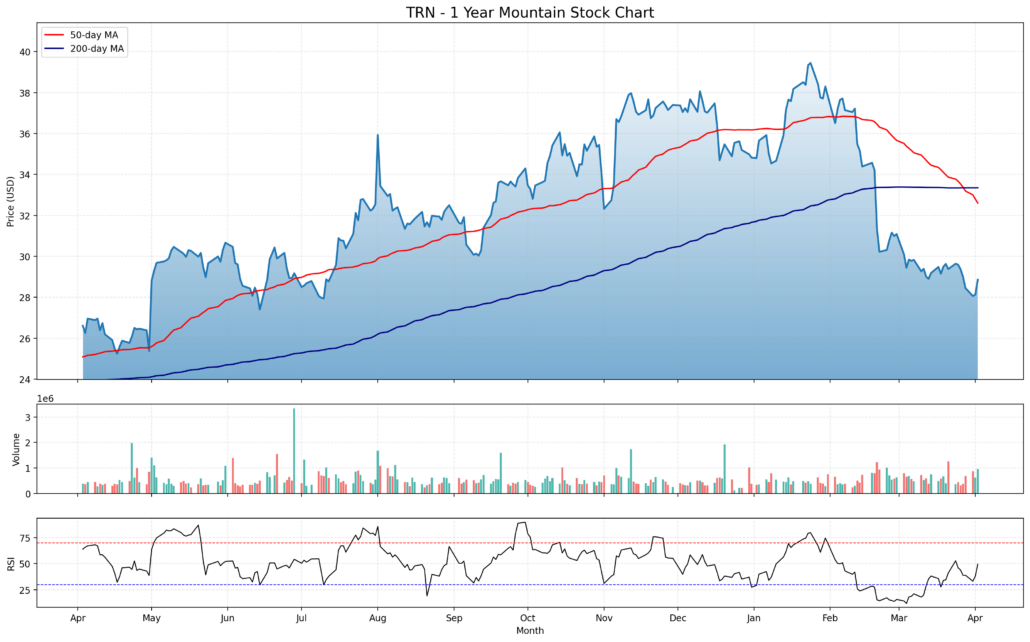
The one-year chart shows a clear shift in trend over the last few months. After a steady climb throughout much of 2023, the price peaked near the $38–$40 range before starting a steady descent. The 50-day moving average (red line) has now crossed below the 200-day moving average (blue line), which is often viewed as a bearish signal. The stock is also trading well below both moving averages, reinforcing the idea that momentum has shifted to the downside in the short to mid-term.
Earlier in the chart, especially from late spring through the end of the year, there was strong support from the 50-day line, and price action mostly respected that level. That trend started to break down in early 2024, and since then, the stock has struggled to find support, bouncing around the $27–$29 zone.
Volume Trends
Volume has remained fairly stable, with a few spikes that suggest larger moves were accompanied by heavier participation. Notably, there was a surge in selling volume during the February drop, suggesting institutional selling or broader risk-off behavior around that time. Since then, volume hasn’t picked up much on up days, which points to a lack of strong conviction from buyers.
RSI Momentum
Looking at the RSI, the stock spent a good portion of the past year in neutral or slightly overbought territory, with readings around 60–70 during its stronger months. More recently, however, the RSI dipped into oversold levels near 30 and has struggled to climb back meaningfully. That suggests momentum remains weak, and while it’s trying to recover, it hasn’t signaled a full reversal yet.
What’s important here is that the RSI hasn’t shown a sharp bullish divergence, and combined with the downtrend in price and the moving average crossover, it paints a cautious picture. Without fresh buying interest or a catalyst to turn sentiment, the technical setup still looks pressured.
Overall, the chart reflects a transition phase—what was once a strong uptrend has now softened into a corrective phase. The longer-term structure may remain intact, but in the near term, the technical indicators are showing clear signs of cooling momentum.
Earning Report Summary
Solid Finish to the Year
Trinity Industries wrapped up 2024 on a stronger note, showing that their steady, behind-the-scenes work is starting to pay off. The company pulled in about $3.1 billion in revenue for the year, with earnings from continuing operations at $1.81 per share. Adjusted earnings landed just a tick higher at $1.82, which is a nice 32% jump from the year before. A big part of that came from better lease rates and a smoother, more efficient operation overall.
One area that stood out was their Railcar Leasing and Services segment. Revenue there climbed 10% compared to the prior year. More than half of their fleet has now been repriced at stronger lease rates, which helped maintain a very solid utilization rate of 97%. The company’s Future Lease Rate Differential—a fancy way of saying how much better they’re doing on new leases versus old ones—was up over 24%, which speaks to the healthy demand and pricing environment.
Operational Strength and Financial Momentum
On the manufacturing side, profit from the Rail Products Group improved by 68%, thanks to tighter labor controls and better execution, even though revenue itself didn’t move much. Operationally, Trinity brought in $588 million in cash flow, and also logged $57 million in gains from lease portfolio sales. Return on Equity came in at 13.3%, with the adjusted figure reaching 14.6%, which puts them right in the zone they’ve been aiming for.
Looking toward 2025, the company expects industry-wide deliveries of around 35,000 railcars. Trinity plans to invest between $300 million and $400 million into its fleet, along with an additional $45 million to $55 million in capital spending for operations and administration. They’re forecasting earnings per share between $1.50 and $1.80, not including any one-off items.
The tone from leadership was confident. CEO Jean Savage pointed to stronger earnings and more consistent operations as signs that the business is becoming less cyclical and more stable. The guidance for next year shows they’re expecting leasing to continue improving, even if the overall number of new railcar deliveries slows a bit. All in all, it sounds like a company settling into a more predictable and efficient rhythm.
Management Team
Trinity Industries is led by a group of executives with deep roots in industrial operations, finance, and logistics. At the center is President and CEO Jean Savage, who stepped into the top role in early 2020. She came with extensive experience in the industrial sector, including a leadership role at Caterpillar, and has since earned recognition for her work in the rail industry. Her leadership style has focused on efficiency, long-term planning, and strengthening the company’s recurring revenue base.
CFO Eric Marchetto brings a strong internal perspective, having previously served as Group President of TrinityRail. His grasp of both the operational and financial sides of the business adds a layer of continuity that’s been valuable during strategic shifts. Other key players include Stephen Sheridan, the Chief Commercial Officer, and Robert Hulick, who leads the leasing division. Together, this team has guided Trinity through both market cycles and internal realignments with a steady hand.
The Board of Directors, chaired by Leldon Echols, includes members with varied expertise across industries, offering governance and oversight that keeps the company grounded in long-term goals while still responsive to current challenges.
Valuation and Stock Performance
Trinity’s stock has seen its share of ups and downs over the past year. It’s recently been trading around $28.86, with a 52-week high of $39.83 and a low of $25.89. Market cap sits near $2.3 billion, placing it firmly in mid-cap territory. The current valuation shows a price-to-earnings ratio of about 15.5 and a price-to-book around 2.17—levels that suggest a fair valuation relative to its sector peers.
While the company hasn’t had a breakout performance in recent months, there’s been a noticeable shift in investor expectations. Analysts have landed on a consensus “Hold” rating, with a price target average around $35.50. That points to modest upside potential of roughly 23% from where the stock sits today. It’s not a high-conviction buy, but it does show that many on the Street are giving the company credit for operational stability and dividend consistency, even if revenue growth has slowed.
Risks and Considerations
Like any capital-intensive business, Trinity’s financial structure is one of its primary risks. Debt levels are high, with a total liability figure exceeding $7.5 billion. That’s a lot of leverage, and in a rising interest rate environment, it leaves the company vulnerable to increases in borrowing costs. It also limits flexibility if a downturn were to last longer than expected.
Then there’s the cyclical nature of its industry. Railcar manufacturing and leasing follows broader economic trends. When demand for shipping and logistics slows down, Trinity feels it quickly. And because the customer base isn’t especially diversified, losing one or two major clients could have an outsized impact.
The company also faces logistical risks—supply chain delays, labor availability, and cross-border shipping constraints all have the potential to disrupt operations. While management has taken steps to mitigate some of these risks, they’re still largely external and unpredictable.
There’s also increasing scrutiny around ESG-related performance. Trinity sits in the middle of the risk spectrum, but ESG factors are gaining more weight in investment decisions. For a business tied to transportation and manufacturing, ongoing improvement in environmental compliance and governance transparency will matter more going forward.
Final Thoughts
Trinity Industries is a company that’s been through economic cycles and knows how to operate through them. Its leadership team has taken a thoughtful, measured approach to growth, with a focus on maximizing returns from its core leasing business and maintaining steady dividend payments.
Valuation metrics look reasonable at current levels, and while growth isn’t explosive, the company’s consistent cash flow gives it a foundation that many investors look for in uncertain markets. The challenges are real—particularly the leverage and sensitivity to macro trends—but so is the stability of recurring revenue and the resilience of its core business model.
For those keeping an eye on businesses that know how to operate in cyclical environments and keep shareholders in mind, Trinity remains a name to watch.