

Updated April 2025
Timken isn’t a name that pops up in everyday conversations, but behind the scenes, this company plays a vital role in keeping global industry running. Whether it’s locomotives, wind turbines, or heavy-duty mining equipment, Timken’s engineered bearings and mechanical components are the kind of essentials that rarely get noticed—until they’re not working. And for long-term dividend investors, that kind of quiet reliability can be a real asset.
Based in North Canton, Ohio, Timken has been around since the late 1800s, building a business that stands the test of time. It serves a diverse range of industrial customers and has managed to stay relevant through smart acquisitions and innovation in its product lines. Now, with shares down significantly over the past year and trading near 52-week lows, investors focused on income might be eyeing the stock more closely.
Let’s dig into what’s been happening recently, then shift gears to the dividend—because that’s what income investors care about most.
Recent Events
It’s been a rocky stretch for Timken’s stock. Over the past year, shares have fallen more than 20%, which clearly reflects some market skepticism. Whether it’s concerns over slowing global industrial demand or just broader volatility, the stock has struggled to regain footing. At the moment, it’s trading at around $68, just above its 52-week low of $66.76.
What’s interesting is that earnings are actually trending in the opposite direction. While quarterly revenue came in slightly lower year-over-year, down 1.6%, earnings have grown by over 21%. That kind of divergence is worth noting—especially when the company is still generating healthy margins. The operating margin is above 10%, and net income margins are holding close to 8%.
From a cash standpoint, things look sturdy. Free cash flow sits at roughly $375 million, and the company holds nearly $390 million in cash. Debt is there—about $2.18 billion in total—but with a current ratio north of 3.0, liquidity isn’t an issue.
It’s clear that the market has its reservations, but from an income investor’s point of view, the foundation still looks solid.
Key Dividend Metrics
📈 Forward Dividend Yield: 1.98%
💸 Annual Dividend Rate: $1.36 per share
🧮 Payout Ratio: 27.05%
📆 Next Dividend Date: March 7, 2025
🕰 Ex-Dividend Date: February 25, 2025
📊 5-Year Average Yield: 1.75%
📈 Dividend Growth (5-Year Avg): Consistent and measured
✅ Dividend Safety: Supported by strong free cash flow
Dividend Overview
The dividend yield at just under 2% won’t grab headlines, but it’s part of a reliable, steady approach that long-term investors tend to respect. More importantly, the payout is well-supported by earnings and cash flow.
With earnings per share sitting at $4.99, and the dividend totaling $1.36 annually, the payout ratio is just a touch over 27%. That’s a healthy number, showing the dividend is well-covered with room to grow. In fact, based on the company’s free cash flow alone—nearly four times the amount needed to fund the dividend—there’s very little concern about its sustainability.
What you’re getting here isn’t a flashy yield, but rather a dependable income stream from a company that prioritizes shareholder returns without compromising operational strength. And that kind of balance is worth something, especially in more volatile sectors like industrials.
Dividend Growth and Safety
Timken has quietly built a track record of growing its dividend over time. The increases haven’t been dramatic, but they’ve been consistent—think mid-single digits most years. That might not excite high-yield chasers, but for those who care about compounding income and sustainability, it’s a solid showing.
The company’s approach to capital allocation has been conservative and thoughtful. Even with a fair amount of capital tied up in industrial operations and supply chains, management continues to return cash to shareholders without stretching the balance sheet. And with cash flow this strong, there’s a good chance that pattern continues.
As for dividend safety, there’s little to worry about. Debt is manageable, liquidity is strong, and the business is still producing significant cash even with softer revenue trends. With a beta of 1.37, the stock itself might move around a bit more than average, but the dividend is anchored by fundamentals.
For income investors looking for a dependable payout that can gradually grow over time, Timken checks a lot of boxes. It may not be loud, but it’s reliable—and in the world of dividends, that can go a long way.
Chart Analysis
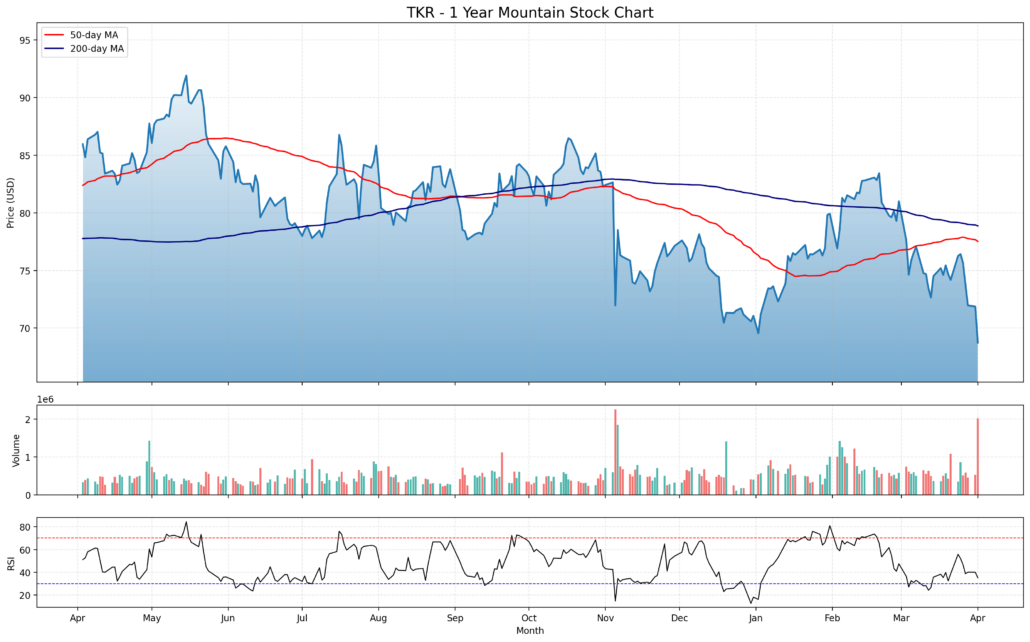
The one-year price chart for Timken (TKR) paints a clear picture of a stock that’s been under sustained selling pressure, especially over the past six months. The gradual shift in trend, confirmed by both the moving averages and the Relative Strength Index (RSI), suggests that this isn’t just noise—it reflects a deeper shift in sentiment that continues to play out.
Trend and Moving Averages
At the top of the chart, the price movement shows a definitive rollover. What started as a relatively steady uptrend last spring shifted into a gradual downtrend by mid-summer, and that trend has only strengthened. The 50-day moving average (in red) crossed below the 200-day moving average (in blue) several months ago, which typically signals a longer-term trend reversal. That crossover has since widened, further underscoring the weakening price structure.
The price has consistently struggled to stay above either of these moving averages, and any attempts to rally have been short-lived. Instead, we’re seeing a steady pattern of lower highs and lower lows, a classic technical sign of distribution and continued selling interest.
Volume Behavior
The volume profile over the past year has been telling. While day-to-day activity has been moderate, there are notable spikes during key sell-offs, particularly in late October and again in early April. These high-volume down days tend to confirm strong conviction on the part of sellers, not just passive weakness.
There hasn’t been a meaningful pickup in volume during rebound attempts. That lack of strong buying pressure suggests the stock hasn’t yet found a base or attracted a wave of new entrants looking to take advantage of the lower levels.
Relative Strength Index (RSI)
Looking at the RSI at the bottom of the chart, we can see that momentum has shifted decisively to the downside. The RSI has spent extended periods in the 30–50 zone, and most recently dipped near oversold levels again as the stock slid to fresh lows. What’s particularly important here is the inability to reclaim the 50–60 RSI range, even during bounce attempts. That’s typically a red flag for sustained weakness.
This RSI behavior supports the idea that momentum remains negative, and until that reverses, the trend likely stays in place. There’s no sign of bullish divergence or a reversal setup at the moment.
Price Action and Recent Candles
Zooming in on the most recent five candles, the story is pretty straightforward. The stock has been declining sharply with strong downward momentum. The candles show wide ranges and mostly close near their lows—another bearish signal. There’s little in the way of long lower wicks, which would otherwise suggest buyers stepping in on dips. Instead, the lack of wick activity near the bottoms implies there’s not yet a strong defense forming.
The last candle in particular confirms this with a large red body and minimal tail, paired with higher volume. That sort of move tends to signal a breakdown rather than a shakeout.
Broader Cycle Position
Putting all of this together, the stock appears to be deep in a markdown phase. The earlier part of the chart—April through July—looked like the tail end of a markup, which slowly transitioned into distribution from August through early November. The failed rallies and increased volatility during that window hinted at weakening demand.
From there, the move into markdown has been pretty textbook. Lower highs, breakdowns on volume, and no clear signs of support catching. The RSI confirms the lack of momentum, and the moving averages are aligned against the price.
There’s no evidence yet of re-accumulation or stabilization. What’s happening now is still decisively part of that downward leg, and the technical signals are all pointing to more work needed before a base can form.
Balance Sheet Analysis
Timken’s balance sheet tells the story of a company that’s been steadily building muscle, even if it’s been skipping leg day in the net tangible assets department. Total assets have climbed to just over $6.4 billion, up nicely from $5.1 billion a few years ago. At the same time, equity has kept pace, growing to nearly $3 billion—an encouraging sign that the company isn’t just piling on debt to fuel growth. In fact, working capital has also expanded to $1.7 billion, giving Timken a solid liquidity cushion for navigating any industrial slowdowns or supply chain hiccups.
Now, the debt story isn’t flawless. Total debt stands at about $2.18 billion, down from the previous year but still materially higher than it was in 2021. Net debt sits at $1.69 billion, which isn’t alarmingly high but does suggest the company is making the most of leverage—hopefully with fewer interest rate headaches than most of us with a mortgage. Tangible book value is slim, at just $436 million, but that’s typical for companies in heavy industry where intangibles and long-life assets skew the picture. All in, this is a balance sheet that’s not flashy but gets the job done: plenty of flexibility, decent debt control, and enough working capital to keep the gears turning.
Cash Flow Statement
Timken’s cash flow performance over the trailing twelve months shows a business that’s still generating solid operating muscle. Operating cash flow came in at $475.7 million, holding steady from the prior year, even with some softening in revenue. Free cash flow landed at $305.7 million—more than enough to cover dividends and maintain some flexibility. It’s not explosive growth, but it’s consistent and efficient, especially for a company dealing with industrial cycles.
On the investing side, outflows of $304.6 million reflect ongoing capital investments, which is a sharp pullback from the prior year’s heavier spending. The company seems to be returning to a more measured pace after a surge in prior-year investments. Financing cash flow was negative at $194.8 million, primarily due to aggressive debt repayments of over $2.2 billion, which outweighed new issuances. That kind of balancing act, combined with only modest share repurchases, suggests management is keeping a tight rein on capital deployment. The ending cash position of $373.6 million keeps the company in a healthy liquidity spot without hoarding resources.
Analyst Ratings
📉 In recent analyst activity, Jefferies downgraded Timken (TKR) from a “Buy” to a “Hold” rating, adjusting their price target downward to $70 from the previous $90. This change reflects concerns over potential volume declines and margin pressures, attributed to weakening short-cycle demand and tariff-related challenges. There’s a sense that some of the near-term catalysts have fizzled, prompting a more cautious stance.
📈 On the flip side, Bank of America took a more optimistic view earlier this year, upgrading Timken from “Underperform” to “Neutral” and bumping their price target to $78. The upgrade was driven by a more constructive view on the company’s execution and a belief that some of the risks were already priced in. They also noted improvements in free cash flow generation as a positive sign.
🎯 Right now, the consensus price target among analysts sits at approximately $90.33. Estimates range from a conservative $73 to a more bullish $99, which leaves room for potential upside of nearly 17% from recent price levels. While opinions vary, the overall outlook reflects cautious optimism, especially if margins can hold up in a softer demand environment.
Earning Report Summary
Mixed Results, But Solid Execution
Timken’s most recent quarterly earnings were a bit of a mixed bag, but there’s no denying the company held its ground where it counted. Revenue for the fourth quarter came in at $1.07 billion, which was slightly below last year’s number. The dip—about 1.6%—was mostly tied to softer demand in a few regions, especially in Europe. Organic sales were down 2.5%, so this wasn’t just about currency or acquisitions. That said, it wasn’t all doom and gloom.
Earnings per share came in at $1.01 on a GAAP basis. Once you strip out the one-time items, adjusted earnings were $1.16—actually a nice surprise to the upside. That kind of outperformance, especially when revenue is trending lower, usually means a company is keeping its costs in check and managing operations with discipline. And that’s exactly what Timken seems to be doing.
Full-Year Numbers and a Look Ahead
Zooming out to the full year, sales were just over $4.6 billion, which marked a 4.1% decline from the previous year. Again, most of that can be traced to demand cooling off in some industrial segments. But margins held up well, with an operating margin over 10%, showing that the company hasn’t let the softer environment eat into profitability too much.
Cash flow continues to be a strong point. Operating cash flow over the past year hit $475.7 million, which gives Timken plenty of room to reinvest in the business and return capital to shareholders. Debt remains manageable, and the company’s balance sheet looks stable enough to weather a choppy macro environment.
Management struck an optimistic tone for the road ahead. They plan to lean into high-return product categories and keep working on cost efficiency. There’s also a focus on expanding service offerings and unlocking more cross-selling potential. It’s not a flashy story, but it’s one of steady execution and positioning for long-term gains.
Management Team
Timken’s leadership has seen a refresh that could signal a new chapter for the company. In late 2024, Tarak Mehta stepped in as the new President and CEO. He brings years of experience from ABB, where he led their Motion business, and he’s expected to bring a sharper focus on operational efficiency and strategic expansion. His background in industrial technology makes him a natural fit for Timken’s evolving needs.
Supporting Mehta is Philip Fracassa, who has been the CFO since 2014. Fracassa has played a major role in shaping Timken’s financial strategy, overseeing steady improvements in margins, and maintaining a strong balance sheet. His steady hand will likely help maintain continuity even with the leadership change at the top. Other key players include Christopher Coughlin, heading up Industrial Motion, and Hansal Patel, who serves as General Counsel. The team as a whole blends industry experience with a steady, measured approach to long-term planning.
Valuation and Stock Performance
Timken’s shares recently traded around $75.68, with a market cap just north of $5.3 billion. The stock has had its swings, ranging from a 52-week high of $94.71 to a low around $69. It’s been a bumpy ride over the last year, but nothing too out of character for an industrial company navigating shifting macro conditions.
From a valuation perspective, things look reasonable. The EV/EBITDA sits just under 8, and the P/E ratio is around 13.8. These aren’t eye-popping numbers, but they reflect a company that’s priced in line with its fundamentals. Timken’s enterprise value of $6.63 billion shows a healthy balance between debt and equity. More importantly for income-oriented investors, the company has kept its dividend steady, with a $1.35 per share payout in 2024. That consistency gives it a dependable profile even when the stock price moves around.
Risks and Considerations
No investment is without risk, and Timken is no exception. One of the big ones here is exposure to global economic cycles. Demand for industrial parts and motion systems can ebb and flow based on capital spending, especially in manufacturing-heavy regions. If things slow down globally, it could weigh on revenue.
There’s also the matter of raw material costs. Fluctuations in steel and other inputs can impact margins, and while Timken does hedge and pass through some of those costs, there’s always a lag. Then there’s the ever-present challenge of supply chains. While disruptions have eased a bit, logistics and component availability still carry a risk factor for operations.
Environmental and regulatory risks are also worth noting. As the world leans into greener standards, Timken, like most industrial firms, will need to continue investing in compliance and sustainability practices to keep up. That could mean higher costs down the line if not managed proactively.
Final Thoughts
Timken is operating in a space that doesn’t always get the spotlight, but it plays a critical role across multiple industries. The recent leadership change adds a bit of intrigue, especially with a seasoned executive now at the helm. Financially, the company looks sturdy, with cash flow to support its dividend and capital needs. The valuation feels grounded in reality, and the dividend is well-covered.
While risks remain—particularly around economic cycles and input costs—the company has weathered those kinds of challenges before. There’s a quiet consistency to Timken’s approach that might not make for exciting headlines, but for those looking for a steady industrial name with dependable management, it’s worth paying attention to how this next phase unfolds.