

Updated 3/26
Stock Yards Bancorp has been steadily gaining traction, delivering results that quietly stand out in a crowded financial sector. Over the past year, its stock has rallied over 40%, far outpacing the broader market and catching the eye of income-focused investors. That kind of performance doesn’t come out of nowhere—it’s built on solid fundamentals and a clear operational strategy.
In its most recent quarter, the company reported double-digit growth in both revenue and earnings. That’s impressive for any bank, especially one with a more regional footprint. The stock is trading just shy of its 52-week high, a sign of continued investor confidence and strong momentum.
While some banks chase rapid expansion or shift strategies with the wind, Stock Yards sticks to what it knows: building relationships in its core markets, running a tight lending operation, and delivering consistent financial results. It’s not flashy, but it’s dependable.
Key Dividend Metrics
📈 Forward Yield: 1.77%
📆 Dividend Increases: 13 consecutive years
💵 Payout Ratio: 31.36%
📊 Average 5-Year Yield: 2.24%
🧱 Dividend Stability: Strong
📅 Next Payment Date: April 1, 2025
⏰ Ex-Dividend Date: March 17, 2025
Dividend Overview
The dividend from Stock Yards Bancorp isn’t the highest out there, but it’s been one of the more reliable ones. Currently offering an annual payout of $1.24 per share, the yield sits at just under 1.8%. It’s a modest number on paper, but it comes with a reassuring sense of consistency.
This is a company that’s increased its dividend for 13 years straight. That track record tells you a lot about how seriously management takes returning value to shareholders. More importantly, the dividend is well-covered, with a payout ratio just a hair above 30%. That leaves plenty of breathing room to keep it going, even in less favorable economic environments.
Dividend Growth and Safety
Steady growth has been a hallmark of Stock Yards’ dividend. No dramatic leaps, no sudden pauses—just consistent, measured increases year after year. That kind of pacing speaks to a long-term mindset rather than chasing short-term approval from the market.
The financials back up the reliability. Return on equity comes in at nearly 13%, while return on assets is comfortably above 1%. These are healthy figures that suggest a bank operating well within its means. There’s no need for acrobatics to support the dividend—it’s paid out of real, sustainable earnings.
Even more important is the conservative approach management takes to risk. The company hasn’t overextended in pursuit of growth, nor has it taken outsized bets to boost profits. That sort of discipline is what gives the dividend its staying power.
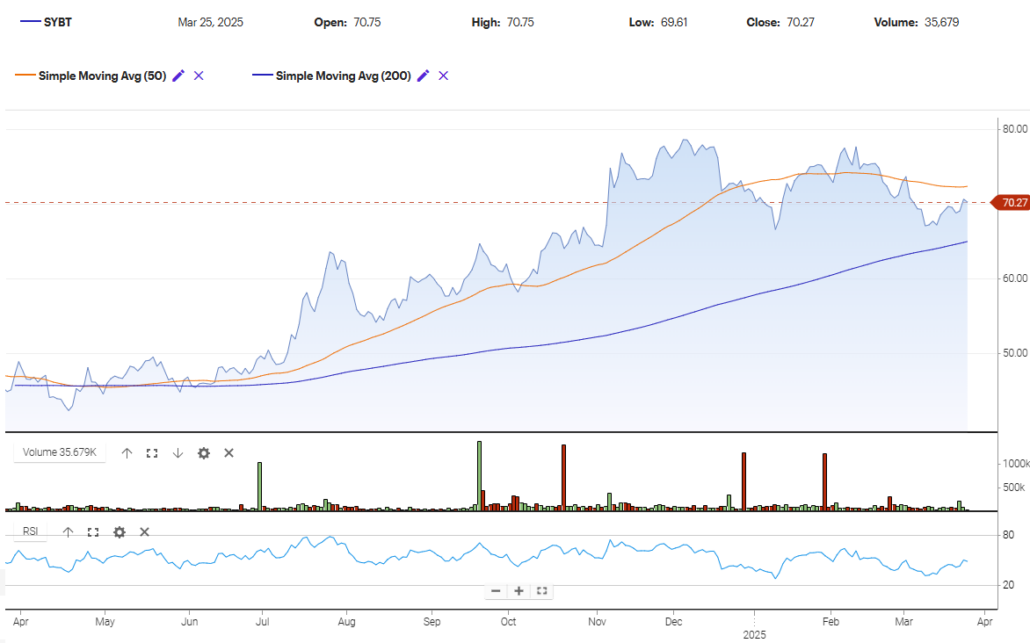
Chart Analysis
Current Trend and Moving Averages
Stock Yards Bancorp (SYBT) has been trading in a broad uptrend since the middle of last year, with a particularly strong run from late July through early December. That climb pushed prices significantly above both the 50-day (orange line) and 200-day (blue line) moving averages. However, the recent price action shows a cooling off.
The 50-day moving average, which had been steadily rising for much of the past year, is now flattening and beginning to slope slightly downward. This hints at a loss of short-term momentum. Price has also dipped below this moving average on several occasions since mid-February, which suggests that bullish conviction is no longer as strong as it once was. Meanwhile, the 200-day moving average continues to climb at a measured pace, reflecting longer-term strength and support around the $65 level.
At the current price of $70.27, SYBT is caught between both key moving averages—nudged just below the 50-day and still sitting well above the 200-day. This puts it in a consolidation zone, where traders are trying to decide the next direction.
Volume Patterns
Looking at the volume beneath the chart, the spikes are few but meaningful. Large green volume bars in July and again in October coincided with major upward pushes in price. These were strong accumulation days—heavy buying interest that helped fuel the rally. However, the red volume bars in early February stand out as well. These higher-volume down days point to increased selling pressure, perhaps as the stock reached resistance near $80.
More recently, volume has dried up, hovering at lighter-than-average levels. This drop in participation can often precede a breakout or breakdown, as traders wait on the sidelines for a clear direction. The lack of conviction over the past few weeks could mean a larger move is setting up once buyers or sellers step back in decisively.
Relative Strength Index (RSI)
The RSI in the lower panel has been trending below 50 for the better part of the last two months. That suggests momentum has faded, and the stock is no longer in overbought territory. Back in October and early December, RSI readings pushed toward the 70 mark—those were moments of strong bullish sentiment. Since then, however, the indicator has pulled back and now sits in a neutral zone, giving no clear bullish or bearish signal.
It’s worth noting that RSI never fell into oversold levels during the recent pullbacks. That shows some resilience, as the price cooled but didn’t trigger panic selling or deep momentum loss.
Candle and Price Behavior
Focusing on the last five daily candles, there’s a subtle but important detail—longer lower wicks have appeared in several of them. This often means buyers stepped in after initial selling pressure, pushing the price back up before the close. It shows there’s still interest in defending this $69–$70 area. None of the candles show dramatic swings, which suggests that while the volatility is low, neither bulls nor bears have taken full control.
The most recent candle closed at $70.27, just under the open of $70.75, forming a small-bodied candle with a relatively narrow range. That kind of indecision candle typically signals a pause or transition rather than a breakout move.
Analyst Ratings
Stock Yards Bancorp (SYBT) has been drawing renewed interest from analysts, leading to some updates in its ratings over the past few months. One notable shift was an upgrade from a neutral stance to a more bullish outlook. This move was largely driven by the bank’s strong quarterly results, steady loan growth, and consistent dividend performance.
📈 Analysts pointed to the company’s impressive earnings momentum and sound credit quality as reasons for the upgrade. Even in a mixed economic environment, SYBT has managed to keep margins healthy while maintaining a conservative approach to risk. That balance between growth and caution has made it more appealing in the current rate climate.
💰 The consensus 12-month price target now sits at $82.50, implying meaningful upside from where shares are currently trading. That target reflects expectations for continued operating strength, modest expansion in return on equity, and a stable payout policy.
🏦 Analysts also noted that the company’s regional focus has turned into a strength rather than a limitation. Its deep roots and strong brand presence in core markets have translated into stable deposits and recurring customer relationships—important attributes in a time of shifting banking dynamics.
📊 While not every analyst has taken a bullish stance, the sentiment has clearly leaned more positive. The stock’s performance over the last year has helped build confidence, and with management continuing to deliver, there’s a growing belief that SYBT may still have room to run.
Earning Report Summary
Stock Yards Bancorp wrapped up 2024 on a strong note, showing solid growth across its core business lines. The fourth-quarter numbers were encouraging and reflected steady momentum from earlier in the year.
Strong Finish to the Year
Net income for the fourth quarter came in at $31.7 million, which works out to $1.07 per diluted share. That’s a noticeable jump from the $0.82 per share they posted in the same quarter last year. For the full year, earnings climbed to $114.5 million, or $3.89 per share, up from $3.67 in 2023. The results paint a picture of a company that’s consistently moving forward without trying to overextend.
Loan Growth Keeps Driving Results
A big contributor to that performance was loan growth, which has remained a key theme for the bank. Total loans grew by $749 million over the past year, with $242 million of that growth happening just in the fourth quarter. That growth wasn’t limited to one area either—it was spread across multiple loan types and markets. One standout was the Indianapolis market, which crossed the $1 billion mark in total loans for the first time.
Loan yields also moved higher, with the average yield sitting at 6.10% for the quarter. That’s up 31 basis points from a year ago, giving a nice boost to interest income.
Margins and Deposits Moving in the Right Direction
Net interest income rose 13% year-over-year, helped by both loan growth and improved loan yields. The bank’s net interest margin also widened to 3.44%, up from 3.25%, showing it’s managing to grow both its top line and profitability per dollar lent.
Deposits grew as well, up $440 million in the fourth quarter alone and $496 million over the full year. Growth came from every region the bank operates in, which is a good sign that they’re competing well for customer deposits. Time deposits and money market accounts played a big role in that increase.
Cost Pressures Kept in Check
Non-interest expenses were up slightly—about 3% compared to the same quarter last year. Most of that came from higher compensation and benefits, which is often expected when loan growth drives demand for more staff and performance bonuses. It’s a reasonable uptick and suggests the bank is still running a tight operation.
Credit Quality Holds Up
Credit metrics held steady, and the provision for credit losses came in at $2.7 million. That was mostly tied to the jump in loan balances rather than any deterioration in credit. Overall, the bank continues to show a strong handle on risk.
All in all, Stock Yards finished 2024 with solid growth and stable fundamentals, setting the tone for the year ahead.
Financial Health and Stability
When it comes to financial footing, Stock Yards looks sturdy. With more than $300 million in cash and manageable debt levels around $529 million, the balance sheet is in good shape. Cash per share is over $10, which is a solid cushion for a company of its size.
Book value per share sits just below $32, and with shares trading over $70, the price-to-book ratio is a bit above 2. While that’s on the higher side for banks, it reflects the market’s trust in the company’s consistency and profitability.
The company’s approach to lending and risk remains cautious. It hasn’t exposed itself to the more volatile corners of the credit market, and its operations remain rooted in areas it knows well. This kind of local knowledge and conservatism tends to pay off over time, especially when the broader economy hits turbulence.
Valuation and Stock Performance
Valuation-wise, SYBT isn’t a deep-value play. With a trailing P/E of 18 and a forward P/E just under that, the stock trades at a premium to some peers. That said, it’s the kind of premium investors are often willing to pay for a dependable performer.
Price-to-sales is close to 6, and price-to-book comes in around 2.2. Not cheap, but not unreasonable for a bank that keeps delivering. The 52-week performance tells its own story, with the stock gaining more than 40% and staying in the upper range of its recent trading channel.
The beta is 0.85, meaning it tends to be a bit less volatile than the overall market. That’s an attractive trait for investors who prefer a smoother ride, especially in a sector that can sometimes get knocked around by interest rate chatter and macroeconomic headlines.
Risks and Considerations
No bank stock is without its risks, and Stock Yards is no exception. One area to watch is its regional concentration. While it has expanded its footprint, the company remains heavily tied to specific markets. Any slowdown in those areas could ripple through its balance sheet.
There’s also the broader rate environment to consider. If interest rates drop or loan demand softens, revenue growth could slow. That’s a reality for most banks, and SYBT is no different.
Short interest is hovering around 7% of the float, which suggests a degree of caution among some investors. It’s not alarmingly high, but it does hint at a divide in sentiment—some are betting on continued strength, while others may be expecting a pause after a strong run-up.
Lastly, the dividend yield, while reliable, may not satisfy investors who are specifically chasing higher income. This is a stock for those who want a blend of capital appreciation and income—not a high-yield pick out of the gate.
Final Thoughts
Stock Yards Bancorp isn’t trying to be something it’s not. It’s a steady, well-run regional bank with a clear focus on long-term performance. For investors who value a growing dividend, financial discipline, and a track record of consistent execution, there’s a lot to like.
The yield may not knock your socks off, but it comes with reliability that’s tough to find these days. With a strong balance sheet, conservative lending practices, and a history of shareholder-friendly decisions, Stock Yards makes a strong case for being part of a long-term income portfolio.
In a world full of short-term noise, this is a stock that rewards patience and consistency.