

Updated 3/26
Stanley Black & Decker has been around for nearly two centuries, building a name that’s as much a part of American industrial history as it is of today’s home improvement and construction scenes. Known best for its power tools, hand tools, and industrial hardware, the company serves a broad audience—from DIY homeowners to large-scale contractors.
But in recent years, SWK has been adjusting its business. After the pandemic-driven highs, the company has faced a more complicated market, juggling excess inventory, inflationary pressures, and a slower housing sector. For investors focused on dividends, though, what really matters is where things stand now and whether the income stream is reliable in the years to come.
Recent Events
Stanley Black & Decker has been knee-deep in a strategic turnaround. The last couple of years saw the company dealing with bloated inventories and compressed margins, thanks to overly optimistic stocking during the COVID years and rising costs.
In response, management took a scalpel to the business—cutting costs, divesting non-core units, and dialing in on operational efficiency. The results are showing some early traction. Revenue has stabilized, only dipping slightly year-over-year. But more importantly, cash generation has improved. The company now posts over $1 billion in operating cash flow and around $767 million in free cash flow. That’s a meaningful improvement and, for dividend investors, an encouraging sign.
Key Dividend Metrics
📅 Forward Yield: 4.18%
💵 Annual Dividend: $3.28 per share
📈 5-Year Average Yield: 2.79%
📊 Payout Ratio: 172.49%
🛠️ Dividend Growth Streak: 56 years and counting
📆 Last Dividend Paid: March 18, 2025
🔻 Ex-Dividend Date: March 4, 2025
Dividend Overview
Let’s start with what stands out—SWK’s 4.18% forward yield. That’s well above its historical average and puts it firmly in high-yield territory. With rates still elevated, yields like this aren’t rare, but for a Dividend King with over five decades of increases under its belt, it’s certainly attractive.
However, that yield doesn’t come without baggage. The payout ratio is currently over 170%, which suggests earnings alone aren’t covering the dividend. But context matters. The company has had a rough stretch, and earnings have taken a hit. Management has kept the dividend going through worse, and there’s no sign they’re stepping away from that commitment.
Dividend Growth and Safety
The dividend has grown consistently over the years, albeit modestly. The average growth rate over the last decade is just under 5%, which is solid, though not spectacular. In tougher times, that growth slows, but the company has maintained its payout like clockwork.
What matters more right now is whether it’s safe. While the earnings-based payout ratio is elevated, the company is funding the dividend through cash flow—and just barely. Free cash flow covers the current dividend, but there’s not a huge margin of safety. If the turnaround continues and margins improve, that coverage will widen. For now, it’s a manageable risk.
Chart Analysis
Current Phase in the Market Cycle
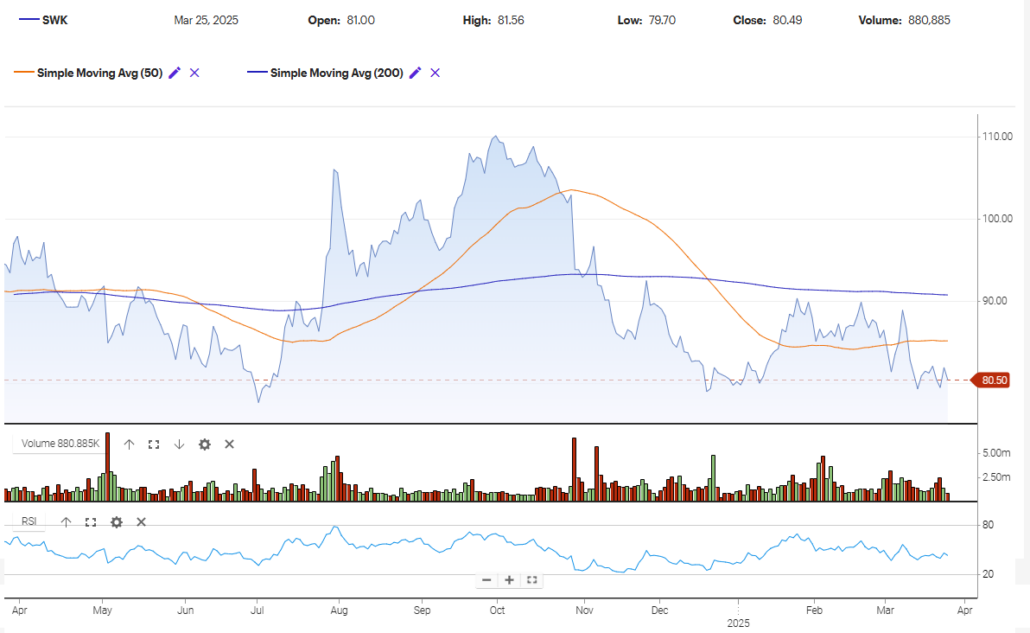
The chart for Stanley Black & Decker (SWK) is showing characteristics of the markdown phase of the Wyckoff market cycle. This phase typically follows distribution and is marked by a series of lower highs and lower lows, which is clearly visible here. After peaking in late summer, the price started trending downward and has remained below both the 50-day and 200-day moving averages for a sustained period.
This kind of prolonged weakness, particularly with the 50-day SMA sloping downward and staying well below the 200-day SMA, reinforces the idea that we’re not in a simple pullback but a longer-term downtrend. The stock attempted a brief recovery in early 2025, pushing slightly above the 50-day moving average, but failed to sustain momentum and rolled over again.
Volume and Participation
Volume patterns support the markdown narrative. During declines, volume tends to pick up, indicating stronger selling pressure. We see notable spikes in volume on red bars throughout the chart—particularly in mid-November and late February—which confirms that these downward moves are not happening on weak participation. In contrast, rallies tend to occur on lighter volume, suggesting that buying conviction remains low.
The lack of meaningful accumulation volume through the recent price base also suggests that institutional demand hasn’t stepped in yet to support a new uptrend.
Relative Strength and RSI
Looking at the RSI, the indicator has mostly stayed in the lower range over the past several months, often failing to break above the midpoint of 50. This reflects weak relative strength and momentum. While there were brief upticks in early February and mid-March, they stalled quickly, and the RSI never reached levels that would signal a robust reversal.
As of now, RSI remains closer to oversold territory, hovering below 40. This could point to a stock that is technically stretched, but oversold conditions in a markdown phase are not uncommon and don’t always result in immediate reversals.
Moving Averages and Trend Structure
The 50-day moving average is declining and trending significantly below the 200-day, creating a clear bearish alignment. The failed attempts to reclaim the 50-day average in March—followed by sharp pullbacks—reinforce the idea that sellers are still in control.
The 200-day moving average is flattening out slightly but still showing a slight downward slope, further confirming that any trend change, if it’s going to happen, is likely not yet underway.
Candlestick and Price Action – Most Recent Five Days
In the last five trading sessions, the candles show indecision and continued pressure.
- Three of the candles closed near their lows, with long upper wicks, which suggests that buyers pushed prices up during the day but were overwhelmed by sellers by the close.
- One of the candles shows a slight bounce attempt with a small real body, but volume was subdued, showing little follow-through.
- Most recent candle closed at 80.49, which is just above the recent low of 79.70. That bounce came with minimal enthusiasm, and the lower wick isn’t substantial enough to suggest strong demand stepping in yet.
This price action points to hesitant buyers and more active sellers—a common dynamic in late-stage markdown environments, just before a potential accumulation phase begins, but no clear signs of that just yet.
Analyst Ratings
📌 Stanley Black & Decker (SWK) has recently attracted a fresh round of analyst updates, reflecting a mix of cautious sentiment and longer-term optimism. As of late March 2025, the average 12-month price target among analysts is around $102.20. That’s about 30% higher than where the stock is currently trading, suggesting many still see room for recovery despite ongoing challenges. Price targets range from a low of $86.00 to a high of $120.00.
🔽 Barclays maintained a neutral stance, keeping their rating at Equal Weight while trimming their price target from $94.00 to $86.00. The downgrade in target was tied to concerns around softer margins and limited visibility in upcoming quarters. Analysts flagged ongoing cost pressures and a murky outlook in construction-related demand as key headwinds.
🟢 Jefferies, on the other hand, initiated coverage in February with a Buy rating and a price target of $103.00. Their view leaned more bullish, citing confidence in Stanley Black & Decker’s restructuring efforts and the long-term opportunity in both residential and commercial tool markets. They highlighted improving free cash flow and a more disciplined operating model as positive trends.
📈 UBS reaffirmed its Buy rating and slightly adjusted its price target from $121.00 to $120.00. While this was a minor downward revision, the tone remained constructive. UBS pointed to the company’s global scale and brand strength, as well as its consistent dividend policy, as reasons to stay positive despite some near-term uncertainty.
Overall, the sentiment is balanced. There’s clear recognition that Stanley Black & Decker still faces headwinds, especially with consumer demand and input costs. But the improving cash generation, strategic cost cutting, and long dividend history seem to be giving analysts enough reason to keep the stock on their radar.
Earning Report Summary
Solid Finish to the Year
Stanley Black & Decker closed out the fourth quarter of 2024 with $3.7 billion in net sales, which held steady compared to the same time last year. While they faced some headwinds from currency shifts and other external pressures, stronger volumes helped even things out. A 4% uptick in volume was enough to offset a similar percentage drop on the currency front.
One of the brighter spots in the report was the improvement in gross margin, which ticked up to 30.8% from 29.6% a year ago. That’s a direct result of the company’s cost-cutting push and efficiency gains. Operating expenses did creep up a bit, with SG&A hitting $855 million or about 23% of sales, compared to 22.3% in the prior year’s fourth quarter.
A Turnaround in Profitability
The bottom line showed real progress. The company swung from a pre-tax loss in the same quarter last year to a gain of $125 million this time around. After taxes, net earnings came in at $194.9 million, compared to a hefty loss of $276 million in Q4 of 2023. On a per-share basis, that meant earnings of $1.28, versus a loss of $1.84 the year before.
This turnaround reflects not just improved margins, but also tighter expense management and better execution overall. It’s a sign that the strategy management put in place to stabilize the business is starting to bear fruit.
Full-Year Snapshot
For the full year, sales came in at $15.4 billion, down slightly from $15.8 billion the year before. While that drop might not sound like a win, the quality of earnings improved. Gross margin for the year reached 29.4%, up from 24.9% in 2023. That’s a meaningful shift, showing that the company is doing more with less.
Operating expenses stayed relatively flat in dollar terms, but edged up as a percentage of sales. Still, pre-tax earnings came in positive at $241 million, swinging from a loss of $376 million in the prior year. Net income totaled $286 million for the year, translating to earnings per share of $1.89. That’s a sharp turnaround from the $1.88 per-share loss posted in 2023.
Dividend Still Growing
The company also continued to reward shareholders with steady dividend growth. In the fourth quarter, the dividend was $0.82 per share, up slightly from the previous year. For the full year, shareholders collected $3.26 per share, compared to $3.22 in 2023. It’s a modest bump, but a meaningful one for income-focused investors.
Altogether, the numbers tell the story of a company slowly finding its footing again after a tough stretch, showing early signs of stronger financial footing and a bit more breathing room heading into 2025.
Financial Health and Stability
SWK’s balance sheet isn’t perfect, but it’s holding up under the weight of recent challenges. Total debt is a little over $6.5 billion, while cash on hand is just under $300 million. The current ratio of 1.3 shows it can cover short-term obligations, but longer-term, debt reduction remains a priority.
Leverage is higher than most dividend investors might like. The debt-to-equity ratio is over 75%, and interest expenses are something to watch. That said, the company has intentionally scaled back on other capital outflows to prioritize paying down debt, which shows a disciplined approach to balance sheet repair.
Valuation and Stock Performance
Shares of Stanley Black & Decker are trading around $78, just above their 52-week low. The stock is down almost 20% over the past year, underperforming broader indices. This has created a bit of a valuation disconnect. The forward price-to-earnings ratio sits at 14.6—not dirt cheap, but certainly reasonable for a company with global brand power and ongoing recovery efforts.
From a broader perspective, the price-to-sales ratio is under 0.8, and price-to-book is sitting at 1.39. These aren’t stretch valuations. They suggest investors are still waiting for clear signs that the company’s rebound is sticking.
The stock’s technicals also show it’s trading well below its 50-day and 200-day moving averages, which reflects the broader caution from the market. Dividend-focused investors might see this as a rare chance to lock in a higher-than-average yield on a Dividend King in transition.
Risks and Considerations
This is not a flawless story. Several red flags remain on the board.
First, the payout ratio is uncomfortably high. Even with better cash flow, there’s not much wiggle room. If operating conditions worsen again, the dividend could be pressured. Second, the company’s debt load is substantial, and while manageable, it adds to the risk profile.
Then there’s the broader economic backdrop. SWK’s fortunes are tied to housing, construction, and consumer spending. Higher interest rates and a cautious consumer can slow tool demand. And with global operations, they’re also exposed to currency swings and supply chain disruption.
Add in that short interest is hovering around 6.8% of the float, and it’s clear some market participants are still skeptical about how quickly the recovery will take hold.
Final Thoughts
Stanley Black & Decker has the hallmarks of a legacy dividend name that’s weathered more than a few storms. The brand remains strong, and the long-term dividend record speaks for itself. But this is also a company in the middle of a critical transition.
For dividend investors, the 4%+ yield is hard to ignore. It’s not often you get a payout like that from a Dividend King with this kind of history. But it’s not without risk. SWK is still navigating a challenging environment, and patience will be key.
The path forward depends heavily on continued cash flow strength and margin recovery. If the company can stay on track, maintain its payout, and improve its financial footing, long-term investors may look back at this moment as an opportunity taken rather than missed.