

Updated 3/26
SS&C Technologies isn’t a name you hear tossed around in casual investment conversations. But behind the scenes, they’re powering a significant slice of the financial world. They’re not selling flashy consumer apps—instead, they focus on the back-end systems that asset managers, hedge funds, and insurers depend on every day. It’s the kind of business that keeps running quietly in the background, generating steady revenue while letting others take the spotlight.
The company has built its empire not through big brand marketing, but through a steady stream of smart acquisitions and disciplined integration. Bill Stone, who founded SS&C in 1986, still leads the firm today, keeping the vision consistent while expanding reach across financial services. For dividend investors looking for reliability over flash, that long-term consistency is worth noting.
Recent Events
SS&C closed out 2024 on a solid note. The company reported $5.88 billion in trailing twelve-month revenue, showing an 8.4% increase year-over-year. Earnings per share came in at $3.00—up nearly 28% from the prior year. These aren’t eye-popping numbers, but they signal consistent growth and effective cost management.
Free cash flow was especially strong, at $1.08 billion. That’s a key figure when evaluating dividend stability. With plenty of cash left after expenses and capital investments, SS&C has room to comfortably pay shareholders and invest in growth. The balance sheet still carries a hefty load of debt, largely due to its acquisition-heavy strategy, but the company has shown discipline in managing it.
Over the past year, the stock has climbed roughly 30%, outperforming the broader market and showing investors are starting to recognize the value here. Trading just under $84, SS&C remains below its 52-week high of $89.73, offering potential upside without feeling overheated.
Key Dividend Metrics
💵 Forward Dividend Yield: 1.19%
📅 Payout Ratio: 32.67%
📈 5-Year Average Yield: 1.17%
🧮 Dividend Growth: Slow but steady
🛡️ Dividend Coverage: Strong free cash flow supports payments
💰 Upcoming Dividend Date: March 17, 2025
🗓️ Ex-Dividend Date: March 3, 2025
Dividend Overview
At just under 1.2%, SS&C’s yield isn’t going to make headlines, but it’s quietly dependable. The payout ratio sits comfortably below 35%, showing the company isn’t stretching itself to reward shareholders. In fact, it could increase the dividend if it wanted to—but management seems to be playing it safe, favoring consistency over aggressive increases.
SS&C’s capital-light model helps here. Unlike businesses that need constant reinvestment in physical infrastructure, SS&C’s software and services leave more earnings available for dividends. This model has worked for years, and there’s no sign of it slowing down.
Dividend Growth and Safety
Dividend growth hasn’t been flashy, but it’s been steady enough to show commitment. Management doesn’t appear to be using the dividend as a headline-grabber. Instead, they’re focused on making sure the payment is sustainable and backed by real cash.
One thing working in investors’ favor is the high level of insider ownership—over 13%. That kind of skin in the game tends to promote cautious, shareholder-friendly decision-making. There’s also strong institutional interest, with over 85% of shares held by large funds. These investors tend to stick around when they see a reliable income stream.
As far as safety goes, the coverage is solid. Free cash flow easily supports the dividend, and the company’s consistent operating margins give further confidence. Unless there’s a major shift in the business, SS&C’s dividend looks built to last.
Chart Analysis
Market Cycle Position
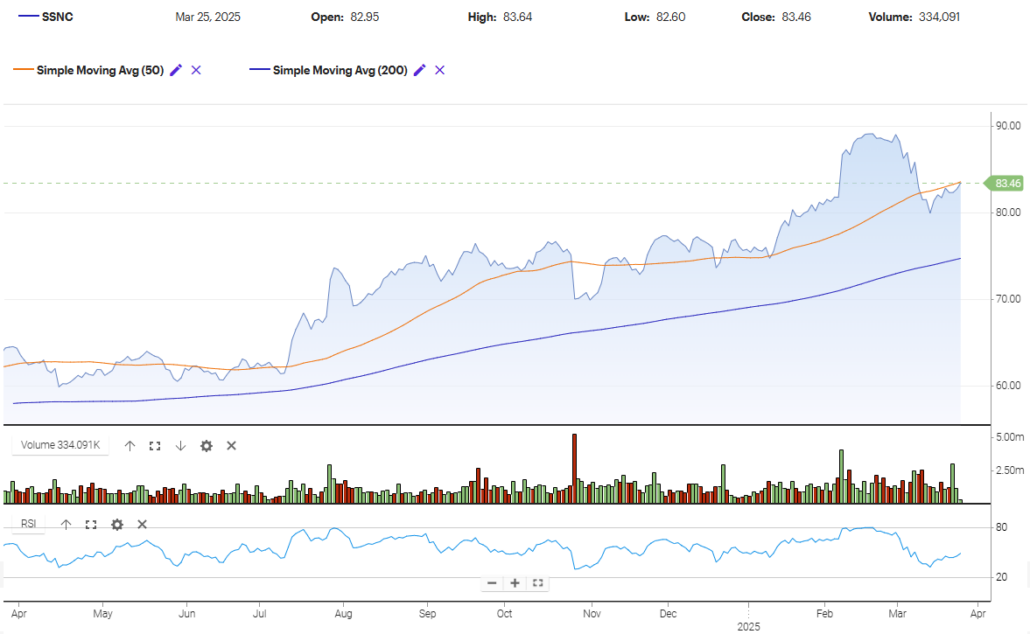
SSNC appears to be in the late stages of a markup phase, entering a possible distribution zone. The strong rally from late October through February showed classic signs of a sustained uptrend. Price hugged the 50-day moving average for months, and when it broke away to the upside in January, it did so with strong volume and conviction. That surge had the characteristics of a buying climax, particularly as the stock peaked near $90 and started to roll over.
The recent pullback in March, followed by a bounce off the 50-day average, shows that buyers are still present, but the easy gains may be behind us. The price hasn’t broken down below key support levels, but there’s visible hesitation in the price action. That type of sideways churn—especially after a strong run-up—often hints at distribution. Institutions may be offloading into strength while retail steps in late.
Moving Averages
Both the 50-day and 200-day simple moving averages are sloping upward, reinforcing the larger bullish structure. The 50-day acted as dynamic support throughout the rally, and price has remained above the 200-day for the better part of a year.
But recently, price slipped below the 50-day briefly before reclaiming it. That dip, followed by a modest bounce, suggests the uptrend is losing some of its momentum. If price fails to push higher soon, or rolls back below the 50-day again with volume, it could trigger a shift into markdown.
Volume Behavior
Volume was notably heavy during the October breakout and again during the January surge. Those spikes aligned with sharp upward moves—typical of institutional accumulation. But as price started to top out, volume became more mixed. The recent rally attempt back to $83–$84 hasn’t been accompanied by high volume, suggesting less conviction behind the move.
More importantly, the pullback from the high came on a rising volume slope, while this recovery leg is quieter. That divergence between effort (volume) and result (price movement) leans toward the idea of supply outweighing demand in the near term.
Relative Strength Index (RSI)
The RSI peaked well into overbought territory during the January rally, which isn’t unusual for strong trends. But what followed was a sharp drop in RSI, moving toward the oversold line by mid-March. That dramatic decline in RSI was faster than the drop in price, showing underlying weakness in momentum.
Currently, RSI is trying to curl back up, hovering around the low 40s. It’s still below the neutral 50 level, which means bears haven’t fully lost control yet. If RSI stalls or fails to break back above 50, it may confirm the early signs of a shift in market character.
Candle Behavior (Recent 5 Sessions)
Looking closely at the most recent five candles:
- The latest candle shows a small-bodied bar with upper and lower wicks, suggesting indecision.
- Two sessions ago, there was a long lower wick after testing support near $82.60—buyers stepped in, but not aggressively.
- The day before that showed a solid green body but on lower volume—lack of follow-through.
- A red candle before that had a long upper wick, implying sellers pushed back after a brief rally attempt.
- And five days ago, a tight-range candle printed near support, with low volume and a small lower wick.
This combination of narrow ranges, mixed wicks, and muted volume reflects hesitancy in the market. There’s no strong directional conviction right now, which is typical in early distribution or during pauses in uptrends that are tiring out.
Analyst Ratings
🟢 SS&C Technologies Holdings, Inc. (SSNC) has recently received some positive attention from the analyst community, with upgrades reflecting improving fundamentals and strategic tailwinds.
📈 In February 2025, Jefferies moved SS&C from a “Hold” to a “Buy” rating, lifting the price target from $70 to $94. The upgrade was based on growing confidence in mid-single-digit organic revenue growth and signs of improving margins. Analysts noted optimism around new product momentum, particularly with enhancements to Blue Prism, and also pointed to the potential for upcoming wins in the healthcare space with DomaniRx.
🏦 UBS kept its “Buy” rating intact but nudged the price target up to $105 from $93, showing increased conviction in the stock’s upside. RBC Capital shared a similar view, maintaining its “Outperform” rating and adjusting its target to $96 from $86.
⚖️ Meanwhile, Morgan Stanley took a more neutral stance, holding its “Equalweight” rating while modestly raising the target to $75 from $70, suggesting they still see value but expect more tempered gains compared to others.
📊 Currently, the average consensus price target across the board sits at approximately $95.90. The range is fairly wide, with the most bullish target at $105 and the most conservative around $75. Compared to the latest trading price near $83.83, this gives a potential upside in the ballpark of 14%.
💬 The key reasons cited across these updates center on consistent free cash flow, room for margin expansion, and new business wins that could begin to reflect in future quarters. While not every firm is equally enthusiastic, the broader tone leans constructive, especially as SS&C continues to deliver on execution.
Earning Report Summary
Strong Close to 2024
SS&C Technologies wrapped up 2024 on a solid note. Revenue came in at $1.53 billion for the fourth quarter, which was a healthy 8.4% increase from the same time last year. For the full year, the company pulled in just under $5.9 billion in revenue—up nearly 7% from 2023. It’s not breakneck growth, but it’s steady and dependable, which is what long-term investors often prefer.
Margins Hold Firm
On the profitability side, operating income for Q4 hit $357.9 million, showing a bit over 7% growth. Adjusted operating income was even stronger at $581.9 million, with an adjusted margin of 38%. The ability to maintain margins while growing the top line is a good sign that SS&C is scaling efficiently without letting costs get out of hand.
EPS Moving in the Right Direction
Earnings per share was another bright spot. GAAP diluted EPS for the quarter came in at $0.98, up over 27% year-over-year. On an adjusted basis, EPS landed at $1.58—an increase of more than 25%. That kind of growth shows the company is not only generating more revenue but also converting more of it into actual profit for shareholders.
Cash Flow and Buybacks
Cash flow was strong throughout the year. SS&C generated nearly $1.4 billion in operating cash, a solid jump from the previous year. That helped fund share buybacks—almost 5 million shares were repurchased in the fourth quarter alone, for a total of $365.7 million. On top of that, the company used some of that free cash to pay down $195 million in debt, which brought its net leverage down to 2.89 times EBITDA. That’s a healthy place to be, especially for a company that’s been active on the M&A front.
Looking Ahead
For the first quarter of 2025, SS&C is expecting revenue between $1.47 and $1.51 billion and adjusted EPS between $1.37 and $1.43. For the full year, the company is guiding toward $6.1 to $6.25 billion in revenue, and EPS in the $5.64 to $5.96 range.
It’s clear management sees momentum continuing into 2025. With consistent revenue growth, solid cash flow, and an eye on debt reduction, SS&C seems focused on delivering stable results while keeping options open for strategic moves down the line.
Financial Health and Stability
Financially, SS&C tells a balanced story. On one hand, they’re carrying over $7 billion in debt, which results in a debt-to-equity ratio above 100%. That’s not ideal, especially in a rising rate environment, but it’s manageable considering the company’s cash-generating power.
They’ve got about $567 million in cash on hand and a current ratio of 1.12, which shows they have enough liquidity to handle short-term needs without strain. EBITDA hit $1.9 billion, and the company’s enterprise value to EBITDA ratio is right in line with peers.
Overall, the business remains in good shape. As long as management keeps its leverage in check, SS&C’s financial health shouldn’t be a concern for income-focused investors.
Valuation and Stock Performance
From a valuation perspective, SS&C appears fairly priced with some room to run. The forward P/E is around 14.4, which is attractive for a company with this level of profitability and margin stability. Especially when you compare it to the trailing P/E of nearly 28—it suggests the market is expecting continued earnings growth.
The PEG ratio hovers just over 1.0, pointing to fair valuation based on growth expectations. The price-to-sales and price-to-book ratios—3.6 and 3.16 respectively—are reasonable for a software-based company with strong recurring revenue.
On the performance side, the stock’s recent gains tell a story of renewed investor confidence. It’s comfortably above its 200-day moving average, but not so far above recent highs that it feels risky. In fact, its current level suggests there could be more room to climb, assuming fundamentals hold.
Risks and Considerations
Even with all the positives, it’s worth keeping a few risks in mind.
First, the debt level. While SS&C has shown it can manage its leverage, it doesn’t have much margin for error if cash flow dips unexpectedly or if interest rates stay higher for longer.
Second, the company’s M&A strategy brings integration risk. Acquisitions have helped SS&C grow, but they can also create headaches if cultures clash or expected synergies fail to materialize.
Third, the business is heavily tied to the financial sector. That makes it vulnerable to downturns in asset management or capital markets. A prolonged slump in that world could eventually trickle down to SS&C.
Fourth, the yield may be too low for income investors who need higher current income. While the dividend is safe, it’s not generous. It might be better suited for those reinvesting dividends rather than relying on them for day-to-day income.
Lastly, SS&C’s beta of 1.36 suggests the stock can be more volatile than the broader market. That might be fine for some investors, but it’s something to be aware of, especially if you’re looking for smooth sailing.
Final Thoughts
SS&C Technologies isn’t going to be the centerpiece of a dividend portfolio—but it might just be a sturdy supporting piece. This is a business with strong cash flows, modest but steady dividend growth, and a long track record of disciplined execution.
The current yield may not grab attention, but it’s backed by fundamentals that matter: low payout ratio, high free cash flow, and management with skin in the game. For investors who are okay with a lower yield today in exchange for long-term reliability and some growth potential, SS&C makes a compelling case.
It’s the kind of stock that doesn’t need to shout. It just quietly goes about its business—paying, growing, and compounding over time. And sometimes, that’s exactly what you want in your dividend strategy.