

Updated 3/26
SpartanNash doesn’t aim for the spotlight—and that might be part of its appeal. Headquartered in Michigan, the company operates in a dual role as both a grocery distributor and retailer. It supplies independent grocers, military commissaries, and runs its own chain of supermarkets across the Midwest. That combination gives it a unique place in the food supply chain, and for income-focused investors, it offers a blend of consistent cash flow and a solid dividend.
Let’s break down what’s been going on recently and where the company stands for dividend investors looking for reliable income.
Recent Events
SpartanNash hasn’t made any major headlines recently, but the company’s financial story continues to evolve. Most notably, earnings came in unusually low—with net income for the last twelve months barely in the green at just $299,000. That doesn’t paint a picture of robust profitability, and it’s likely due to increased operating costs and ongoing margin pressure.
Still, the market reaction has been a bit more upbeat. The stock saw a modest boost recently, both in regular and pre-market trading. That could be a sign investors are positioning defensively or looking for higher yields in more stable sectors like food distribution.
At the same time, the company is still carrying a substantial debt load, which continues to be a central issue as interest rates stay elevated. It’s a factor that dividend investors should keep in mind going forward.
Key Dividend Metrics
📈 Forward Dividend Yield: 4.42%
💰 Annual Dividend: $0.88 per share
📅 Next Dividend Payment: April 2, 2025
📆 Ex-Dividend Date: March 21, 2025
🔁 5-Year Average Yield: 3.70%
🔒 Payout Ratio: 8,700% (yes, that’s correct)
📊 Forward Price-to-Earnings Ratio: 9.74
🧱 Debt-to-Equity: 149%
Dividend Overview
At first glance, SpartanNash’s dividend yield stands out. A 4.42% forward yield is appealing for anyone looking to generate consistent cash flow from their portfolio. It’s also comfortably above the company’s five-year average, offering a bit of extra yield for those entering at current price levels.
What might cause some pause is the payout ratio. Based on net income, it’s off the charts. However, that doesn’t tell the whole story. The real strength comes from free cash flow, which is what SpartanNash is using to keep the dividend going. Earnings might look weak, but the company’s ability to generate cash remains intact.
For income investors, that’s a key distinction. Dividends are funded by cash—not accounting profits.
Dividend Growth and Safety
SpartanNash has never been aggressive with its dividend hikes, but the company has delivered steady, modest increases over time. That measured approach fits its overall operating style—conservative and careful.
In terms of safety, the dividend is walking a bit of a tightrope. Free cash flow is enough to cover the payout, but there isn’t a massive cushion. The company has continued to prioritize the dividend, even during leaner years. As long as cash generation remains healthy, the payout looks safe in the near term.
Still, investors will want to monitor that balance closely, especially given the high debt levels.
Chart Analysis
Current Price Action and Trend Behavior
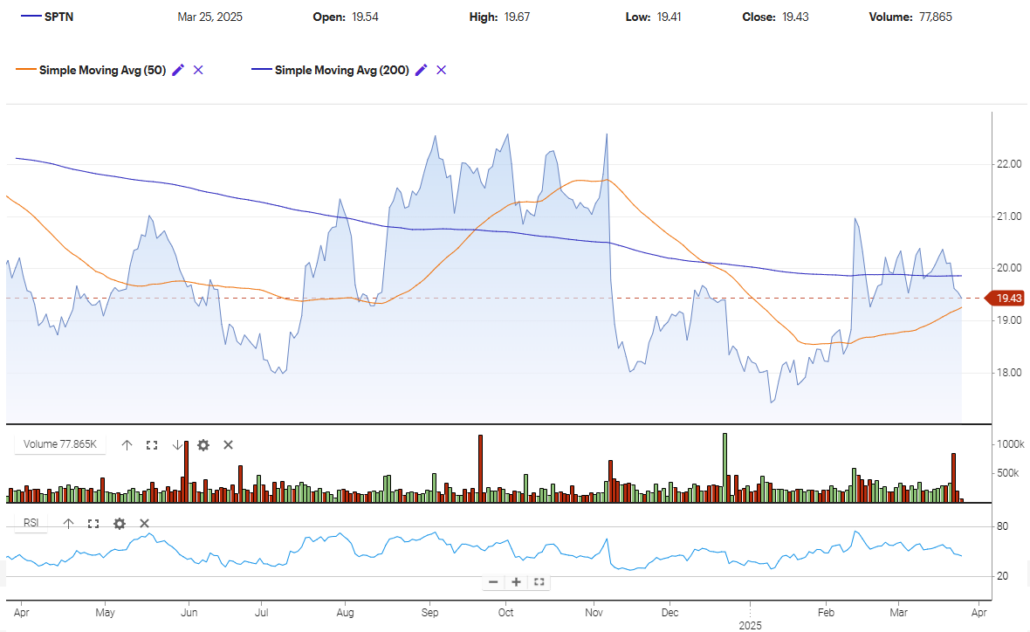
SpartanNash (SPTN) closed at 19.43 on March 25, 2025, after opening at 19.54. The intraday high hit 19.67 before pulling back to a low of 19.41. Price remains somewhat compressed, drifting sideways just below the 200-day moving average, which is acting as resistance. The 50-day moving average has recently turned slightly upward and is attempting to curl back toward the longer-term average, a subtle sign of stabilization.
This stretch of price action appears to be forming a base just under the 20 level. Over the past few weeks, the stock has struggled to break out cleanly above the 200-day average, a technical ceiling that has kept buyers in check. Each attempt has been met with sellers, especially near the 20.25 mark. Still, the lack of strong rejection hints at possible accumulation.
Moving Averages Interaction
The 50-day moving average (orange line) recently crossed below the 200-day moving average (blue line), a death cross formation, though it occurred after the stock had already been declining. That cross, typically a lagging signal, is now being tested by sideways price movement that’s hugging both averages. The two moving averages are converging, indicating a potential inflection point. If price can sustain a push above both lines on volume, it could suggest a shift in momentum.
However, for now, the trend remains neutral to slightly bearish, given how price is still trapped below the 200-day.
Volume Profile and Participation
Volume has remained relatively tame except for a few noticeable spikes. A significant volume surge in early October accompanied a sharp upward price move, but that momentum wasn’t sustained. More recently, volume picked up again in March, suggesting fresh interest, though not yet strong conviction. Most of the recent candles are accompanied by average or below-average volume, indicating lack of strong buying pressure.
There’s been a slight increase in green volume bars relative to red ones over the last few weeks, which may point to quiet accumulation, but it’s not conclusive without a breakout.
RSI Behavior
The RSI line shows a steady move from oversold conditions in late December to more neutral levels throughout March. Currently, it’s hovering in the 40 to 50 range, which suggests the stock isn’t overbought or oversold. This neutral RSI position aligns with the consolidation pattern we’re seeing in price. It’s neither confirming bullish strength nor flashing any warning signs.
When RSI previously hit overbought territory in late January, the stock failed to follow through and pulled back, a sign that bulls weren’t strong enough to capitalize. That moment appears to have capped short-term momentum.
Recent Candlestick Activity
Looking at the most recent five candles, there’s been a noticeable tightness in range with small bodies and wicks on both ends. That kind of indecision often signals a balance between buyers and sellers. The upper wicks on the last few candles suggest mild selling pressure at the highs, while the lower wicks show buyers stepping in at dips near the 19.20 range.
This back-and-forth movement is typical of a market in consolidation. No strong directional move yet, but signs are starting to build that pressure is being stored for a breakout or breakdown. Volume hasn’t confirmed a direction, so the market is waiting for a catalyst.
Bigger Picture and Market Cycle Context
Zooming out, the chart reflects a clear markdown from late October through December, with a low carved out around 17.30. Since then, price has steadily recovered but remains capped below key resistance. The current structure looks like it could be part of a late-stage accumulation phase in Wyckoff terms, where the stock is still being tested for strength before markup can begin.
This phase is often marked by false breakouts, sideways movement, and growing volume on up-days. While we’ve seen some of those elements start to appear, they haven’t coalesced into a convincing signal yet. The 50-day moving average catching up to price could be an early sign that supply is being absorbed and buyers are slowly regaining control.
Analyst Ratings
Recent Downgrades and Price Target Adjustments
📉 On March 26, 2025, SpartanNash received a downgrade from a previous “buy” rating to a more cautious “hold.” The shift likely stems from the company’s recent struggles with profit margins and muted earnings growth. With net income coming in nearly flat over the past year, analysts appear to be signaling a wait-and-see approach before turning more bullish again.
📉 Back in mid-February, the sentiment started to shift when Northcoast Research lowered its rating from “buy” to “neutral.” They also slapped a much more conservative price target of $10.00 on the stock. That marked a clear shift in tone, possibly tied to concerns around the company’s rising debt levels and tighter consumer spending impacting grocery sales.
These recent moves suggest analysts are growing cautious about short-term upside, especially as SpartanNash continues to operate in a low-margin environment with limited pricing power.
Analyst Consensus and Price Targets
📊 The general consensus among analysts tracking SpartanNash now stands at a “hold.” There’s no strong bullish or bearish tilt, just a signal to let things play out a bit longer.
🎯 The average price target sits at $20.33, implying a small potential upside from the current share price around $19.91. Price targets are fairly tight, ranging from a low of $20.00 to a high of $21.00, showing that most analysts expect the stock to hover near current levels barring any major surprises.
These ratings reflect a stock that’s fundamentally stable but not flashing any clear momentum in either direction. The market seems to be in a holding pattern, watching to see if the company can boost earnings and push through some of the operational headwinds it’s facing.
Earning Report Summary
SpartanNash wrapped up its fiscal year with a report that was pretty reflective of the kind of year it had—steady in some areas, a bit soft in others, and sprinkled with a few positive surprises.
Fourth Quarter Snapshot
In the fourth quarter, SpartanNash pulled in $2.25 billion in net sales. That’s a small bump—just under 1% growth—but growth nonetheless. Most of that came from its wholesale side, where demand picked up and new customer relationships added a bit of lift. On the retail side, things were a bit more muted. Foot traffic and competition in the grocery space are always tough, and the company felt some of that pressure.
What stood out though was earnings per share landing at $0.32 for the quarter, which was better than expected. That came down to some behind-the-scenes work—tight cost control, smoother operations, and some efficiencies that helped pad margins just enough.
Full-Year Recap
Across the full year, SpartanNash brought in $9.55 billion in total revenue, which was actually down slightly from the year before. That dip had more to do with the company exiting certain retail locations and focusing more on areas with stronger returns. Even with that, they managed to keep gross margins fairly steady, which says a lot about how they’re managing pricing and supply chain challenges.
Earnings per share for the year came in at $1.50, a bit lower than the previous year’s $1.75. Not ideal, but not unexpected either. A good chunk of the difference came from heavier investments in tech, infrastructure, and labor—things that cost more now but are meant to strengthen the business over the long run.
A Few Bright Spots
SpartanNash has been quietly improving its operations. New systems in their warehouses are making order fulfillment faster and more accurate. Their private-label line, especially under the Our Family brand, continues to grow, giving them better margins and stronger brand loyalty.
They’ve also kept a steady hand on expenses, which helped absorb some of the extra costs tied to labor and inflation.
What’s Next
Management didn’t make any dramatic projections, but there’s a sense of quiet confidence going into the new year. The focus is on fine-tuning operations, expanding the wholesale business, and leaning into customer data to make smarter decisions.
It’s not a fireworks kind of story—but for a business like SpartanNash, stable and consistent might be just what investors are looking for.
Financial Health and Stability
This is where SpartanNash shows both strengths and areas of concern. On the positive side, the company has a solid current ratio of 1.57, which indicates it can handle its short-term obligations. Operating cash flow over the last year came in at $205.9 million, a healthy number that supports dividend payments and basic operations.
But there’s no ignoring the debt situation. With $1.11 billion in total debt and a debt-to-equity ratio of 149%, the company is operating with a heavy financial burden. That makes the business more sensitive to rate hikes and leaves less room for error.
Profitability is another soft spot. Return on assets is 3.31%, and return on equity is close to zero. That suggests the company is struggling to create real value for shareholders—at least at the moment.
However, it’s important to remember that the grocery business is notoriously low margin. SpartanNash’s structure, which includes its own retail stores and distribution network, helps spread some of the risks and maintain steady revenue even in tougher economic climates.
Valuation and Stock Performance
SpartanNash shares are trading at just under $20, and at that level, the stock looks inexpensive. The forward P/E is 9.74, which is low in both relative and absolute terms. The price-to-sales ratio is only 0.07, and price-to-book is sitting around 0.90. That tells you the market is valuing the company at less than its net assets—usually a sign of skepticism or undervaluation.
Over the past year, the stock has been range-bound, bouncing between $17.30 and $23.00. The 50-day and 200-day moving averages suggest it’s hovering right around its typical trading range.
For dividend investors, this lack of price movement might not be a problem. If the stock price stays steady and the dividend keeps coming in, you’re getting paid to wait. And with a yield over 4%, that patience could be worthwhile.
Risks and Considerations
There are a few important risks to be aware of.
First, the company’s high debt load can become a bigger issue if interest rates stay elevated or if cash flow weakens. Servicing that debt could start to crowd out other priorities.
Second, profitability is currently very thin. With net income basically flat, any disruption in sales or cost pressures could make things tighter.
Third, the dividend coverage isn’t strong if you only look at net income. It’s really free cash flow doing the heavy lifting here, so investors will want to keep a close eye on those numbers going forward.
Finally, the competitive nature of the grocery sector can’t be ignored. SpartanNash faces pressure from big players like Walmart and Kroger, who have the scale to drive down prices and squeeze margins.
That said, one area where SpartanNash stands apart is its contract work with military commissaries. That brings in consistent revenue and acts as a built-in stabilizer, especially during more volatile retail cycles.
Final Thoughts
SpartanNash is the kind of stock that doesn’t need to be exciting to be effective. It offers a solid yield, steady cash flow, and a business model tied to essential services. The company has challenges—profitability is tight, and debt is high—but it also has strengths that support a reliable dividend strategy.
At current valuations, the stock offers a compelling yield with potential for upside if management can improve margins or chip away at its debt load. For dividend-focused investors, it may be worth considering as part of a broader income strategy, especially if you value consistent cash returns over stock price fireworks.
This is a name that may not dominate headlines, but sometimes, that’s exactly the kind of steady operator income investors want in their portfolios.