

Updated 3/26
S&P Global isn’t usually the first name that comes up when people talk about dividend stocks. It’s not flashy, and the yield won’t make income chasers jump with excitement. But there’s a quiet strength to this company that long-term investors, especially those focused on dividend growth, tend to appreciate. This is a business that’s deeply woven into the financial system, offering credit ratings, indices, benchmarks, and a whole suite of analytical tools that financial institutions rely on every single day.
What you get with S&P Global is not just consistency, but a business model that compounds quietly over time. For dividend investors looking beyond the usual suspects, it’s worth taking a closer look at what SPGI brings to the table.
Recent Events
The latest quarter showed S&P Global is still firing on all cylinders. Revenue was up 14% year-over-year, and net income growth came in at an eye-catching 52%. These aren’t numbers you typically see from a company that’s been around for this long and already has a dominant market position.
SPGI’s stock has been reflecting this performance, with a solid 19% rise over the past 12 months. Compare that to the S&P 500’s gain of just under 9%, and you start to see why this stock continues to attract institutional interest. It’s not just the growth—it’s the kind of dependable, well-run business that investors can count on through different cycles.
Key Dividend Metrics
📈 Forward Dividend Yield: 0.76%
💰 Annual Dividend: $3.84 per share
📅 Last Dividend Paid: March 12, 2025
📆 Ex-Dividend Date: February 26, 2025
🔁 Payout Ratio: 29.47%
📊 5-Year Average Yield: 0.82%
🚀 Dividend Growth: Consistent increases over time
🛡 Dividend Safety: Supported by strong free cash flow and prudent financials
Dividend Overview
At first glance, a yield under 1% might not turn heads. But the value in S&P Global’s dividend isn’t in the size of the checks—it’s in how reliably they show up and grow. The current dividend stands at $3.84 per share annually, which is up from $3.64 the year before. That’s a pattern the company has maintained for years, with regular increases that keep pace with earnings growth.
Unlike companies that stretch to pay a dividend, SPGI’s payout ratio of just under 30% means there’s plenty of room to reinvest in the business, make acquisitions, or weather economic downturns without putting the dividend at risk.
Dividend Growth and Safety
Dividend growth investors often look for two things: a long track record of increases and the financial muscle to keep those hikes coming. SPGI checks both boxes. Its dividend growth has been consistent, typically rising in the high single-digit range annually. And it’s doing this without compromising financial flexibility.
Cash flow is the backbone of any sustainable dividend strategy. In the trailing twelve months, SPGI generated $5.69 billion in operating cash flow and $5.09 billion in free cash flow. That more than covers its dividend obligations. The company’s ability to grow its payout while keeping a low payout ratio is a strong signal of future potential.
Chart Analysis
Current Phase in the Market Cycle
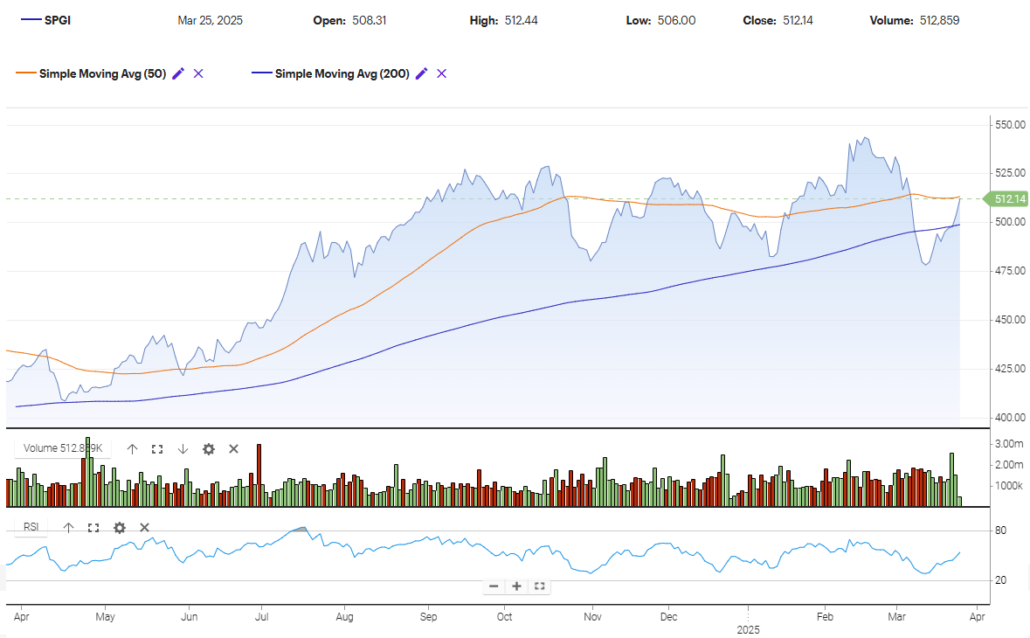
The chart for S&P Global (SPGI) shows clear signs of transitioning behavior that fits within Wyckoff’s market cycle framework. Following a strong markup phase that began in mid-2024, the price topped out around December and has since displayed characteristics typical of a distribution phase. What stands out is the repeated failure to break significantly above the $540 area despite multiple tests, signaling weakening demand.
From early January through March, the price moved sideways in a range with sharp up and down swings, indicating potential distribution. Supply appears to be overcoming demand gradually, particularly in the early March breakdown below both the 50-day and 200-day moving averages. That breakdown briefly shifted the momentum into markdown territory before the recent recovery.
Now, with the price climbing back toward the 50-day average and sitting slightly above the 200-day, the stock looks like it’s testing a re-entry into its previous range. This is a pivotal spot—either the uptrend resumes or the stock rolls over into deeper markdown.
Moving Averages
The 50-day simple moving average recently crossed below the 200-day moving average, a bearish signal often referred to as a “death cross.” While the crossover hasn’t been aggressive, it reflects the weakening momentum that’s been building for the past few months. The price is now hovering just above the 200-day average and nudging into the 50-day, which could act as a near-term ceiling if buyers don’t follow through with volume.
Volume Behavior
Volume tells an important story here. During the earlier run-up, volume supported price gains with steady accumulation. But over the past three months, volume spikes have become more associated with down days than up days—especially noticeable during the sharp drop in early March. That’s a sign of distribution: large holders using strength to exit positions.
The recent bounce has come on relatively average volume, which makes the move feel tentative. If this were the beginning of a true markup phase, you’d expect to see conviction—higher volume accompanying the push through resistance. So far, that’s not happening.
Relative Strength Index (RSI)
Looking at the RSI, there’s been a clear drop from overbought territory last fall into a lower range that’s been stuck in the middle of the band for most of 2025. After dipping toward oversold levels in early March, the RSI has started to climb again, but it’s still below any level that would signal strong bullish momentum. The market appears to be in a wait-and-see mode here.
Candle Behavior and Pressure Signals
Zooming into the latest five daily candles offers a snapshot of the ongoing tug-of-war. Each of the recent sessions has shown upper wicks, suggesting sellers are stepping in on strength. The most recent candle, closing at 512.14 after touching a high of 512.44, shows a narrow range and another upper wick—again hinting at fading momentum intraday.
This kind of action suggests that while the bulls are trying to reclaim control, there’s resistance every step of the way. Buying pressure exists, but it’s hesitant. No candle in the last five days has had a strong bullish body closing at or near its highs, which keeps things neutral to slightly cautious for now.
Analyst Ratings
📊 S&P Global Inc. (SPGI) has been drawing renewed attention from analysts, with several adjustments to ratings and price targets over the past few weeks. The tone is largely constructive, with most analysts maintaining a positive stance on the company’s long-term fundamentals.
🎯 The current consensus 12-month price target sits around $608.33, which implies roughly 19.8% upside from the recent share price of $507.80. Targets vary, but the range is tight enough to show alignment—low end at $565.00 and high end reaching $650.00.
🟢 On March 12, 2025, Mizuho kicked off their coverage of SPGI with a Buy rating and set a target of $599. That was followed by UBS on February 18, 2025, which held its Buy rating but nudged the price target higher from $610.00 to $640.00. A few days earlier, BMO Capital Markets reaffirmed its Outperform rating and raised its target from $576.00 to $590.00.
💼 These bullish revisions come on the back of strong operating performance. The company’s recent quarterly report showed a 20% jump in earnings per share and 14% growth in top-line revenue. That kind of growth, especially from a company as mature and stable as S&P Global, tends to get noticed.
📈 Analysts have also pointed to the company’s resilience in economic cycles, robust free cash flow, and the continued demand for financial analytics and credit ratings as driving forces behind their optimism. With consistent execution and a business model built around recurring revenue, the broader Street sentiment remains favorable.
Earnings Report Summary
A Strong Finish to 2024
S&P Global closed out 2024 with a solid performance that showed strength across the board. Fourth-quarter revenue came in at $3.59 billion, up 14% from the same time last year. That momentum held steady throughout the year, with total revenue reaching $14.2 billion—again, a 14% jump compared to 2023.
But what really stood out was profitability. Net income for the fourth quarter climbed to $880 million, which was a 52% increase year-over-year. Earnings per share followed suit, coming in at $2.85 for the quarter—a 56% improvement. For the full year, earnings per share landed at $12.35, up 50%, while net income rose to nearly $3.85 billion.
What’s Driving the Growth
One of the big reasons behind this strong showing was a recovery in the Ratings division. With debt issuance picking back up, this part of the business saw meaningful growth in both revenue and profit. That rebound helped lift the entire company, proving once again how vital credit ratings remain in the financial world.
Other segments chipped in too. The Market Intelligence business continued to benefit from steady demand for data and analytics. Meanwhile, both the Commodity Insights and Mobility units also turned in solid performances, showing that S&P Global’s push to diversify is paying off.
More Efficient, More Focused
Efficiency played a big role this year. The company managed to expand its adjusted operating margin by 260 basis points, which basically means it did a better job of turning revenue into profit. That’s a good sign that the company isn’t just growing—it’s doing it in a smart, disciplined way.
For dividend investors, there was more good news. In January, S&P Global announced a 5.5% increase to its quarterly dividend. That marks the 51st year in a row the company has raised its payout, keeping alive one of the more dependable dividend streaks out there.
Looking Ahead
The company seems upbeat heading into 2025. Management is guiding for continued revenue growth and seems confident that demand for its services will stay strong. With a business model that holds up well across market cycles, S&P Global is walking into the new year with momentum and a clear strategy.
Financial Health and Stability
S&P Global isn’t just growing—it’s doing so from a position of real strength. Total debt sits at $12 billion, which might seem like a lot until you see the bigger picture. The company’s debt-to-equity ratio is a manageable 32.1%, and with nearly $1.7 billion in cash on hand, it has options.
Operating margins are close to 39%, which is exceptional in any industry, let alone financial services. Return on equity is just above 11%, which speaks to the efficiency of the business. When you look at the combination of high margins, strong returns, and solid cash flow, it paints the picture of a business that’s built to last.
Valuation and Stock Performance
SPGI isn’t cheap by traditional measures. The forward price-to-earnings ratio is around 29.5, and the price-to-book is hovering near 4.7. But you’re not paying for a turnaround or a risky growth story—you’re paying for quality. Companies with this kind of recurring revenue, strong customer lock-in, and stable cash flow rarely come at bargain prices.
In terms of performance, the stock has quietly outperformed the broader market over the past year. With a current price just below the 50-day moving average and comfortably above the 200-day, it’s still in bullish territory, despite some recent pullback.
Institutional ownership remains high at over 90%, and short interest is low, both signs of confidence from the big money.
Risks and Considerations
No company is without its risks, and SPGI has a few worth mentioning. First, its business can be sensitive to economic cycles. If debt issuance slows during a downturn, that could impact revenue from its credit ratings segment.
There’s also the regulatory landscape. As a major player in credit ratings, SPGI occasionally finds itself under scrutiny—especially when markets get rocky. And while acquisitions like the IHS Markit merger have worked well, larger M&A moves always carry integration risk.
Lastly, valuation remains a concern. When stocks trade at a premium, any disappointment in earnings or guidance can lead to swift pullbacks. It’s a name that tends to reward patience, but short-term dips aren’t out of the question.
Final Thoughts
S&P Global may not be a typical income stock, but it’s exactly the kind of company that fits well in a dividend growth portfolio. It won’t deliver big upfront yield, but what it does offer is consistent, sustainable, and backed by strong financials.
There’s something comforting about a business that just keeps performing, quarter after quarter, year after year. SPGI doesn’t chase attention—it earns trust. For dividend investors who appreciate quality and long-term compounding over flash and short-term gains, it’s the kind of stock that quietly gets the job done.