

Updated 3/26
Southern Missouri Bancorp, Inc., trading under the ticker SMBC, is a regional banking name that’s steadily built a reputation for solid fundamentals and steady income. Headquartered in Poplar Bluff, Missouri, the bank has been quietly expanding throughout Missouri, Arkansas, and Illinois through its Southern Bank subsidiary. It provides traditional banking services—think deposits, loans, and mortgages—mainly to individuals, families, and small businesses.
While it may not grab headlines like the big national players, SMBC has something dividend-focused investors often appreciate: a disciplined, well-run operation with consistent returns and a conservative dividend strategy.
Recent Events
The last year has been kind to SMBC shareholders. The stock has risen close to 22% over the past 12 months, well outpacing the broader market. Much of that upward momentum is being driven by solid performance on the ground.
In its most recent quarterly results through December 2024, the company reported a 20% year-over-year jump in net income and a 12% bump in revenue. That’s not an easy feat for a regional bank in today’s interest rate environment. It shows the company is expanding in a healthy way—bringing in more business without overextending.
Key Dividend Metrics
📈 Forward Yield: 1.73%
💵 Annual Dividend: $0.92 per share
📊 Payout Ratio: 19.21%
📅 Most Recent Dividend Payment: February 28, 2025
🚪 Ex-Dividend Date: February 14, 2025
📆 Five-Year Average Yield: 1.80%
📉 Trailing Yield: 1.65%
🧮 Dividend Growth: Steady, gradual increases
Dividend Overview
At first glance, SMBC’s dividend yield might not stop you in your tracks. A 1.73% forward yield isn’t going to rival the high-yield energy or utility names out there. But that’s not the point here.
The company pays out just under a fifth of its earnings to shareholders. That low payout ratio is a strong signal. It tells us management isn’t stretching to keep shareholders happy. Instead, they’re sticking with what they know: slow and steady growth that lines up with performance.
The result? A dividend that doesn’t just look safe—it is safe. And that’s something investors can plan around.
Dividend Growth and Safety
SMBC’s dividend record reflects a conservative, long-term mindset. Increases have come regularly, albeit modestly. But that’s not a bad thing when those raises are backed by real earnings growth, which SMBC continues to deliver.
With earnings per share sitting at $4.58 and the annual dividend at $0.92, the math is reassuring. There’s plenty of room here for the dividend to grow, even if earnings flatten out a bit. Return on equity is above 10%, showing this is a company that uses its capital efficiently—another quiet green flag for long-term dividend health.
Chart Analysis
Overall Market Cycle Position
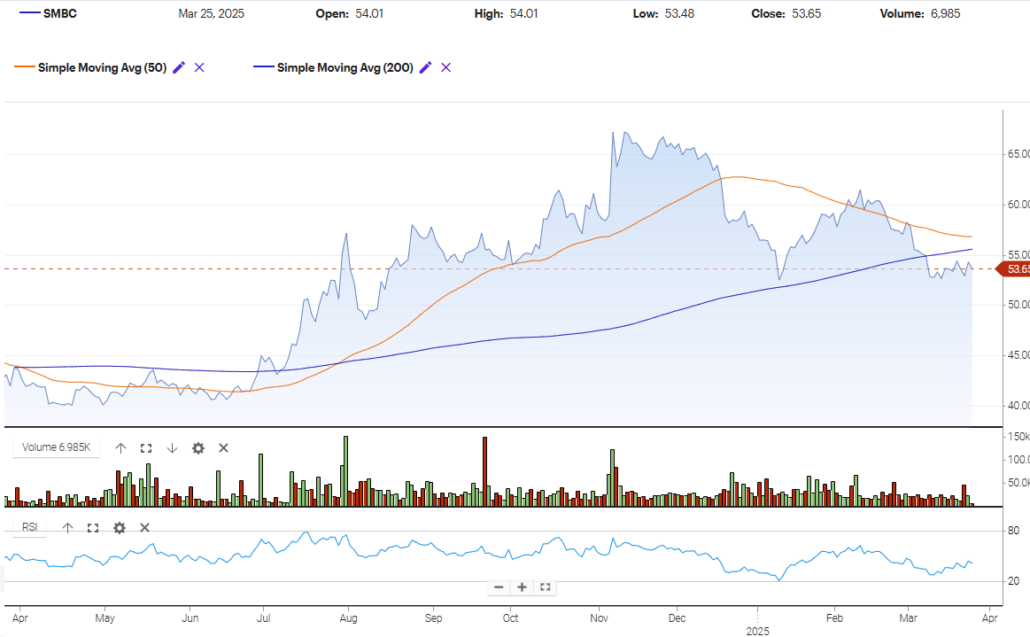
The chart of Southern Missouri Bancorp (SMBC) is showing signs that it’s in the markdown phase of the broader Wyckoff cycle. After a sharp and extended markup phase through mid-2024 into early fall, the price peaked around the $68 level before rolling over. What followed was a steady series of lower highs and lower lows, a typical structure of distribution transitioning into markdown.
The breakdown below the 50-day moving average (orange line) in early January was a key signal. From there, the stock failed to reclaim that level, and it has since been trading under both the 50-day and 200-day moving averages, which is often a sign that sellers are in control.
More recently, the price has found some footing around $53, but the lack of strong volume and continued resistance around the 200-day average suggest that this may be a pause, not yet a reversal.
Moving Averages Behavior
The 50-day moving average has clearly rolled over and is now trending lower. It crossed below the 200-day moving average in early March, forming a bearish crossover, sometimes referred to as a death cross. This adds to the evidence that the uptrend is broken and that the current phase is more about digestion or continued distribution than renewed accumulation.
The 200-day moving average is flattening out, but it’s still above the price, serving as resistance. The longer the stock trades below these moving averages, the more difficult it becomes for buyers to regain control without a strong catalyst.
Volume Analysis
Volume has tapered off significantly compared to the periods during last summer’s strong markup. Back then, green volume bars dominated and surges in price were often backed by strong activity. Now, volume looks lighter and more mixed. Red bars have crept in more frequently, which suggests more frequent selling pressure or distribution. There was a clear drop in volume during the March bounce, reinforcing the view that this move might lack conviction.
A few notable volume spikes in the last few months were red days—indicating down moves on heavier volume—which is typically not a bullish sign.
RSI Momentum Shift
Looking at the RSI, there’s been a gradual slide since November. It spent some time in oversold territory around February and early March, touching the 30 level and slightly below. That told us the stock had gotten stretched to the downside. More recently, the RSI has bounced slightly but remains under 50, signaling that there’s no momentum shift just yet.
What we’re seeing now is a possible attempt to base, but without a lift in volume or RSI pushing above mid-levels, it’s too early to say momentum has returned. The RSI trend still leans bearish, albeit less aggressively than earlier in the year.
Latest 5 Candles and Price Action
Zooming into the last five daily candles, price has been holding a narrow range just below the 200-day average. Wicks on both the top and bottom of these candles show some indecision. Buyers are stepping in near the lows, but sellers are capping any real upside.
The candles are relatively small, and the lack of wide ranges or strong body closes suggests a market in wait-and-see mode. This kind of tight, low-volume consolidation can precede a bigger move, but right now it reflects a market with neither strong accumulation nor panic selling.
This current range between $53 and $54 is shaping up as a short-term battleground.
Analyst Ratings
📈 Southern Missouri Bancorp (SMBC) has recently seen updates in analyst sentiment. As of late January 2025, the consensus 12-month price target sits at $69.00, pointing to meaningful upside potential from current levels.
🔽 On January 30, 2025, Keefe, Bruyette & Woods lowered their price target from $70.00 to $68.00 while maintaining a “Market Perform” rating. The revision came in response to moderating loan growth and slightly compressed net interest margins, both of which are common concerns across regional banks in this rate environment. Despite the downgrade in target, the firm still sees SMBC as a steady performer within the sector.
📈 In contrast, Stephens & Co. reiterated their “Overweight” rating on January 28, 2025, while nudging their price target higher from $70.00 to $72.00. Their call reflects confidence in SMBC’s fundamentals, particularly the strong return on equity and robust asset quality metrics. They highlighted the bank’s consistent profitability and efficient cost controls as drivers behind the raised forecast.
💬 These two perspectives underline a split tone in analyst expectations—one cautious due to macro headwinds, the other optimistic based on company-specific execution. The current average target across analysts suggests that while some expect more moderate growth, others still see room for continued appreciation.
Earning Report Summary
Strong Quarter for Earnings and Revenue
Southern Missouri Bancorp had a solid showing in its most recent quarter, ending December 31, 2024. Net income came in at $14.7 million, a healthy jump of 17.6% from the prior quarter. On a per-share basis, that worked out to $1.19 in earnings, which came in above what most had expected.
On the top line, revenue hit $42.86 million, just edging past estimates. It wasn’t a blowout beat, but it shows the bank is keeping momentum. What really stood out was the profit margin—holding steady at 30.5%, which tells us they’re managing costs efficiently while still growing.
Full-Year Growth and Consistency
Zooming out a bit, SMBC posted $49.5 million in earnings over the past twelve months, reflecting a 7.1% increase year over year. That kind of steady growth doesn’t always grab headlines, but it’s the kind of consistency that long-term investors like to see—especially in the regional banking space where volatility can sneak in.
The company’s return on equity landed at 10.2%, which is right in line with healthy industry averages. It’s a solid sign that the bank continues to put its capital to work in a smart, measured way.
Looking Ahead
The next earnings release is scheduled sometime between April 29 and May 3, 2025. Investors will be watching closely to see if the current pace of growth continues, especially with economic headwinds that could start to weigh on loan demand or margins.
As for sentiment, the analyst crowd seems cautiously optimistic. The average 12-month price target is hovering around $69.33, suggesting room for the stock to climb if the company keeps delivering results like this.
Overall, SMBC appears to be on stable footing. The latest numbers suggest a business that’s balancing growth with discipline—something that doesn’t always show up in the headlines but matters a lot when you’re looking at long-term value.
Financial Health and Stability
Looking under the hood, the balance sheet gives more reason to feel comfortable. SMBC holds roughly $146 million in cash, working out to nearly $13 per share. Total debt stands at $152 million—not a small figure, but manageable given the company’s cash flow strength.
In fact, operating cash flow for the trailing twelve months is over $69 million. Compare that with the total annual dividend cost (just under $10 million), and it’s clear there’s plenty of breathing room here. There’s no need to dip into reserves or borrow just to keep the dividend going.
This is the kind of financial position that keeps dividend investors sleeping well at night.
Valuation and Stock Performance
SMBC trades at around 11.6 times trailing earnings. That’s just slightly below where many regional banks tend to sit. It suggests a fair valuation—not a bargain basement, but certainly not expensive, especially given the earnings growth and dividend support.
Price-to-book comes in at 1.17, again pointing to a reasonable valuation for a bank that’s delivering solid return on equity. Investors aren’t paying a steep premium, which makes sense given the bank’s measured, consistent approach to growth.
The stock has recently pulled back a bit from its 50- and 200-day moving averages, which could mean short-term softness. But the longer trend remains upward, supported by steady earnings and improving fundamentals.
Risks and Considerations
While the story so far has been encouraging, there are a few things investors should be aware of. SMBC is still a relatively small player with a market cap just north of $600 million. That size means it’s more exposed to economic swings in its core regions, especially in local housing or small business sectors.
There’s also the matter of liquidity. With an average volume of about 31,000 shares a day, this is not the most actively traded stock. That’s not necessarily a problem, but it’s worth remembering if you’re building a larger position.
As for the dividend itself, the yield isn’t going to provide immediate high income. It’s best thought of as a growing stream—one that rewards patience rather than providing instant cash flow.
Final Thoughts
Southern Missouri Bancorp is one of those names that flies under the radar, but offers a lot of what dividend investors tend to look for: dependable cash flow, conservative management, and steady, well-supported payouts.
This isn’t a stock that’s trying to wow the market every quarter. It’s a quietly reliable business that grows in line with its strengths. For investors focused on income that’s built on a stable foundation—with room to grow—SMBC could be a name to keep on the radar.
It may not be the flashiest stock in the portfolio, but it just might be one of the more dependable ones.