

Updated 3/26
Simmons First National Corporation, or SFNC has been quietly building value for decades. Headquartered in Arkansas, this regional bank has been around for more than a century, growing its footprint steadily across several Southern and Midwestern states. It’s not trying to be flashy, and that’s exactly why income-focused investors might find it appealing. With a solid dividend and a conservative approach to business, Simmons First might not lead the headlines, but it deserves a spot on the radar for anyone building a dependable portfolio.
Recent Events
Simmons has been holding steady in the market, with its stock trading in the low $20s. As of late March, it closed at $20.75, notching a modest gain over the past year. That may not sound like much in today’s hyperactive market, but for a regional bank that emphasizes stability, it’s right in character.
The company has posted some encouraging financial results recently. Revenue jumped more than 16% year-over-year, and net income came in at over $152 million. Even more eye-catching was the 102% increase in quarterly earnings from the prior year, a sign that Simmons is making the most of its lending activities and interest income.
And true to form, Simmons is sticking to its schedule with another dividend payment set for April 1, continuing a long streak of reliable distributions to shareholders.
Key Dividend Metrics
💰 Forward Yield: 4.10%
📈 5-Year Average Yield: 3.53%
📆 Payment Frequency: Quarterly
📊 Payout Ratio: 69.42%
💵 Annual Dividend: $0.85
🗓️ Next Payout: April 1, 2025
🔁 Most Recent Split: 2-for-1 in February 2018
Dividend Overview
At just over 4%, the yield on Simmons stock stands out in a market where dependable income is getting harder to find. It’s comfortably higher than the average for most regional banks and offers a real cushion for investors looking to generate cash flow from their portfolio.
What’s especially reassuring is the track record. Simmons has paid out a dividend consistently for years, and that level of reliability is no accident. The current annual payout of $0.85 per share is supported by healthy earnings and a manageable payout ratio just under 70%. While that payout level may be a little higher than some peers, it’s not a red flag—it simply shows that the bank is prioritizing shareholder returns while still keeping some room for reinvestment.
Dividend Growth and Safety
Over the years, Simmons has quietly built a respectable dividend growth story. The increases aren’t aggressive, but they’re steady—something investors can count on. It’s a pattern that reflects the company’s overall philosophy: conservative, thoughtful, and focused on sustainability.
With earnings per share at $1.21 and solid operating cash flow of nearly $426 million, the dividend looks well-covered. The payout ratio being below 70% gives some flexibility, especially if the company continues to grow its earnings.
What adds an extra layer of confidence is the fact that Simmons tends to operate within its means. It doesn’t stretch to make dividend payments, and it hasn’t needed to cut or pause distributions, even in more turbulent periods. That says a lot about management’s commitment to maintaining shareholder value without taking on unnecessary risk.
Chart Analysis
Market Phase and Wyckoff Interpretation
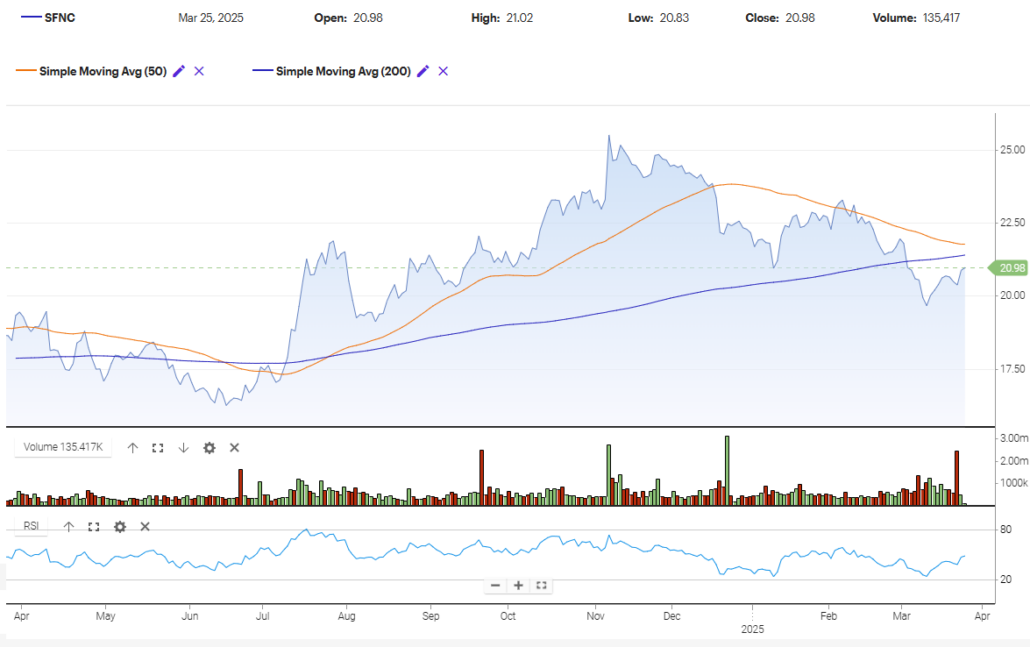
Looking at the one-year chart for SFNC, the overall pattern aligns with a classic Wyckoff cycle. The stock appears to have completed a markup phase between June and December, where it saw a notable upward move accompanied by expanding volume and a decisive break above the 50-day and 200-day moving averages. That bullish stretch peaked just below $26 in late December.
Since then, the price has moved into what looks like a distribution phase, where the upward momentum began to stall and price action became more choppy. The lower highs and failure to maintain support at the 50-day moving average signaled fading demand. The distribution zone lasted through January and February, gradually transitioning into a markdown phase that took shape in March.
The stock then dipped below the 200-day moving average and formed a recent low near $20 before rebounding back above the long-term trendline. That bounce may be hinting at an early accumulation stage if support continues to hold.
Moving Averages and Trend Signals
The 50-day simple moving average has now clearly rolled over and is trending downward, which reflects short- to medium-term weakness. The price struggled to stay above that line throughout February and March, showing that sellers have been in control.
The 200-day moving average is still rising slowly, indicating that the longer-term trend hasn’t fully reversed yet. Currently, the price is trying to regain ground above this key level. Whether that holds will be a key signal for determining if the markdown phase is ending.
The recent crossover of the price back above the 200-day line is worth watching. It suggests some strength returning, but that strength hasn’t been confirmed by the 50-day line yet. Until there’s a decisive move above both averages with rising volume, this is still a tentative zone.
Volume Patterns
Volume behavior adds another layer of insight. There was heavy buying interest in late October and again in mid-January, both moments when the stock was attempting to reclaim prior highs. However, volume during the recent pullback was modest—suggesting that the selling wasn’t driven by panic, but rather a slow handoff between buyers and sellers.
The volume spike on the recent bounce from the $20 level is especially notable. That may be a sign of institutional interest stepping in at that price zone. Still, volume hasn’t consistently followed through on up days, so conviction on the buy-side remains somewhat cautious.
RSI Momentum
The relative strength index (RSI) dropped below 30 during the March lows, indicating that the stock was oversold at that point. That coincided with a short-term bottom around $20. Since then, RSI has turned upward, but it’s still well below overbought levels.
Currently hovering in the 40–50 range, RSI is showing modest momentum. It’s not confirming a strong reversal just yet, but the improvement suggests that downward pressure is weakening.
Latest Five Candles and Price Action
Looking at the most recent five candles, the story is one of tentative recovery. The range has been relatively tight, showing that buyers and sellers are trying to find equilibrium after the recent drop.
Three out of the five candles have long lower wicks, which suggests that buyers have been stepping in to defend the lows during the day. That shows underlying demand at the current level, even if confidence isn’t overwhelming yet. One candle, in particular, has a pronounced lower wick and small body—classic indecision, but with a bullish tilt.
The other two candles show smaller real bodies with narrow trading ranges, often a sign of consolidation or base-building. That’s consistent with early accumulation or a pause before the next move.
No conclusive breakout has occurred yet, but the presence of buying wicks and the reclaiming of the 200-day average could be early signs of shifting sentiment.
Analyst Ratings
📈 Simmons First National Corporation (SFNC) was recently upgraded to a Zacks Rank #2 (Buy), signaling growing optimism around its near-term earnings outlook. This shift was largely driven by upward revisions in earnings estimates, suggesting that the company’s fundamentals are showing signs of improvement.
🟡 On the flip side, some analysts have maintained more neutral stances. Keefe, Bruyette & Woods revised their price target for SFNC to $20 from $21 while keeping a Market Perform rating. This signals that while the stock has some strengths, there are still uncertainties that could limit near-term upside. Similarly, Stephens trimmed their target slightly to $21 from $22, reiterating an Equalweight rating. The tone here is cautious but not bearish—more of a wait-and-see approach.
💬 The overall consensus among analysts currently stands at Hold, with the average price target hovering around $24.00. That leaves a bit of headroom from current levels and suggests analysts see moderate upside potential in the stock. Targets span a wide range—from a conservative $20.00 up to a more bullish $28.00—highlighting the different interpretations of SFNC’s growth prospects.
🎯 This mix of upgrades, revised targets, and stable ratings paints a picture of a company that’s on solid footing but still facing a few crosscurrents. The recent bounce in earnings and revenue growth is encouraging, but some firms are looking for more consistency before shifting into a more bullish stance.
Earning Report Summary
Strong Finish to the Year
Simmons First National wrapped up 2024 on a high note, turning in a much stronger fourth quarter than many expected. Net income came in at $48.3 million, more than doubling the $23.9 million reported in the same quarter the year before. That’s a pretty significant jump, especially in a banking environment that’s still adjusting to rate changes and shifting consumer behavior. Earnings per share landed at $0.38 for the quarter, comfortably above what analysts were forecasting.
Revenue Trends Headed in the Right Direction
Total revenue for the quarter reached $208.5 million, showing solid year-over-year growth from $177.6 million. That’s an increase of nearly 17 percent. Even more impressive, revenue was up over 26 percent compared to the prior quarter, hinting at strong momentum heading into the new year. This suggests Simmons may be finding a way to thrive even with some of the broader headwinds facing regional banks.
Improving Profitability
One of the standout numbers was the net profit margin, which hit 23.5 percent for the quarter. That’s a big leap from where it was a year ago and speaks to better cost control and improved efficiency. The bank is clearly making more from every dollar it brings in, which is always a good sign for long-term investors.
Returns Still Modest but Stable
Return on assets for the quarter was 0.01, and return on equity came in at 0.04. These aren’t huge numbers, but they’re typical for a conservative regional bank that isn’t chasing risky growth. It’s more about steady returns and preserving capital than hitting home runs.
Valuation and Dividend
After the earnings report, the stock’s price-to-earnings ratio settled around 16.85. That puts it in a reasonable range, not overpriced but not in deep value territory either. Simmons also declared a quarterly dividend of $0.21 per share, keeping with its long-standing habit of returning capital to shareholders. It’s a good sign that management feels confident enough in the balance sheet and cash flow to maintain the payout.
All in all, the fourth quarter showed a healthy bounce in earnings and revenue, giving investors a reason to feel more confident about where the company is headed in 2025.
Financial Health and Stability
Looking under the hood, the company’s financials look steady. Profit margins are strong, with a 20.95% net margin and a 31.61% operating margin. While return on equity sits at 4.39% and return on assets at 0.56%, these numbers are fairly typical for regional banks that focus on community lending and steady growth rather than aggressive expansion.
Book value per share comes in at $28.08, noticeably higher than the current stock price. That gap between book value and market value could suggest the stock is undervalued—at least from a balance sheet perspective.
On the liquidity side, Simmons holds just under $791 million in cash against $1.22 billion in debt. It’s a conservative setup, and while not flashy, it gets the job done. The company’s solid capital position gives it room to weather fluctuations in the economy without compromising its core business or its dividend.
Valuation and Stock Performance
From a valuation standpoint, Simmons looks reasonable. It trades at a trailing P/E of just over 17, and the price-to-book ratio is 0.74. That means investors are essentially paying less than book value for the stock—a potential opportunity for those who believe in the underlying strength of the business.
Over the past year, the stock has moved between a low of $16.03 and a high of $25.95. With shares currently around $20.75, it’s trading in the lower half of that range. For investors who prefer to buy into stability rather than chase momentum, that could be appealing.
The stock’s beta of 0.86 indicates it’s less volatile than the overall market, which fits with the company’s overall profile. For income investors focused on minimizing wild swings in portfolio value, that’s a plus.
Risks and Considerations
Of course, no investment comes without risks. For Simmons, one of the biggest variables is interest rate pressure. Like all banks, Simmons earns a significant portion of its income from net interest margin—the spread between what it pays for deposits and what it earns on loans. If interest rates fall or flatten, that margin could compress, potentially impacting earnings and cash flow.
There’s also the challenge of operating in a competitive regional banking landscape. Larger institutions can sometimes exert pressure on margins or poach clients with more advanced digital offerings. Simmons has managed to stay competitive, but continued investment in technology and customer experience will be key.
Another point worth noting is the payout ratio. While not excessive, it’s inching toward the upper end of what many dividend investors would consider conservative. That means the company needs to keep earnings steady or growing to maintain its dividend at current levels.
And while institutional ownership is solid, insider ownership is quite low—less than 2%. That doesn’t necessarily signal a problem, but some investors prefer to see more insider alignment with shareholder interests.
Final Thoughts
Simmons First National might not be a stock that gets a lot of attention, but for the right investor, that’s actually part of the appeal. It’s a company that has weathered market cycles, continued to pay a dividend through thick and thin, and managed to do so without taking on excessive risk.
With a forward yield north of 4%, solid cash flow, and a valuation that leaves some room for upside, Simmons offers a dependable choice for those who prioritize income and stability. It’s the kind of bank that fits quietly into a portfolio and just keeps doing its job—quarter after quarter, year after year.
For investors building a long-term, income-focused strategy, that kind of quiet reliability can go a long way.