

Updated 3/26
Schneider National doesn’t usually make headlines in the dividend investing world, but maybe it should. Tucked away in the transportation sector, this Wisconsin-based logistics player has been quietly delivering reliable results for decades. Whether it’s full truckload, intermodal, or complex supply chain services, Schneider has built a reputation for keeping things moving smoothly. And while it’s not the flashiest stock out there, it has a lot going for it if you’re the kind of investor who values consistency and income over hype.
Let’s dive into what’s happening with SNDR lately and see what it really offers for dividend-focused portfolios.
Recent Events
It’s been an interesting stretch for the freight industry, and Schneider has had its share of bumps along the road. Revenue dipped slightly over the past year—down about 2.4% year-over-year in the most recent quarter—which reflects softer freight demand and some pricing pressure across the board. But what really stands out is this: despite the top-line slowdown, earnings actually improved by 19%. That shows a company that knows how to manage its costs and adapt to shifting conditions.
One more thing worth flagging—insiders own nearly 45% of the company. That’s a strong signal that the people behind the scenes are deeply invested in how this business performs, which always adds a layer of confidence for outside shareholders.
Key Dividend Metrics
📈 Dividend Yield: 1.62%
💵 Annual Dividend: $0.38 per share
🧮 Payout Ratio: 57.58%
📊 5-Year Average Yield: 1.25%
📆 Next Dividend Date: April 9, 2025
🔻 Ex-Dividend Date: March 14, 2025
Dividend Overview
Schneider isn’t chasing yield headlines, and it doesn’t need to. With a 1.62% yield, it’s more of a steady-eddy payer than a big income generator. But that’s not necessarily a bad thing. Unlike some higher-yield names that stretch to keep payouts going, Schneider plays it safe and sustainable.
The dividend has remained consistent, which says a lot in a cyclical industry like trucking. Even when freight volumes wobble or costs rise, Schneider’s commitment to returning cash to shareholders hasn’t wavered. That kind of stability might not grab attention, but it speaks volumes when you’re building a portfolio that’s meant to last.
Dividend Growth and Safety
The dividend hasn’t grown rapidly, but it has been inching upward over the years. What makes it particularly attractive is the payout ratio. Sitting just under 58%, it strikes a healthy balance—rewarding shareholders without putting pressure on the balance sheet. There’s plenty of room to keep paying even during leaner years.
From a cash flow perspective, things look even better. Last year, Schneider generated over $686 million in operating cash flow, with around $50 million in levered free cash flow. That’s more than enough to cover the dividend with some cushion to spare.
And with modest levels of debt and a current ratio around 1.6, the financial structure supports dividend safety without relying on borrowing or asset sales.
Chart Analysis
Wyckoff Stage Identification
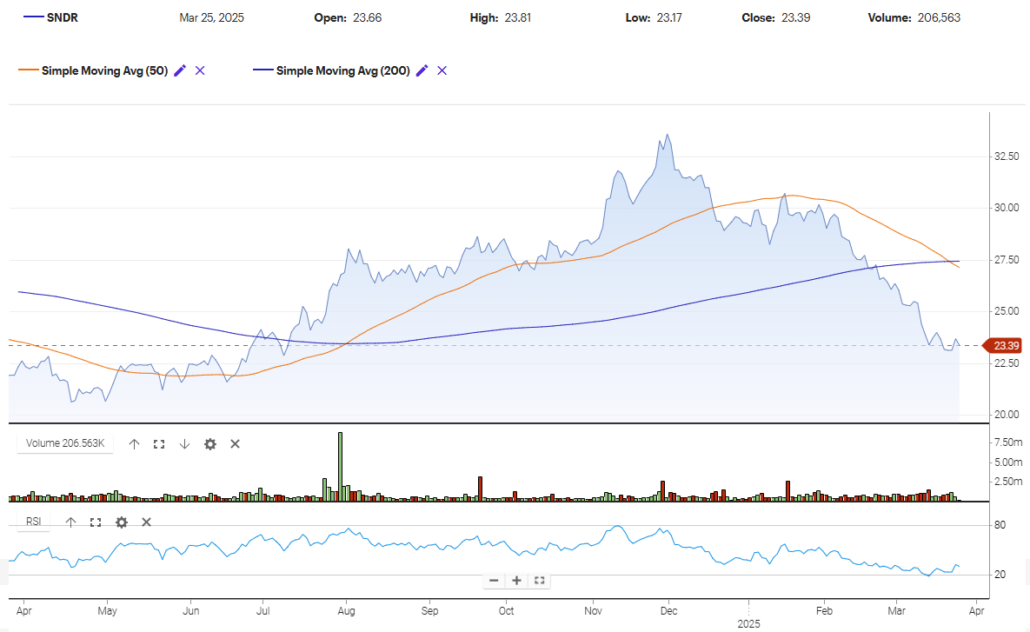
Looking at the past year of price action for SNDR, the structure of the chart aligns closely with a completed distribution phase followed by an ongoing markdown phase. The stock peaked around late November to early December, forming what resembles a buying climax, followed by a series of lower highs that signaled the start of distribution. Volume gradually increased during that rangebound topping pattern, particularly in late fall, which often indicates the presence of larger players exiting positions.
After failing to make new highs in December, the price started rolling over sharply in January and has continued trending downward. The breakdown below the 200-day moving average confirmed that the markdown phase had begun.
Price and Moving Averages
The 50-day moving average is now well below the 200-day, creating a clear bearish crossover in late February—often referred to as a death cross. Since then, price has continued to slide lower, and even recent attempts to bounce have been weak and short-lived. The 50-day is pointing down with increasing slope, and the 200-day is flattening out, which further supports the idea that this is not just a short-term pullback but a broader trend reversal from the prior uptrend.
RSI and Momentum
The RSI has been hugging the lower range of the chart for several weeks now, spending a lot of time in the oversold zone and only recently trying to tick upward. This kind of sustained weakness in momentum typically suggests that buyers are not yet stepping in with any conviction.
Even with a small uptick recently, the RSI remains far from any bullish divergence or meaningful shift in momentum. It’s currently recovering from an extremely low level, but that in itself doesn’t confirm a trend change—especially not without a volume-backed reversal.
Volume and Participation
Volume spikes are worth paying attention to here. Back in late July and again in early August, there was a noticeable surge in volume coinciding with the breakout from the accumulation phase. That was the first sign of strong institutional buying. Fast forward to the recent decline: volume has picked up at key breakdown levels, especially around the 26–25 range, where support gave way. This suggests institutional distribution—selling into weakness—rather than retail panic.
More recently, volume has dried up as the price has settled around 23. That kind of low-volume pause after a steep markdown is typical of what’s known as a secondary test or a temporary stop in supply, but without strong volume on the buy side, it’s too early to suggest accumulation is beginning.
Recent Candles and Wick Behavior
The last five candles have all been relatively narrow-bodied, with small real ranges and limited directional conviction. Most of them have small upper wicks, suggesting attempts to push higher are being met with selling pressure. The most recent candle closed near its low after trying to push above 23.80 but failing to hold gains.
This kind of price action usually implies that the sellers are still in control, even if there’s not a rush to exit right now. It’s more of a grinding down phase where optimism gets slowly squeezed out rather than a sharp panic-driven selloff. This can continue for some time before a real reversal takes shape.
Summary of Phases
- Accumulation occurred between May and July of 2024, characterized by sideways price action and low volume
- Markup phase ran from August through November 2024, breaking above both moving averages on rising volume
- Distribution unfolded from late November through January, marked by choppy trading with increasing volume
- Markdown began in February 2025 and remains active, with lower highs and lower lows under both the 50- and 200-day moving averages
Analyst Ratings
📊 Schneider National (SNDR) has been the subject of mixed analyst sentiment recently, reflecting both cautious optimism and tempered expectations. As of now, the stock trades at $23.45, and the general tone from Wall Street leans neutral to slightly bullish.
🎯 The current consensus 12-month price target sits around $30.85, implying a potential upside of roughly 31% from the recent price levels. Among analysts, the targets span a wide range—from a conservative $25.00 to a more optimistic $38.00—highlighting differing views on the company’s near-term trajectory.
📝 On February 3, 2025, an analyst from Stephens & Co. maintained an “Equal-Weight” rating and placed a $30.00 price target on the stock. This rating suggests an expectation that the stock will perform in line with its industry peers over the next year.
📈 Back in late November, BofA shifted its view from “Underperform” to “Neutral,” increasing its target to $34.00. This move was driven by stabilizing freight trends and an improving outlook for contract pricing across the industry. Schneider’s consistent operational execution in a challenging environment also helped support that upgrade.
🔽 On the more cautious side, Citigroup lowered its price target from $32.00 to $30.00 in November while sticking to a “Neutral” stance. The reason? Concerns about soft spot rates and potential margin compression heading into the first half of 2025. Analysts flagged near-term headwinds tied to a sluggish freight environment and cautious customer spending.
⚖️ All in all, analyst sentiment remains mixed but leans stable. The company is seen as fundamentally sound, but near-term uncertainty in freight volumes and pricing continues to weigh on more aggressive forecasts. The price target consensus suggests upside potential, though not without bumps along the way.
Earning Report Summary
Solid Performance Despite Softer Freight Environment
Schneider National wrapped up the fourth quarter of 2024 with a report that showed stability in the face of a softer freight market. Revenue came in at $1.33 billion, down slightly—about 2.4% compared to the same quarter the year before. But even with that top-line dip, the company managed to grow its bottom line. Earnings per share hit 20 cents, up 25%, which is a decent finish given the broader industry headwinds.
Truckload Segment Gets a Boost
One of the brighter spots this quarter came from the Truckload division. Revenue, excluding fuel surcharges, rose 2% to just over $560 million. A good chunk of that growth came from the recent acquisition of Cowan Systems, which helped beef up Schneider’s Dedicated operations. The Cowan integration seems to be paying off early, giving this segment a bit more muscle while also supporting organic growth.
Intermodal Continues to Gain Ground
The Intermodal segment also turned in a solid showing. Revenues (again, excluding fuel surcharges) were up 6% year over year, reaching about $276 million. Volume increased by 3%, and revenue per order nudged up as well. Efficiency improvements on the drayage side and smarter use of the network helped make this part of the business more productive, and it showed in the results.
Logistics Segment Faces Pressure
On the flip side, the Logistics segment took a step back this quarter. Revenue dipped 5% to roughly $324 million. That pullback came mostly from lower volumes and softer pricing in brokerage. Even so, Schneider’s efforts to better manage margins helped cushion some of the impact. The acquisition of Cowan also helped balance things out here.
Cash Flow and Outlook
From a financial health perspective, things remain solid. The company ended the quarter with around $117 million in cash. Long-term debt climbed to $421 million, largely tied to recent acquisitions and investment plans. But they generated just under $200 million in cash from operations during the quarter, which keeps things in a comfortable spot.
Looking into 2025, Schneider is expecting adjusted earnings per share between 90 cents and $1.20. They’re planning capital spending in the $400 to $450 million range, aiming to strengthen both their Dedicated and Intermodal businesses. It’s a forward-leaning posture that suggests they’re staying focused on long-term growth, even in a challenging market.
Financial Health and Stability
Schneider runs a tight financial ship. Total debt is just over $610 million—not small, but manageable considering the size and complexity of the business. The company’s enterprise value-to-EBITDA multiple sits at 7.7x, which is a reasonable valuation in this industry and reflects decent market confidence.
They’ve got $165 million in cash on hand, which gives them a solid liquidity base. And let’s not overlook that operating cash flow—north of $686 million—provides a strong foundation for both daily operations and capital returns.
Returns on assets and equity are on the lower end (2.2% and 3.9%, respectively), but that’s pretty standard for an asset-heavy business like trucking. What matters more is that Schneider is profitable, consistent, and disciplined with its capital.
Valuation and Stock Performance
Trading at around $23.45, SNDR is well off its 52-week high of $33.90 and not far from its 52-week low of $20.50. For income investors, that kind of discount might open up a decent entry point. The stock’s forward P/E ratio is 21.8, while the trailing figure is up around 35.5—suggesting that earnings are expected to improve going forward.
Other valuation markers like Price/Sales (0.78) and Price/Book (1.38) suggest the stock isn’t overpriced. It’s sitting in a range where long-term investors can feel like they’re getting decent value without overpaying.
The beta is 0.82, so it tends to move less than the broader market. That can be a nice bonus if you’re looking to reduce portfolio volatility while still collecting income.
Risks and Considerations
Transportation is a cyclical business, and Schneider is no exception. When the economy slows down, so do freight volumes—and pricing often follows. That can squeeze margins quickly, especially with fuel and labor costs constantly shifting.
Competition is another factor. Between massive fleets and newer digital freight platforms, it’s a crowded space. Schneider has a strong legacy, but staying relevant means continuing to innovate and adapt. That’s easier said than done in a margin-sensitive business.
Lastly, while the dividend has been reliable, it’s not immune to cuts in a serious downturn. The current payout feels secure, but if we hit a prolonged recession or major disruption in the freight market, it’s something to keep an eye on.
Final Thoughts
Schneider National may not top the list of high-yield dividend plays, but there’s something appealing about its steady, no-drama approach. The yield isn’t going to blow anyone away, but it’s backed by a strong financial foundation and a management team that seems to value long-term stability.
If you’re an investor who likes dividends but doesn’t want to chase risk for extra yield, SNDR brings a lot to the table. It’s consistent, conservatively run, and still has room to grow if the freight market rebounds. For those willing to hold through the cycles, Schneider offers a quiet kind of reliability that’s easy to appreciate.