

Updated 3/13/25
Based in Milwaukee, Rockwell provides automation systems, software, and services that power everything from auto assembly lines to food packaging plants. It’s not the kind of company that grabs headlines daily—but that’s part of its charm for long-term, income-focused investors.
With a market cap just over $30 billion, it’s solidly in mid-cap territory. But size aside, what draws attention here is the steady dividend track record and a business model anchored in long-term industrial demand. Rockwell sits in the sweet spot of automation and digital transformation—a space with durable growth potential. Let’s take a closer look at what makes it worth watching for dividend-focused portfolios.
Recent Events
The latest numbers from Rockwell weren’t all that pretty. Revenue dropped 8.3% year-over-year, landing at $8.09 billion for the trailing twelve months. Net income also slid by more than 14%, signaling some pressure on both the top and bottom lines.
Some of the softness can be chalked up to weaker customer demand in certain markets and currency headwinds, both of which are common challenges for global industrial companies. But there’s good news too. Operating cash flow held up nicely at $1.19 billion, and free cash flow topped $937 million—still enough cushion to support its dividend payments.
Despite the hiccups, Rockwell isn’t in crisis mode. Its business tends to move with the cycles of global manufacturing, and those cycles can turn quickly.
Key Dividend Metrics
📦 Forward Yield: 1.96%
💵 Annual Dividend: $5.24 per share
📈 5-Year Average Yield: 1.71%
🔁 Payout Ratio: 63%
⏰ Years of Consecutive Dividend Increases: 13
📅 Next Dividend Payment: March 10, 2025
⚠️ Ex-Dividend Date: February 18, 2025
Dividend Overview
Rockwell isn’t going to blow you away with a high yield. At just under 2%, the yield is respectable but far from flashy. However, it’s important to look at this in context. Compared to its five-year average yield of 1.71%, the current level is slightly elevated, which might reflect a bit of market pressure on the stock price.
The company’s payout of $5.24 annually per share is comfortably supported by its cash flow. With a payout ratio of 63%, Rockwell is not stretching itself too thin, even with the recent dip in earnings. It’s a fairly balanced approach—prioritizing consistency over aggressive growth.
This isn’t the type of dividend stock that chases headlines. It quietly gets the job done, year after year.
Dividend Growth and Safety
One of the most attractive aspects of Rockwell’s dividend is the consistency. The company has raised its dividend for 13 straight years. That kind of track record isn’t accidental—it comes from a deliberate, disciplined strategy that prioritizes long-term shareholder returns.
Over the past five years, dividend increases have averaged around 6% annually. That’s a pace that not only keeps up with inflation but signals steady confidence from the management team.
From a safety standpoint, the dividend is well-covered by operating cash flow, which reached $1.19 billion last year. Even with a somewhat elevated debt load, the underlying cash generation gives Rockwell room to breathe. The margin of safety isn’t enormous, but it’s enough to give long-term investors comfort that this payout can hold up in tougher economic environments.
Chart Analysis
Price Movement and Structure
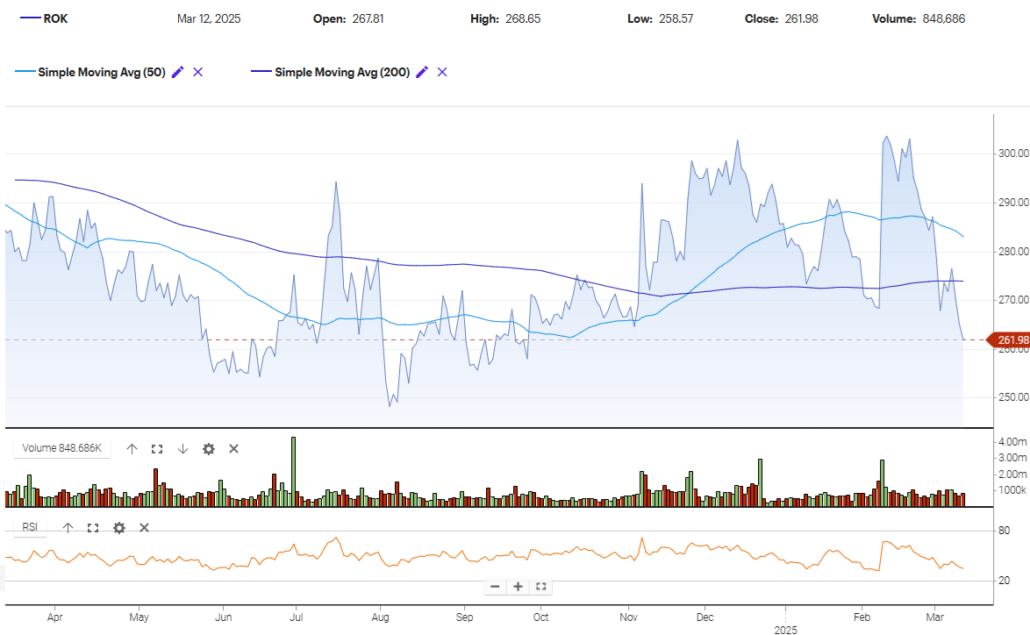
The price action in Rockwell Automation over the past year shows a clear transition through several market phases. The chart began with a persistent downtrend through the spring and early summer months, marked by lower highs and lower lows, drifting beneath both the 50-day and 200-day moving averages. This was a typical markdown phase, where distribution had likely taken place in the months prior, and sellers were firmly in control.
As the chart moved into late summer and early fall, the price began flattening out, showing signs of accumulation. While the lows around August briefly dipped sharply, they were quickly bought up—a clue that demand was beginning to re-enter. This range-bound behavior continued for several weeks, with the stock consolidating between roughly 255 and 270. Volume during this phase was uneven, with a few green spikes suggesting larger players stepping in on the dips.
Then, through November and into January, we saw a markup phase. The price pushed above the 200-day moving average for the first time in months and even managed to break through the 50-day SMA, which turned upward briefly. The higher volume accompanying several of these upward pushes confirmed the demand was real. However, this rally failed to build sustainable higher highs, stalling below the 310 mark before rolling over again.
Moving Averages
The 50-day moving average peaked in February and has since begun to turn lower again, signaling a loss of short-term momentum. Meanwhile, the 200-day moving average has remained relatively flat throughout, acting more as a pivot than a trend guide. Price is now decisively below both moving averages, with the 50-day curling down toward the 200-day—a bearish crossover could develop if this trend continues.
This pullback, especially the sharp drop back under both moving averages, points to a failed breakout and possibly the beginning of a new markdown cycle, or at least a retest of the prior base. Buyers who came in during the winter rally may now be under pressure.
RSI and Momentum
The RSI throughout most of the past month has been declining, currently hovering just above the oversold level. This tells us momentum has clearly shifted in favor of sellers. While not quite at panic levels, it does suggest there’s still room for more downside before hitting exhaustion.
Interestingly, the RSI during the markup phase never quite made it to extreme overbought territory, which aligns with the notion that this wasn’t a euphoric move but rather a hesitant recovery attempt that didn’t gain full conviction.
Volume Behavior
Volume spikes provide a useful tell here. Notice the strong green volume bars during July and November—both correspond to brief attempts at lifting out of consolidation. However, volume faded during the actual rally months, especially in January and February, indicating weakening demand just as the stock tried to push higher.
The recent pullback is accompanied by steady red volume, not explosive selling, but enough to show that buyers are standing aside while sellers regain control. There’s no panic selling just yet, but the lack of demand at current prices is noteworthy.
Candlestick Structure (Last 5 Days)
Looking closely at the last five candles:
- The most recent candle closed at 261.98, near the low of the session, with a decent-sized upper wick. That’s a clear sign of intraday selling pressure.
- The day before, a long-bodied red candle confirmed the loss of momentum from the prior short rally.
- The third candle back had a small real body with both upper and lower wicks—indecision, likely due to mixed sentiment around support levels.
- The fourth candle was green but lacked volume and follow-through.
- The fifth was a classic reversal candle, with a long upper wick, showing a failed attempt at regaining higher ground.
This cluster of candles, especially the latest two, paints a picture of selling pressure slowly overpowering weak buying attempts. Momentum is leaning bearish, and short-term traders are exiting positions on strength.
Analyst Ratings
Recent analyst activity on Rockwell Automation has reflected a split sentiment, with some firms maintaining neutral positions while others express cautious optimism. Here’s a breakdown of the latest updates from the analyst community.
📉 Barclays
Date: March 10, 2025
Rating: Equal-Weight
Price Target: Adjusted from $300 to $285
Barclays took a slightly more conservative approach by trimming their price target. While they didn’t downgrade the rating, the move likely reflects concerns around softer earnings and pressure in industrial spending. It’s a signal that, while the business remains fundamentally strong, near-term upside may be limited under current conditions.
📊 Loop Capital
Date: February 25, 2025
Rating: Hold
Price Target: Raised from $260 to $280
Loop Capital nudged their target higher, signaling a modest improvement in outlook. While still holding a neutral rating, the increase in target suggests the firm sees some recovery potential, possibly due to improving order volumes or stabilizing trends in key markets.
🚀 Morgan Stanley
Date: February 12, 2025
Rating: Overweight
Price Target: Raised from $335 to $345
Morgan Stanley stands out with a more bullish stance, raising their target to reflect confidence in the company’s strategic direction and long-term growth in industrial automation. They likely view Rockwell as well-positioned to benefit from continued investment in digital manufacturing and smart factory infrastructure.
🎯 Consensus Price Target: $312.67
This average reflects inputs from a broad group of analysts and sits above the current share price, indicating some potential upside over the next 12 months based on current expectations.
These revisions reflect ongoing recalibration based on Rockwell’s recent performance, broader macro trends, and sector dynamics. While not a dramatic shift in sentiment, the tone leans toward cautious optimism, particularly from firms that see value in the company’s automation leadership despite near-term earnings softness.
Earning Report Summary
Rockwell Automation’s latest quarterly report had a little bit of everything—some positives, a few bumps, and overall a sense that the company is managing through a tricky environment with steady hands. This was their first quarter of fiscal 2025, and while revenue was down, a few encouraging signs stood out.
Sales and Orders
Total sales came in at $1.88 billion, down about 8% from the same period last year. Most of that decline came from lower organic sales, with a smaller impact from currency fluctuations. On the flip side, orders were up a solid 10%, which is a good sign that customers are still engaging and planning future investments, even if current deliveries have slowed.
Segment Performance
It wasn’t an even story across all parts of the business. Intelligent Devices saw a noticeable drop, with sales falling 13%. Software & Control wasn’t far behind, down 12%. These two areas felt the brunt of the slowdown.
But not everything moved in reverse. The Lifecycle Services segment actually grew 5% year-over-year, showing strength in projects and ongoing customer support. It’s the kind of steady business that can help balance out some of the more cyclical areas when times get a little soft.
Profitability and Margins
Net income for the quarter landed at $184 million, or $1.61 per share. That’s down from last year, and adjusted earnings came in at $1.83 per share, about 10% lower. Margins tightened up as well, mostly because of lower volumes, though cost-saving measures helped cushion the blow a bit.
Cash Flow and Recurring Revenue
One of the bright spots in the report was cash flow. Operating cash hit $364 million, a big jump from just $33 million the year before. Free cash flow came in at $293 million—again, a sharp turnaround. Some of this was timing, especially with fewer performance-related payouts this quarter, but it was still a welcome improvement.
Rockwell also continues to build its subscription-based business. Annual recurring revenue (ARR) was up 11% compared to last year’s first quarter. That’s becoming a more important part of the story as the company shifts toward more predictable, long-term revenue streams.
Looking Ahead
Guidance for the rest of the year stayed mostly intact. Rockwell expects sales growth somewhere between a 5.5% decline and a small gain, depending on how the market plays out. EPS guidance was left unchanged, showing they’re still confident in managing through the ups and downs. The market seemed to take this all in stride—shares jumped about 7% after the report, as investors focused more on the strength of new orders and improving cash flow than the top-line dip.
Financial Health and Stability
Peeking under the hood, Rockwell’s financials paint a picture of cautious stability. It’s not sitting on piles of cash—just $477 million at last count—but that’s balanced against a reliable income stream and strong operational control.
Debt stands at just over $4 billion, which gives it a debt-to-equity ratio of about 113%. That’s on the high side, and something to keep an eye on, especially in a rising rate environment. However, it’s not uncommon for capital-heavy businesses like Rockwell to carry some leverage. The important part is that they’re managing it responsibly.
The return on equity sits at a healthy 24.85%, showing that management is putting shareholder capital to work efficiently. When paired with a current ratio just above 1, it’s clear the company can meet its short-term obligations, though it doesn’t have a huge liquidity cushion.
Overall, the balance sheet isn’t perfect, but it’s serviceable—and for a company focused on maintaining a steady dividend, that’s what counts.
Valuation and Stock Performance
Right now, Rockwell shares trade around $268, closer to their 52-week low than their high of $308. That’s a bit of a slide, and not totally surprising given the recent earnings softness.
Valuation-wise, things are a little rich. The forward P/E is just under 30, which is a stretch for an industrial firm, especially one with negative revenue and earnings growth in the latest quarter. The PEG ratio above 3.5 also raises eyebrows—it suggests that the market is pricing in higher growth than the numbers currently support.
For a dividend investor, though, the focus may be less on growth multiples and more on payout dependability. If you’re holding Rockwell for steady income and a conservative approach to capital returns, valuation becomes a secondary concern.
That said, anyone building a new position would want to think twice before stepping in at this price unless the broader growth story begins to reaccelerate.
Risks and Considerations
There are a few key risks worth noting here. The biggest is simply the cyclical nature of Rockwell’s business. When global manufacturing slows down, Rockwell tends to feel it fairly quickly. Demand for automation solutions isn’t recession-proof—it’s investment-driven and tied closely to economic cycles.
Competition is also heating up in the automation space. Firms like Siemens and others are pushing aggressively into digital solutions. While Rockwell has a strong brand and customer base, it’s not immune to competitive pricing pressure or the risk of falling behind on innovation.
Debt levels are another watchpoint. While manageable for now, any prolonged period of weak earnings could make the company’s leverage more of a concern. Lastly, with a beta of 1.38, the stock does tend to move more than the broader market. Volatility is something dividend investors need to be ready for.
Final Thoughts
Rockwell Automation is not the flashiest dividend stock out there—but that’s exactly what some investors are looking for. It offers a consistent, predictable income stream backed by a business that plays a critical role in the world’s manufacturing infrastructure.
Yes, it’s not without challenges. The valuation looks a bit rich, and earnings momentum has slowed. But for those seeking reliability, Rockwell has shown it knows how to keep paying investors even when the macro environment gets choppy.
It’s a name to watch closely. Not because it’ll explode upward overnight—but because it’s the kind of stock that quietly rewards patience. And in a world where income streams are harder to come by, that consistency holds real value.