

Updated 3/13/25
Realty Income isn’t just another REIT—it’s a brand dividend investors know well. Often called “The Monthly Dividend Company,” this real estate juggernaut has become one of the most trusted names when it comes to consistent income. With roots going back to 1969 and a public listing that dates to 1994, Realty Income has spent decades acquiring and managing high-quality, income-producing real estate.
Its portfolio? Vast. We’re talking over 13,250 commercial properties, leased primarily to well-known tenants across retail, industrial, and other service-based sectors. What makes it a standout isn’t just the size of the portfolio but the strategy behind it—long-term net leases, creditworthy tenants, and an operating model that emphasizes stability over flash.
For investors looking to collect income month after month, Realty Income has been the poster child of reliability.
Recent Events
So far, 2024 has been active for Realty Income. The company posted strong revenue growth, jumping 24.5% from the year prior. That kind of top-line expansion signals a busy acquisition pipeline and solid internal performance.
But while revenues moved up, earnings saw a dip. Net income dropped by 8.6% year-over-year, due in part to higher acquisition costs and possibly some churn or concessions with tenants. It’s a reminder that even in a well-oiled business model like this one, growth isn’t always free.
Debt has also climbed, now sitting just above $26.6 billion. With interest rates still sitting higher than we’ve gotten used to, some investors are watching that closely. The good news? Realty Income’s business model continues to pump out stable cash flow, thanks to long-term leases and steady occupancy.
Key Dividend Metrics
📈 Forward Dividend Yield: 5.72%
💸 Annual Dividend: $3.22 per share
📅 Dividend Frequency: Monthly
🔁 5-Year Average Yield: 4.85%
🧮 Payout Ratio (EPS-based): 319.69%
📆 Ex-Dividend Date: April 1, 2025
🏦 Consecutive Years of Increases: Over 30
Dividend Overview
Realty Income isn’t just a dividend payer—it’s a dividend machine. What makes it particularly attractive is that it pays every single month, like clockwork. That rhythm of income appeals especially to retirees and anyone managing cash flow more actively.
The yield right now sits at 5.72%, comfortably higher than the 5-year average. This isn’t one of those sky-high yields that sends up red flags. It’s a stable, sustainable payout supported by predictable rental income from a diversified list of tenants.
Names like Walgreens, FedEx, and Dollar General fill the roster. These are businesses that continue operating in nearly any economic environment, giving Realty Income a safety net of recurring revenue.
Dividend Growth and Safety
It’s easy to glance at the earnings-based payout ratio and get spooked—319% sounds extreme. But REITs operate under a different standard. The real measure of dividend safety here is Funds From Operations (FFO), and by that score, Realty Income keeps things in check.
The company’s dividend increases may not be flashy, but they’re dependable. A 3-4% growth rate each year has become the norm. It’s the kind of slow and steady pace that dividend purists can get behind.
What’s more, the dividend has never been cut. Even during recessions or market panics, Realty Income stayed the course. That track record speaks volumes about how management views its role as a steward of income for shareholders.
Chart Analysis
Overall Trend Structure
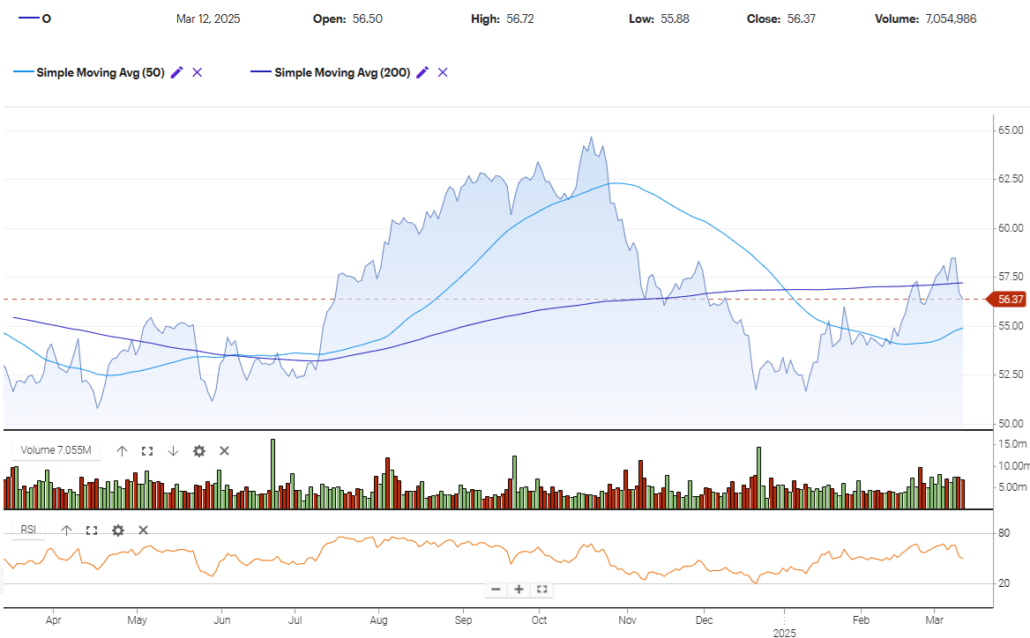
Looking at the chart for Realty Income (O), we’re seeing the tail end of a full cycle—something that started with accumulation in late spring and ran all the way through a strong markup into the fall months. From there, the stock shifted into distribution territory through September and October, followed by a clear markdown phase as the price trended lower into December.
That selloff was steady but not overly aggressive. The price carved out a rounded bottom near the $52 area, forming a base before starting to climb again in the new year. This slow climb suggests the early stages of re-accumulation, not full-blown markup just yet.
Moving Averages
The 50-day simple moving average crossed below the 200-day line in November, signaling a death cross and confirming the markdown. That 50-day average has since started curling upward and recently pushed back above the 200-day around early March—what traders refer to as a golden cross.
The price is hovering just around that 200-day mark now. It’s testing it from below with mild rejection, but volume isn’t spiking, so there’s no real conviction behind the selling pressure. That kind of behavior near long-term moving averages often reflects a tug-of-war between bulls trying to reclaim the trend and bears defending resistance.
Volume Behavior
Volume gives us a lot of clues here. We saw some clear spikes during the mid-June rally and again in early October, which coincided with the end of the markup phase. The heavy volume in October came during distribution—a signal that larger players were taking profits.
As the stock dropped into the low-$50s during December and early January, volume began to settle into a more balanced rhythm. What stands out is the uptick in green volume bars during February, right as the stock began curling off its lows. That’s a classic signature of quiet accumulation.
Volume hasn’t surged lately, but the steady flow of green bars hints that buyers are nibbling and not yet ready to chase.
RSI Movement
The relative strength index (RSI) has mostly stayed in neutral territory, avoiding deep oversold levels during the drop. This signals a measured correction, not a panic-driven flush. More recently, RSI pushed into the upper 60s during the March rally before rolling over slightly.
Right now, RSI is cooling off just under that 70 level, which shows some loss of upside momentum. That aligns with the price hovering around the 200-day and failing to break decisively above. It’s a natural breather, not necessarily a reversal.
Recent Candles
Zooming in on the latest five candles, we’re seeing smaller bodies with longer upper wicks. That tells us sellers are stepping in as the price approaches resistance, but the presence of lower wicks also shows buyers are still active and absorbing dips.
Each candle has had relatively narrow real bodies, reflecting indecision. These are the types of sessions where the market is waiting for a catalyst—either buyers gain confidence and push through the moving averages, or sellers overwhelm and drag the price back down toward the $54–55 range.
Volume on these candles has been steady, but not climactic. That supports the idea of a cooling-off period rather than anything extreme.
Market Cycle Position
Based on the chart’s full progression and current behavior, Realty Income looks to be finishing a Phase B of re-accumulation. The previous markdown completed into December, and the recent price action shows characteristics of early markup attempts that are still being tested.
The real confirmation will come if the stock can reclaim the $57–58 area on volume and hold above that 200-day moving average. Until then, it’s in a delicate stage—an early transition out of base-building with some signs of strength, but not enough to say the markup phase has kicked off in full.
Analyst Ratings
In recent months, Realty Income Corporation (ticker: O) has seen a handful of analyst rating changes that reflect a cautious yet balanced sentiment across Wall Street.
📉 Downgrades and Price Target Adjustments
🔸 On February 25, 2025, BNP Paribas Exane downgraded Realty Income from “Outperform” to “Neutral” and trimmed the price target from $66 to $61. The adjustment appears to stem from valuation concerns and broader market volatility, signaling a more wait-and-see stance.
🔸 Back in November 2024, Mizuho also revised its rating from “Outperform” to “Neutral,” cutting its target from $64 to $60. Rising interest rates and tightening cap rates may have played a role in this more reserved outlook.
📊 Price Target Revisions
Here’s how other firms recently adjusted their views:
🔹 Baird lowered its target from $60 to $59 on March 5, 2025, while holding a “Neutral” rating.
🔹 Barclays nudged its target up from $56 to $59 on March 4, keeping the rating at “Equalweight.”
🔹 Wedbush raised its outlook slightly, moving from $57 to $61 on March 3, while maintaining a “Neutral” stance.
🔹 Jefferies maintained its optimism, boosting the target from $64 to $65 with a “Buy” rating.
🔹 Scotiabank made a minor adjustment down to $57 from $59 on February 28, holding onto a “Sector Perform” rating.
🔹 RBC revised its target downward from $62 to $60 on February 26, but still sees the stock favorably with an “Outperform” call.
🎯 Consensus Price Target
Analysts currently have an average price target of approximately $60.95 for Realty Income. Individual estimates range from as low as $54 to as high as $65.50. This puts the stock’s current price slightly below the midpoint of that range, suggesting a moderate upside depending on how macro conditions unfold.
While the revisions haven’t been drastic, the collective tone has leaned more conservative in recent weeks. With interest rates still a dominant theme and REIT valuations sensitive to those shifts, analysts appear to be treading carefully—even with a name as stable as Realty Income.
Earning Report Summary
Realty Income closed out 2024 with a solid quarter that reflected the kind of steady performance income investors have come to expect. Revenue came in strong, up about 24% compared to the same time last year. That kind of jump isn’t something you see every day from a company this size, and it shows the impact of strategic acquisitions and a growing portfolio.
On the net income side, things were a bit softer. They reported around $200 million in profit available to common shareholders, or $0.23 per share. That’s down from last year’s $0.30 per share, mostly due to transaction costs and a few impairment charges. It’s not ideal, but it’s also not out of the ordinary for a REIT expanding aggressively. The core business is still humming along.
What really matters for a company like this is AFFO—adjusted funds from operations—and that came in at $1.05 per share for the quarter, up from $1.01 the year before. For the full year, AFFO hit $4.19 per share, which is a 4.8% increase. That’s the fourteenth straight year of growth in that metric, which says a lot about the predictability of their cash flow.
As for dividends, Realty Income didn’t disappoint. They bumped the monthly payout again in December, marking 109 consecutive quarterly increases. Over the year, the total dividends paid per share rose to $3.126. That payout represents about 75% of their AFFO, which leaves a decent cushion. In early 2025, they went ahead and raised the monthly dividend again, showing no signs of slowing down on that front.
On the property side, the company ended the year with over 15,600 properties and more than 1,500 clients across 89 different industries. Occupancy stayed strong at nearly 99%, which is right in line with what they’ve delivered in the past. During the fourth quarter alone, they acquired over 230 new properties in the U.S. and Europe, with a respectable 7.1% initial cash yield.
Financially, they’re on solid ground. Debt looks manageable with a net leverage ratio of 5.4 times EBITDA, and they’ve got nearly $3.7 billion in liquidity. That gives them room to keep making deals without overextending.
All in all, this was another quarter where Realty Income did what it does best—grow the portfolio, collect steady rent checks, and pass a good chunk of that on to shareholders.
Financial Health and Stability
Let’s take a look under the hood. Total debt is substantial at over $26 billion, and leverage is something to keep on the radar. But context matters—Realty Income is an investment-grade REIT with a conservative approach to capital.
They don’t speculate. They don’t overextend. And they’ve spaced out their debt maturities to avoid near-term refinancing risk. Cash on hand sits just under $445 million, and the current ratio of 1.33 shows they’re positioned to cover short-term obligations without sweating.
One of the key strengths here is the predictability of cash flows. Net leases mean tenants are responsible for things like maintenance and taxes. Realty Income just collects the rent, and that simplicity helps keep margins high and cash flow steady.
Valuation and Stock Performance
Shares are currently trading around $56. That puts the forward price-to-earnings ratio in the low 40s, which might look pricey at first glance. But REITs aren’t typically valued on earnings—they’re better evaluated on FFO and cash flow.
With an enterprise value to EBITDA ratio around 17.7, Realty Income is sitting within its historical comfort zone. It’s not a bargain basement deal, but it’s also not stretched beyond reason, especially given the quality of its real estate and tenant base.
The stock itself has traded in a fairly tight range between $51 and $65 over the past year. It hasn’t been a market leader in price performance, but that’s not the role it plays in a portfolio. For income investors, the value lies in consistency, not explosive gains.
Risks and Considerations
No investment is immune to risk, and Realty Income has a few worth highlighting. Interest rates are top of mind for REIT investors. Higher rates increase borrowing costs and can pressure valuations across the sector.
Another thing to watch is tenant risk. While the portfolio is diversified, any major issues in retail or a few larger tenants running into trouble could create ripple effects. So far, Realty Income has managed this risk exceptionally well, but it’s always something to monitor.
There’s also the potential for dilution. Like many REITs, Realty Income funds growth through equity issuance. When done thoughtfully, this can be accretive, but there’s always the chance of shareholder dilution if not managed carefully.
Lastly, keep an eye on broader economic conditions. While many of Realty Income’s tenants are recession-resistant, slower economic growth or changing consumer patterns could affect occupancy or lease renewals.
Final Thoughts
Realty Income stands out not because it’s the fastest-growing REIT or the flashiest investment, but because it delivers what it promises—steady, monthly dividends backed by real assets and long-term leases.
For investors focused on generating reliable income without riding the daily roller coaster of more volatile sectors, Realty Income offers a refreshing level of consistency. Its dividend is well-supported by recurring rental income, its property base is rock solid, and its strategy is grounded in discipline.
It’s not the kind of stock that will dominate headlines. But it’s the one that quietly shows up, month after month, year after year—doing exactly what it was built to do. For income-focused investors, that kind of dependability is worth its weight in dividends.