

Updated 3/13/25
When you think about the big names in banking, PNC might not be the first that comes to mind. But dig a little deeper, and this Pittsburgh-based financial giant stands out for all the right reasons. It’s one of the country’s largest regional banks, managing to strike a balance between solid fundamentals and smart, steady growth.
PNC has carved out its space in the industry through a focus on retail and commercial banking, wealth management, and a long-standing commitment to conservative operations. It’s not flashy, but that’s exactly what makes it appealing to dividend investors. Especially in a market where consistency is becoming a rare trait.
Recent Events
Over the past year, it’s been a bumpy ride for the banking sector. Interest rate swings, inflation anxiety, and growing scrutiny on regional banks have made headlines. Through it all, PNC kept its head down and delivered.
Earnings in the most recent quarter were surprisingly strong, showing an 86% jump in quarterly net income compared to the year before. That’s not something you see every day from a bank during uncertain economic times. The company’s ability to manage credit risk and keep its balance sheet clean has made it stand out among its peers. While others were trimming dividends or signaling caution, PNC quietly kept its promises to shareholders.
Key Dividend Metrics 📊💰📈
📆 Forward Dividend Yield: 3.69%
🧾 Annual Dividend: $6.40 per share
💡 5-Year Average Yield: 3.57%
🛡️ Payout Ratio: 45.85%
🔁 Dividend Growth: 12 years running
📉 Trailing Dividend Yield: 3.63%
🗓️ Most Recent Payout: February 5, 2025
📅 Ex-Dividend Date: January 15, 2025
Dividend Overview
At a glance, PNC offers a pretty compelling case for income investors. A forward yield just shy of 4% is nothing to scoff at, especially from a company that hasn’t missed a beat in over a decade.
The $6.40 per share dividend feels secure, backed by a company that doesn’t chase growth just for the sake of it. And with a payout ratio under 50%, there’s enough breathing room to keep those checks coming—even if the economy hits a rough patch.
This isn’t the kind of stock that makes headlines with wild increases or risky distribution models. It just keeps doing what dividend investors need: paying reliably and leaving room for steady growth.
Dividend Growth and Safety
PNC has been steadily increasing its dividend every year for over a decade now. That kind of consistency matters. In fact, it becomes even more valuable during turbulent market cycles.
Earnings per share came in at $13.73 over the last twelve months. When you compare that to the dividend payout, it’s clear the company is keeping things balanced. The current payout ratio at just under 46% is a sweet spot. It means the bank is returning cash to shareholders, but not at the expense of growth or stability.
In short, it’s the kind of setup that suggests more increases could be in the pipeline, assuming earnings hold up.
Chart Analysis
Current Stage in the Market Cycle
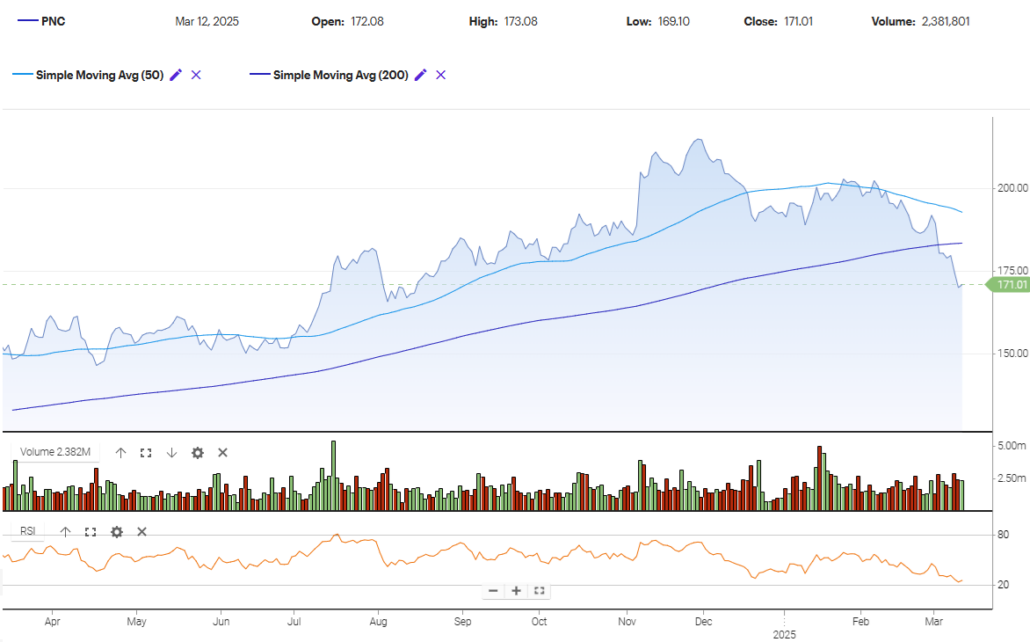
The chart for PNC shows clear signs of transitioning from distribution into markdown. For much of 2024, we saw a strong uptrend—characterized by higher highs and higher lows—accompanied by price hugging or riding above the 50-day moving average. That phase reflects the markup portion of the Wyckoff cycle, where institutional buying supported the climb.
But things shifted as the stock started showing signs of distribution between late November and early January. Prices moved sideways in a choppy range, struggling to break new highs and forming rounded tops. Volume during that period stayed elevated on red days, suggesting larger holders were unloading shares quietly while retail buying propped up price temporarily.
Now, the price has broken below both the 50-day and 200-day moving averages. That crossover happened decisively, not gradually. The 50-day is trending downward and recently pierced the 200-day—what many refer to as a “death cross.” While not always predictive in isolation, in this case, it confirms that we’ve entered the markdown phase. Sellers are now in control.
Volume and Price Relationship
Volume tells a revealing story here. During the peak distribution phase, we saw a series of lower highs accompanied by increasing volume on down days. That kind of behavior is textbook for supply overwhelming demand. As the chart transitioned into the recent sharp drop, volume picked up again—indicating conviction behind the selling pressure.
This recent leg down came with consistent red volume bars, showing that sellers have been active and persistent. Notably, volume hasn’t spiked into panic territory, which suggests we haven’t yet hit full capitulation. But we are seeing increased intensity as the price slides.
RSI and Momentum
The RSI is now scraping into oversold territory, approaching the 20 level. While this might look attractive for a short-term bounce, it’s important to recognize that in markdown phases, RSI can stay low for longer than expected. This isn’t the kind of dip buyers typically rush into, especially when both moving averages are now resistance levels.
The loss of momentum has been steady and controlled rather than sharp and reactive. That typically points to institutional distribution rather than panic selling, which aligns with the Wyckoff interpretation.
The Last Five Candles
Looking at the most recent candles:
- The first was a wide-range red candle with a long body and minimal lower wick—clear downward pressure with little pushback from buyers.
- The next candle attempted a recovery but had a long upper wick, indicating sellers sold into strength quickly.
- The third showed further loss, again closing near the lows of the day.
- The fourth had a bit of a lower wick, hinting that some buyers stepped in, but the close was weak.
- The most recent candle was a slight gap down, again closing near its lows and pressing beneath a key support level, now turned resistance.
The lack of strong lower wicks in this sequence shows there’s no aggressive buying interest—just weak attempts to halt the decline.
Moving Averages and Structure
The breakdown below the 200-day moving average is significant. That level had acted as support for months, especially during the summer-fall accumulation and markup. Now that it’s lost, and with the 50-day moving average curling downward, sellers are firmly in control.
Structure-wise, this now looks like a completed distribution top that has failed to hold above key levels, confirming the markdown. Until we see a spring-like reaction or a selling climax with high volume, this phase likely continues.
Analyst Ratings
PNC Financial Services Group has been drawing mixed attention from analysts lately, with a few cautious revisions and several steady hands holding firm on their outlook.
📉 On March 19, 2025, Goldman Sachs reiterated its rating on PNC but adjusted the price target downward from $211.00 to $188.00. That shift points to a more conservative stance, likely driven by recent weakness in the broader financial sector and ongoing concerns about net interest margin compression. With rising funding costs and uncertain loan demand, it’s no surprise analysts are dialing back expectations a bit.
📊 Earlier in the year, on January 17, 2025, several research houses stood their ground. Morgan Stanley reaffirmed its view without changing its price target. Stephens & Co. echoed the same sentiment, as did Truist Securities. The fact that none of these firms downgraded or adjusted their targets too dramatically suggests they still see PNC as fundamentally solid, despite near-term macro noise.
🎯 The current consensus among 22 analysts leans positive. The average price target sits at $216.78, which reflects about a 25% upside from where shares are currently trading around $173.35. The range is wide, though—high estimates reach $257.00, while the lowest sits closer to $181.00. That kind of spread shows some disagreement on just how strong PNC’s rebound might be if market conditions improve.
💬 Why the divergence? For some, it comes down to PNC’s balance of conservative risk management and its exposure to commercial lending. While some banks have been more aggressive, PNC’s cautious approach has shielded it from bigger credit shocks—but also capped its near-term growth prospects. Some analysts are rewarding that prudence, while others are waiting to see stronger catalysts before upgrading.
Despite the recent markdown in expectations from a few names, the general tone around PNC remains one of cautious optimism. The market’s just trying to figure out how long it’ll take for fundamentals to translate into share price momentum again.
Earning Report Summary
PNC closed out 2024 on a strong note, delivering a fourth-quarter performance that showed both stability and a little upside surprise.
Net income came in at $1.6 billion, which translates to $3.77 per share. That’s a solid jump from where they were a year ago—more than double the $1.85 per share they posted in Q4 2023. For the full year, they pulled in about $6 billion in profit, or $13.74 per share, so there’s been a steady gain in earnings power.
Revenue was up too. They brought in a little over $5.5 billion for the quarter, a modest bump from both the prior quarter and the same time last year. What’s interesting is that both the lending side and the fee-based business chipped in. Net interest income rose to $3.52 billion, helped by some easing in funding costs and better pricing on fixed-rate assets. Their net interest margin moved up to 2.75%, which is a healthy improvement quarter-over-quarter.
On the noninterest income side, PNC saw a bit of growth as well. That part of the business hit $2.04 billion for the quarter, with solid contributions from asset management and their capital markets group. Nothing flashy, but consistent, which is what you want to see from a bank trying to keep its revenue mix balanced.
Expenses ticked up slightly to $3.5 billion, mainly due to tech-related impairments and a bit of extra marketing spend. But compared to last year’s Q4, expenses actually dropped quite a bit, so overall cost control looks pretty solid.
Loan activity was pretty stable—average loans sat at around $319 billion. Commercial lending held steady, and while consumer loans were flat, they didn’t fall off. Deposits came in just a touch higher at $425 billion, helped by an uptick in commercial balances, even though consumer deposits dipped slightly.
Credit quality continues to hold up. PNC only set aside $156 million for credit losses, a decline from the same quarter last year. That suggests they’re feeling more confident about the loan book, or at least not seeing any big red flags in terms of defaults.
They also ended the year with a stronger capital position. Their Tier 1 common equity ratio rose to 10.5%, up from 9.9% a year ago. It’s a reassuring sign that they’re managing growth while keeping their balance sheet in check.
All in all, it was a clean, well-rounded quarter that signals PNC is staying the course and navigating this rate environment with discipline.
Financial Health and Stability
PNC has always been more of a “steady hand” than a risk-taker. That approach paid off during the regional banking drama of the past year. With nearly $10 billion in cash and a measured approach to debt—around $66.7 billion total—PNC’s balance sheet looks solid.
Book value per share is hovering around $123, and with the stock trading around $175, the price-to-book ratio sits just above 1.25x. That’s not excessive for a bank of this caliber.
The company is also delivering decent returns—over 11% return on equity and just above 1% return on assets. Those numbers might not scream excitement, but they do whisper something more valuable: reliability.
Another point worth mentioning—about 85% of the stock is held by institutions. That tells you the big players trust this name to deliver over time.
Valuation and Stock Performance
At a trailing P/E of 12.6 and a forward P/E closer to 11.2, PNC isn’t priced like a high-flyer, but it’s also not trading in deep discount territory. It sits in that interesting middle ground: reasonably valued with some upside if growth continues, but unlikely to crater even in a soft market.
Its PEG ratio (which measures price relative to earnings growth) is 1.65, signaling a fair value. In other words, you’re not paying too much for future earnings potential.
And the market seems to be picking up on it. Shares are up nearly 12% over the last 12 months, outperforming the broader S&P 500. Not bad for a bank stock that doesn’t generate much buzz.
Risks and Considerations
There are always risks with any stock, and banks face their own unique set. Interest rate movements remain a wildcard. A sudden pivot in Fed policy or a prolonged period of lower rates could put pressure on margins.
There’s also the lingering issue of regulatory pressure. As scrutiny on regional banks grows, PNC could find itself facing tighter capital requirements or increased compliance costs down the road.
The other factor to keep an eye on is credit quality. While PNC has done a good job keeping its loan book in order, rising delinquencies or defaults—especially in commercial real estate—could create headwinds.
And don’t forget market sentiment. With a beta of 1.13, this stock tends to move in line with broader market trends, which means it’s not a shelter-in-the-storm type investment during volatility.
Final Thoughts
PNC doesn’t chase trends. It’s not the stock you brag about at dinner parties. But for dividend-focused investors who want steady income, it offers something arguably more valuable: dependability.
The dividend yield is attractive, the payout is safe, and the company’s long track record of measured growth and financial discipline adds to the appeal. It’s the kind of stock that may not make headlines—but will quietly reward you year after year with rising income and solid total return potential.
If you’re building a dividend portfolio centered on quality, sustainability, and the long game, PNC deserves a closer look.