

Updated 3/11/2025
Old Republic International Corporation (NYSE: ORI) isn’t the kind of stock that makes headlines, but for long-term dividend investors, that’s part of its appeal. Founded in 1923, this insurance company has built a reputation for consistency, conservative management, and a commitment to rewarding shareholders.
ORI operates in property and casualty insurance, with a strong foothold in title insurance. Over the years, it has weathered economic downturns and industry shifts, all while maintaining a rock-solid dividend track record. Investors looking for a steady source of passive income often find ORI to be a compelling choice.
Key Dividend Metrics
📈 Dividend Yield: 3.16%
💰 Annual Dividend: $1.16 per share
📅 Next Dividend Payment: March 20, 2025
🚨 Ex-Dividend Date: March 10, 2025
📊 Payout Ratio: 32.72%
📆 5-Year Average Yield: 3.77%
Dividend Overview
ORI has been rewarding shareholders for decades with consistent dividend payments, making it a solid pick for income-focused investors. Right now, its dividend yield stands at 3.16%, a bit below its five-year average of 3.77%. That suggests the stock has appreciated faster than its dividend growth, which isn’t necessarily a bad thing.
One of the more attractive aspects of ORI’s dividend policy is its history of issuing special dividends. While its base payout remains steady, the company has periodically given shareholders extra cash when performance allows. This makes ORI even more appealing for investors who prioritize steady income with the potential for occasional bonuses.
Dividend Growth and Safety
📈 Dividend Growth Rate: 2.89% annually
🔒 Payout Ratio: 32.72%
📊 Dividend Stability: Strong, with a history of increases and special payouts
One of the biggest reasons investors trust ORI for income is its commitment to maintaining and growing its dividend. The payout ratio is only 32.72%, meaning the company keeps a healthy portion of its earnings for reinvestment while still rewarding shareholders.
Dividend growth hasn’t been rapid, but it has been reliable. The company has never missed a payment in over 50 years, making it one of the most dependable dividend stocks in the insurance sector. For investors looking for steady income without worrying about cuts, that’s a major plus.
Chart Analysis
Overall Trend and Moving Averages
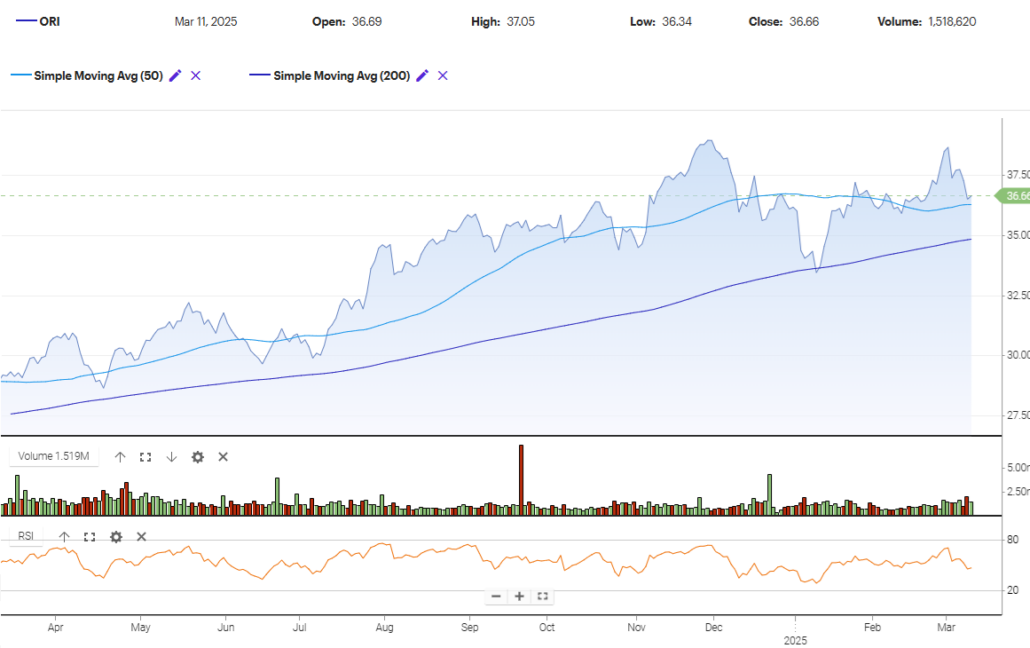
The chart for Old Republic International (ORI) shows a steady uptrend over the past year, with price action consistently moving higher. The 50-day moving average (blue line) has remained above the 200-day moving average (purple line) for most of this period, signaling a strong bullish trend. However, more recently, the price has been hovering close to the 50-day moving average, suggesting that momentum may be cooling off a bit.
The 200-day moving average is steadily rising, which indicates long-term strength. As long as the price stays above this level, the broader trend remains intact. The short-term pullbacks seen throughout the chart have been met with buying interest, confirming that investors continue to see value in ORI at lower levels.
Recent Price Action and Support Levels
The stock opened at 36.69 and closed slightly lower at 36.66, with an intraday low of 36.34. This suggests some mild selling pressure, but not enough to cause any significant breakdown. The 50-day moving average appears to be acting as a near-term support level, and if the stock continues to hold above it, the uptrend remains intact.
A key level to watch is the 35.00 to 35.50 range, which has previously served as a base for rebounds. If the price falls below the 50-day moving average, this range could become the next major support area. On the upside, resistance appears near recent highs around 37.50 to 38.00. If ORI pushes through this level, it could see another leg higher.
Volume and Buying Interest
The volume for the day came in at 1.52 million shares, which is in line with the stock’s normal trading activity. There is no major spike in volume, meaning the current price action is more of a normal consolidation rather than a strong shift in sentiment.
Looking at the volume bars throughout the chart, there are some noticeable spikes, particularly during October, where there was a large surge in trading activity. This could have been tied to earnings or a major event, but regardless, it showed a strong presence of buyers stepping in. Lately, volume has been more balanced, suggesting that buyers and sellers are more evenly matched.
Relative Strength Index (RSI) and Momentum
The RSI indicator at the bottom of the chart shows that the stock has been hovering around neutral levels. It’s not in overbought territory (above 70), but it’s also not deeply oversold (below 30). This means that there’s still room for upside if momentum picks up again, but also that the stock may need to cool off before making its next move.
There was a period where RSI approached the overbought zone, which coincided with the stock hitting recent highs. Since then, the RSI has been gradually declining, signaling that bullish momentum has weakened somewhat. However, it hasn’t dropped to a level that suggests the stock is under heavy selling pressure. If RSI starts trending lower toward 40, it could indicate a deeper pullback is coming.
Short-Term Candle Analysis
Looking at the past five daily candles, there is a mix of small-bodied candles with upper and lower wicks. This suggests some indecision in the market, with neither buyers nor sellers in firm control. The presence of wicks on both ends means that the stock has been testing different price levels but ultimately closing near where it opened.
One of the candles shows a slightly longer upper wick, which indicates that sellers stepped in at higher levels and pushed the price lower by the close. This kind of action can sometimes precede a short-term pullback. However, since there’s no major bearish engulfing pattern or strong downward candle, the stock is still in a wait-and-see phase.
If buyers step in and push the stock above recent highs, it could resume its uptrend. On the other hand, if selling pressure builds, it might test the support levels discussed earlier.
Analyst Ratings
📊 Upgrades:
📈 In April 2024, an analyst at Piper Sandler maintained an overweight rating on ORI and raised the price target from $32 to $38. This decision was based on the company’s strong financial results and a positive outlook for its insurance operations.
📈 Later in October 2024, the same analyst revised the price target upward again from $36 to $37, maintaining the overweight stance. The rationale for the upgrade was continued strong performance in ORI’s core business segments, particularly in its title and property insurance divisions.
📊 Downgrades:
📉 In February 2025, ORI received a downgrade from buy to hold by another analyst, citing concerns about potential headwinds in the insurance sector. The shift in rating was driven by uncertainty in premium growth, regulatory factors, and a slightly less optimistic near-term growth forecast.
📉 Some analysts expressed concern over macro pressures in real estate, which could impact ORI’s title insurance segment, leading to a more cautious stance on future revenue growth. While the long-term outlook remains stable, there were short-term uncertainties that contributed to the more neutral rating.
📊 Consensus Price Target:
💰 As of March 2025, the consensus price target for ORI stands at $37.00. Analysts appear split on the stock, with some highlighting strong fundamentals and growth potential, while others remain cautious due to industry challenges and external economic conditions.
🔎 These mixed ratings reflect the ongoing debate among analysts about ORI’s future trajectory, with factors such as market conditions, interest rate environments, and insurance sector trends shaping the stock’s outlook.
Earnings Report Summary
Old Republic International (ORI) recently released its latest earnings report, showing a mix of steady growth and a few challenges. The company continues to demonstrate resilience in the insurance sector, with solid revenue growth and disciplined financial management.
Fourth Quarter Highlights
Net income for the quarter came in at $105.1 million, or $0.42 per share, which was lower than last year’s $190.6 million. The drop was mainly due to fewer investment gains, but when you strip out those one-time factors, operating income actually improved to $227 million, up from $190.4 million in the same period a year ago.
Revenue also showed strength, climbing 11.4% to $1.94 billion. Investment income was another bright spot, increasing 9.8% to $170.3 million. ORI’s combined ratio, which measures underwriting profitability, edged lower to 92.7%, meaning the company is running more efficiently.
Full-Year Performance
For the full year, ORI delivered $852.7 million in net income, translating to $3.24 per share, an improvement from $598.6 million in the prior year. Operating income came in at $797 million, a solid gain over $749.5 million in 2023.
Premiums and fees earned for the year jumped 9.0% to $7.31 billion, and investment income surged 16.4% to $673.1 million. The combined ratio for the year ticked up slightly to 93.9%, but it remains in a healthy range.
Business Segment Breakdown
The general insurance segment was a big driver of growth, with net premiums earned rising 13.3% in the fourth quarter and 13.5% for the year. ORI benefited from strong pricing, good customer retention, and a steady pipeline of new business. Commercial auto, property, and general liability lines were the standout performers.
On the title insurance side, revenue climbed 8.7% for the quarter and 2.2% for the year. Commercial real estate premiums helped offset some of the slower residential activity, keeping this segment on stable footing.
ORI continued to reward shareholders, announcing a special cash dividend of $2.00 per share during the year. This was in addition to its regular dividend, reinforcing its commitment to returning value to investors.
Book value per share increased 11.1% to $22.84, reflecting strong balance sheet management. Even with some industry headwinds, ORI’s performance shows that the company is maintaining steady growth while keeping financial discipline at the core of its strategy.
Financial Health and Stability
💰 Total Cash: $1.61 billion
📊 Debt-to-Equity Ratio: 31.91%
🏦 Book Value Per Share: $22.89
🔄 Operating Cash Flow: $1.23 billion
ORI operates in a capital-intensive industry, but its balance sheet is in strong shape. The company is sitting on over $1.6 billion in cash, giving it plenty of flexibility for operations, investments, and dividend payments. Its debt levels are manageable, with a debt-to-equity ratio of 31.91%, well within a comfortable range for an insurer.
Cash flow is another positive. ORI generated $1.23 billion in operating cash flow over the last year, reinforcing its ability to continue funding dividends without strain. However, one concern is that its levered free cash flow is negative, which suggests significant reinvestment in the business. While not necessarily a red flag, it’s something investors should monitor going forward.
Valuation and Stock Performance
💵 Current Price: $36.49
📈 52-Week High: $39.27
📉 52-Week Low: $28.59
🔄 Price-to-Book Ratio: 1.62
📊 P/E Ratio: 11.31
ORI’s stock has been performing well, currently trading near the upper end of its 52-week range. Its price-to-earnings ratio sits at 11.31, which is fair for an insurance company and suggests the stock isn’t overpriced.
Another important valuation measure is the price-to-book ratio, which is currently 1.62. This means investors are paying a slight premium over ORI’s book value, which is typical for a financially strong and well-managed insurer. The stock has moved higher recently, so investors looking to enter might want to wait for a pullback closer to its 200-day moving average of $34.85 to secure a better yield.
Risks and Considerations
⚠️ Economic Sensitivity: ORI’s business, particularly title insurance, is closely tied to real estate activity. A slowdown in the housing market could impact earnings.
⚠️ Interest Rate Risks: Insurance companies benefit from higher interest rates because they earn more on their investment portfolios. However, rising rates can also slow down mortgage and real estate transactions, affecting ORI’s title insurance division.
⚠️ Earnings Volatility: The company’s most recent earnings showed a 44.9% year-over-year decline in quarterly profits. While this could be a temporary dip, it’s something to keep an eye on.
⚠️ Regulatory Environment: Insurance is a heavily regulated industry, and any changes in state or federal laws could impact ORI’s profitability.
Final Thoughts
ORI isn’t the kind of stock that generates a lot of excitement, but for dividend investors, that’s often a good thing. It has a long track record of steady payouts, a solid balance sheet, and a conservative approach to financial management.
The current yield of 3.16% is slightly below its five-year average, meaning the stock has appreciated in value. While dividend growth is slow, the company makes up for it with a history of special dividends, giving investors occasional bonus payments on top of the regular payout.
For those looking for a dependable dividend stock, ORI is worth watching. It’s not going to deliver rapid growth, but it will keep paying its dividend through thick and thin—a quality that’s hard to find in today’s market.