

Updated 3/11/2025
Northeast Indiana Bancorp, Inc. (NIDB) isn’t a stock that makes headlines, but for income-focused investors, it has some compelling attributes. As a small regional bank, it operates through First Federal Savings Bank, providing a range of financial services, from mortgage lending to business banking.
With a market cap just north of $42 million, this micro-cap stock flies under the radar, yet it has a track record of consistent dividend payments. Its valuation appears reasonable, with a price-to-earnings (P/E) ratio of 9.8 and a price-to-book (P/B) ratio under 1. For those seeking a steady income stream from their investments, NIDB deserves a closer look.
Key Dividend Metrics
📌 Dividend Yield: 4.15% (Forward)
📌 Annual Dividend Payout: $0.72 per share
📌 5-Year Average Dividend Yield: 3.18%
📌 Payout Ratio: 36.72%
📌 Dividend Growth: Increased from $0.69 last year
📌 Ex-Dividend Date: February 13, 2025
📌 Dividend Payment Date: November 21, 2024
Dividend Overview
NIDB currently offers a forward dividend yield of 4.15%, which stands above its five-year average of 3.18%. This indicates either the stock is undervalued or that management has prioritized returning capital to shareholders through higher dividend payouts. The annual dividend payout of $0.72 per share represents a slight increase from the previous year’s $0.69, signaling a commitment to steady dividend growth.
A payout ratio of 36.72% suggests dividends are well-covered by earnings. That’s a healthy range—low enough to allow for reinvestment but high enough to provide a meaningful return to shareholders. For income investors, this is a good balance between sustainability and rewarding stockholders.
Dividend Growth and Safety
One of the most reassuring aspects of NIDB’s dividend is its conservative payout ratio. With earnings easily covering dividends, there’s room for further growth without putting financial stability at risk.
The company has a history of gradually increasing its dividend, which speaks to its reliability as an income investment. While it may not be a high-growth dividend stock, it offers consistency, something many investors value in a long-term portfolio.
From a safety standpoint, NIDB’s return on equity (ROE) is 9.09%, a solid figure that suggests the company is effectively utilizing shareholder capital. A profit margin of 25.06% indicates strong earnings power, which is key for maintaining dividend payments over time.
Stock volatility is also relatively low, with a beta of just 0.41. This means the stock moves less dramatically than the broader market, which can be attractive for conservative investors who want stability.
Chart Analysis
Overall Trend
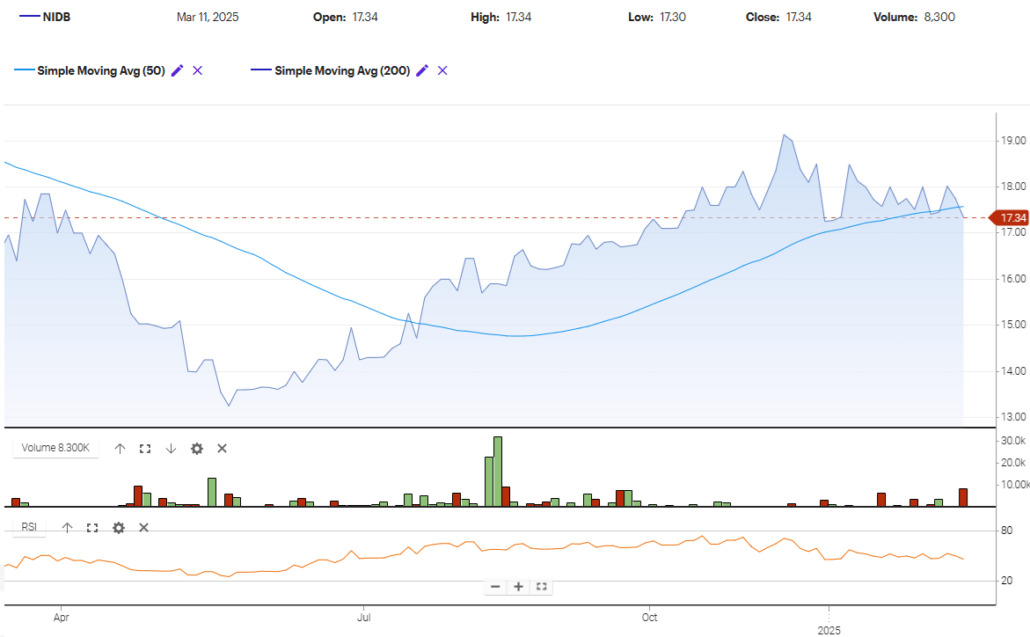
The chart for Northeast Indiana Bancorp (NIDB) shows a significant shift in momentum over the past year. Earlier in the timeframe, the stock was in a clear downtrend, with price action remaining below the 50-day moving average. However, that changed mid-year when the stock reversed course and entered a steady uptrend.
The 50-day moving average has now crossed above the 200-day moving average, signaling a bullish crossover. This is typically a strong indicator that the trend has shifted in favor of buyers. That being said, the recent price action suggests the stock is facing some resistance around the $18 mark, as it has struggled to push higher despite multiple attempts.
Support and Resistance Levels
The stock has established a strong support zone around $16.50, which aligns closely with the 200-day moving average. Price has tested this area multiple times and has consistently bounced higher, making it an important level to watch.
On the upside, resistance appears to be forming near the $18.50 to $19 range. The stock has attempted to break through this area but has been met with selling pressure. Until a decisive breakout occurs, this will likely remain a key level where traders take profits.
Recent Price Action
Over the past few weeks, the stock has been consolidating near its 50-day moving average. The last five candles show some indecisiveness, with small-bodied candlesticks and wicks on both ends. This suggests a tug-of-war between buyers and sellers, with neither side gaining full control.
Volume has also tapered off compared to the spike seen during the mid-year rally. Lower volume during a consolidation phase can indicate that investors are waiting for a catalyst before committing to new positions. If volume picks up alongside a move higher, that could be a signal of renewed buying interest.
Volume and Buying Pressure
The volume bars show a clear increase in buying activity around mid-year, which coincided with the price reversal. However, more recently, volume has declined, which often signals reduced momentum. The occasional spikes in red bars indicate that sellers are stepping in at key resistance levels.
A renewed surge in volume—especially on green days—would be a positive signal that the uptrend can continue. If volume remains muted, the stock may struggle to break above resistance.
Relative Strength Index (RSI)
The RSI indicator is hovering in neutral territory, neither overbought nor oversold. This suggests the stock isn’t currently in an extreme condition, leaving room for movement in either direction. If RSI begins to trend downward below the 40 level, it could indicate weakening momentum. On the other hand, a push above 60 would be a sign of renewed strength.
Analyst Ratings
📉 Recent Downgrade
Northeast Indiana Bancorp, Inc. (NIDB) recently received a “Sell” rating from an analyst, with a price target of $7.50, significantly lower than its current trading price of $17.34. The downgrade appears to stem from concerns over the bank’s small market capitalization and the risks associated with micro-cap financial institutions.
🔸 Liquidity Concerns – With a relatively low trading volume, NIDB is not as liquid as larger banks, making it more volatile. Investors may find it harder to enter and exit positions without affecting the stock price.
🔸 Regional Risk Exposure – Unlike national banks that diversify across multiple markets, NIDB is concentrated in a specific geographic region. Any downturn in the local economy could impact its financial performance.
🔸 Growth Limitations – While the company has delivered steady results, its ability to expand meaningfully is more constrained than its larger peers. This can cap long-term upside potential.
📈 Undervaluation Perspective
Despite the downgrade, some investors argue that NIDB’s valuation metrics suggest it may be undervalued at current levels.
🔹 Low P/E Ratio – With a trailing P/E of 9.80, the stock is priced below broader financial sector averages, making it potentially attractive for value investors.
🔹 Price-to-Book Under 1 – A P/B ratio of 0.91 indicates the stock is trading below its book value, which can be a signal that the market is underestimating its assets and earnings potential.
🔹 Consistent Dividend – With a 4.15% yield and a low payout ratio of 36.72%, the dividend remains well-supported by earnings, appealing to income-focused investors.
🧐 Final Takeaways
The recent “Sell” rating highlights the challenges that come with investing in a micro-cap regional bank. However, the undervaluation argument remains valid, especially for those willing to tolerate lower liquidity and a smaller market presence. The lack of widespread analyst coverage means that investors must rely on their own research to weigh the risks against potential rewards.
Earnings Report Summary
Northeast Indiana Bancorp, Inc. (NIDB) recently released its latest earnings report, giving investors a look at how the company has been performing. The numbers showed some mixed results, with both positives and challenges.
For the third quarter of 2024, the company reported net income of $1.0 million, or $0.43 per diluted share. That’s a slight drop from the same quarter last year, when earnings came in at $1.2 million, or $0.51 per share. A big reason for the dip was an increase in credit loss provisions, meaning the bank had to set aside more reserves for potentially bad loans. Despite this, other areas of the business helped balance things out, including an increase in other income.
Looking at the bigger picture, for the first nine months of 2024, NIDB’s net income reached $3.3 million, or $1.39 per share. That’s down a bit from the $3.5 million, or $1.46 per share, reported for the same period last year. Return on assets (ROA) and return on equity (ROE) also dipped slightly, reflecting the added costs related to credit reserves.
One positive takeaway is the bank’s steady growth in assets. As of September 30, total assets stood at $519.9 million, up from $498.7 million at the end of 2023. That’s a 5.7% increase on an annualized basis. Loans also saw a nice bump, growing at a 4.9% annualized rate to reach $384.3 million. Deposits followed a similar trend, climbing by 6.2% to total $419.8 million.
Shareholder equity also improved, rising by $2.8 million to $49.2 million. This increase helped boost the book value per share to $20.46, up from $19.53 in the previous quarter. The total number of outstanding shares was reported at 2,403,696.
It’s worth noting that all share data reflects NIDB’s two-for-one stock split that took place in July 2023. That split doubled the number of shares while adjusting the price accordingly.
NIDB continues to operate from its headquarters in Huntington, Indiana, with a network of full-service branches across the region. The company remains focused on serving its customers and maintaining stability despite economic headwinds. While the earnings report showed some short-term challenges, the bank’s asset growth and stable deposits suggest it remains on solid footing.
Financial Health and Stability
For a bank of its size, NIDB maintains a reasonable financial position. It holds $14.48 million in cash, providing a liquidity cushion, but it also carries $41 million in total debt. While that might seem high at first glance, banks typically operate with significant leverage, so this isn’t necessarily a red flag.
Revenue growth is encouraging, up 10.6% year-over-year, while net income has grown even faster at 31.2%. These numbers suggest the bank is managing its balance sheet well and finding ways to expand profitability.
Book value per share is $20.14, which is higher than the current share price of $17.34. This means the stock is trading at a discount relative to its assets, which could indicate an opportunity for value-conscious investors.
Valuation and Stock Performance
From a valuation perspective, NIDB is trading at a P/E of 9.8, which is on the lower end for banks. The price-to-book ratio of 0.91 also suggests the stock is undervalued, at least based on its asset base.
In terms of stock performance, NIDB has been relatively stable, moving between $13.25 and $19.14 over the past year. Right now, at $17.34, it sits closer to the midpoint of that range. The 50-day moving average is $17.70, slightly above the current price, while the 200-day moving average is $16.76, pointing to a slow but steady uptrend.
One consideration for potential investors is liquidity. With an average daily trading volume of just 553 shares, this isn’t the kind of stock that large institutions are actively trading. That limited liquidity could make it harder to enter or exit a position quickly without impacting the share price.
Risks and Considerations
While NIDB has a lot going for it as a dividend stock, there are a few things to keep in mind before investing.
🔹 Micro-cap status: With a market cap of just $42 million, NIDB is significantly smaller than most publicly traded banks. This means it could be more volatile in a financial downturn.
🔹 Interest rate sensitivity: Like all banks, NIDB’s business is closely tied to interest rate movements. If rates decline, the bank’s lending margins could shrink, potentially impacting profitability.
🔹 Limited growth potential: As a small regional bank, NIDB doesn’t have the same expansion opportunities as larger financial institutions. Investors should view this as a steady income play rather than a high-growth stock.
🔹 Regulatory risks: Changes in banking regulations, capital requirements, or loan loss provisions could affect profitability, making this an area to watch.
Final Thoughts
For dividend investors looking for a smaller bank with a strong yield, Northeast Indiana Bancorp has a lot to offer. Its 4.15% dividend yield, low payout ratio, and history of reliable payments make it a compelling choice for those focused on income. The stock is trading at a reasonable valuation, and its steady financial performance suggests dividends are sustainable for the foreseeable future.
That said, the low liquidity and micro-cap nature of the stock mean it may not be suitable for every investor. Those comfortable with holding a long-term position in a regional bank, however, may find NIDB to be a solid addition to a dividend-focused portfolio.