

Updated 6/13/25
Morgan Stanley has steadily evolved into a more balanced financial powerhouse, shifting its focus from market-dependent trading toward fee-based businesses like wealth and asset management. The result is a more predictable earnings profile, strong cash generation, and a consistent dividend policy that income-focused investors can appreciate. With revenue up 16% year-over-year and net income climbing over 26%, the firm’s latest earnings confirm that its strategic pivot is delivering measurable results.
The stock has gained close to 40% over the past year, reflecting growing investor confidence. Management continues to execute on capital returns through disciplined buybacks and a sustainable payout ratio near 42%. With a forward yield of 2.8% and a healthy return on equity, Morgan Stanley combines income stability with solid long-term growth prospects—supported by strong leadership, a healthy balance sheet, and a long-term focus on digital innovation and client experience.
Recent Events
In the latest quarterly earnings release, covering Q1 2025, Morgan Stanley showed it’s running a tight ship. Revenues rose by over 16% compared to a year ago, reaching nearly $64 billion across the trailing twelve months. Net income rose even faster, with earnings up more than 26% year-over-year. That’s not the kind of performance you see from a firm that’s coasting—it’s active, focused, and delivering.
What’s fueling this? Primarily, wealth management. This segment continues to be a core driver, bringing in more than half of total revenue. Institutional business is holding up well too, thanks to a pickup in market activity and renewed deal flow. The overall return on equity sits around 13.88%, which is solid for a bank with Morgan Stanley’s scale and complexity.
On the balance sheet side, the firm holds more than $548 billion in cash and liquid assets. Even with over $449 billion in total debt, that level of liquidity gives it plenty of flexibility. For dividend investors, that’s a key piece of reassurance—the company has the financial firepower to maintain and grow its payout.
Key Dividend Metrics
💰 Forward Dividend Yield: 2.80%
🔁 5-Year Average Yield: 2.98%
📈 Dividend Growth (YoY): Solid and consistent
🧮 Payout Ratio: 42.5%
📆 Ex-Dividend Date: April 30, 2025
💳 Dividend Payment Date: May 15, 2025
Dividend Overview
At first glance, Morgan Stanley’s dividend yield might not turn heads. But scratch beneath the surface, and it starts to look a lot more attractive. The current yield of 2.80% is just a bit under its five-year average, mainly because the stock has climbed nearly 40% over the past year. That kind of move compresses the yield but speaks volumes about the market’s confidence in the business.
More important is the sustainability of that dividend. With a payout ratio under 43%, there’s plenty of room to grow the dividend or reinvest in other strategic areas. This isn’t a bank that’s stretching to pay shareholders—it’s doing it comfortably.
Morgan Stanley also has a long-standing habit of supplementing dividends with share repurchases. These buybacks help reduce share count and boost earnings per share, which can enhance the impact of future dividend increases. It’s another quiet but effective way of returning capital to investors.
Dividend Growth and Safety
If you’re looking for a dependable income stream that quietly gets stronger year after year, Morgan Stanley fits the bill. Over the past five years, the dividend has steadily climbed. It hasn’t been flashy, but it’s been reliable. That kind of growth is what builds confidence for income investors who are in it for the long haul.
The firm’s operating margins are strong—hovering around 37%—and its overall business model is built around resilience. By leaning heavily on wealth management, which brings in consistent fees, the bank is less exposed to the boom-and-bust cycle of investment banking. That’s a crucial factor when assessing the strength of future dividends.
With a book value per share of $60.41 and the stock trading near $130, Morgan Stanley isn’t cheap on a price-to-book basis. But that valuation reflects its profitability and capital discipline. It’s earning solid returns on shareholder equity and continues to invest in technology and client services across its divisions.
Short interest is minimal, and with a beta of 1.29, the stock tends to move with the market but doesn’t exhibit wild swings. For dividend investors, that mix of steadiness and upside potential is appealing. There’s comfort in knowing the company is in strong financial health and has a strategy built around long-term value creation—not just chasing quarterly numbers.
Morgan Stanley has emerged as a mature, reliable dividend payer. The yield might not be the highest on the street, but it’s backed by a business that’s built to endure—and that’s the kind of profile that often wins over patient, income-minded investors.
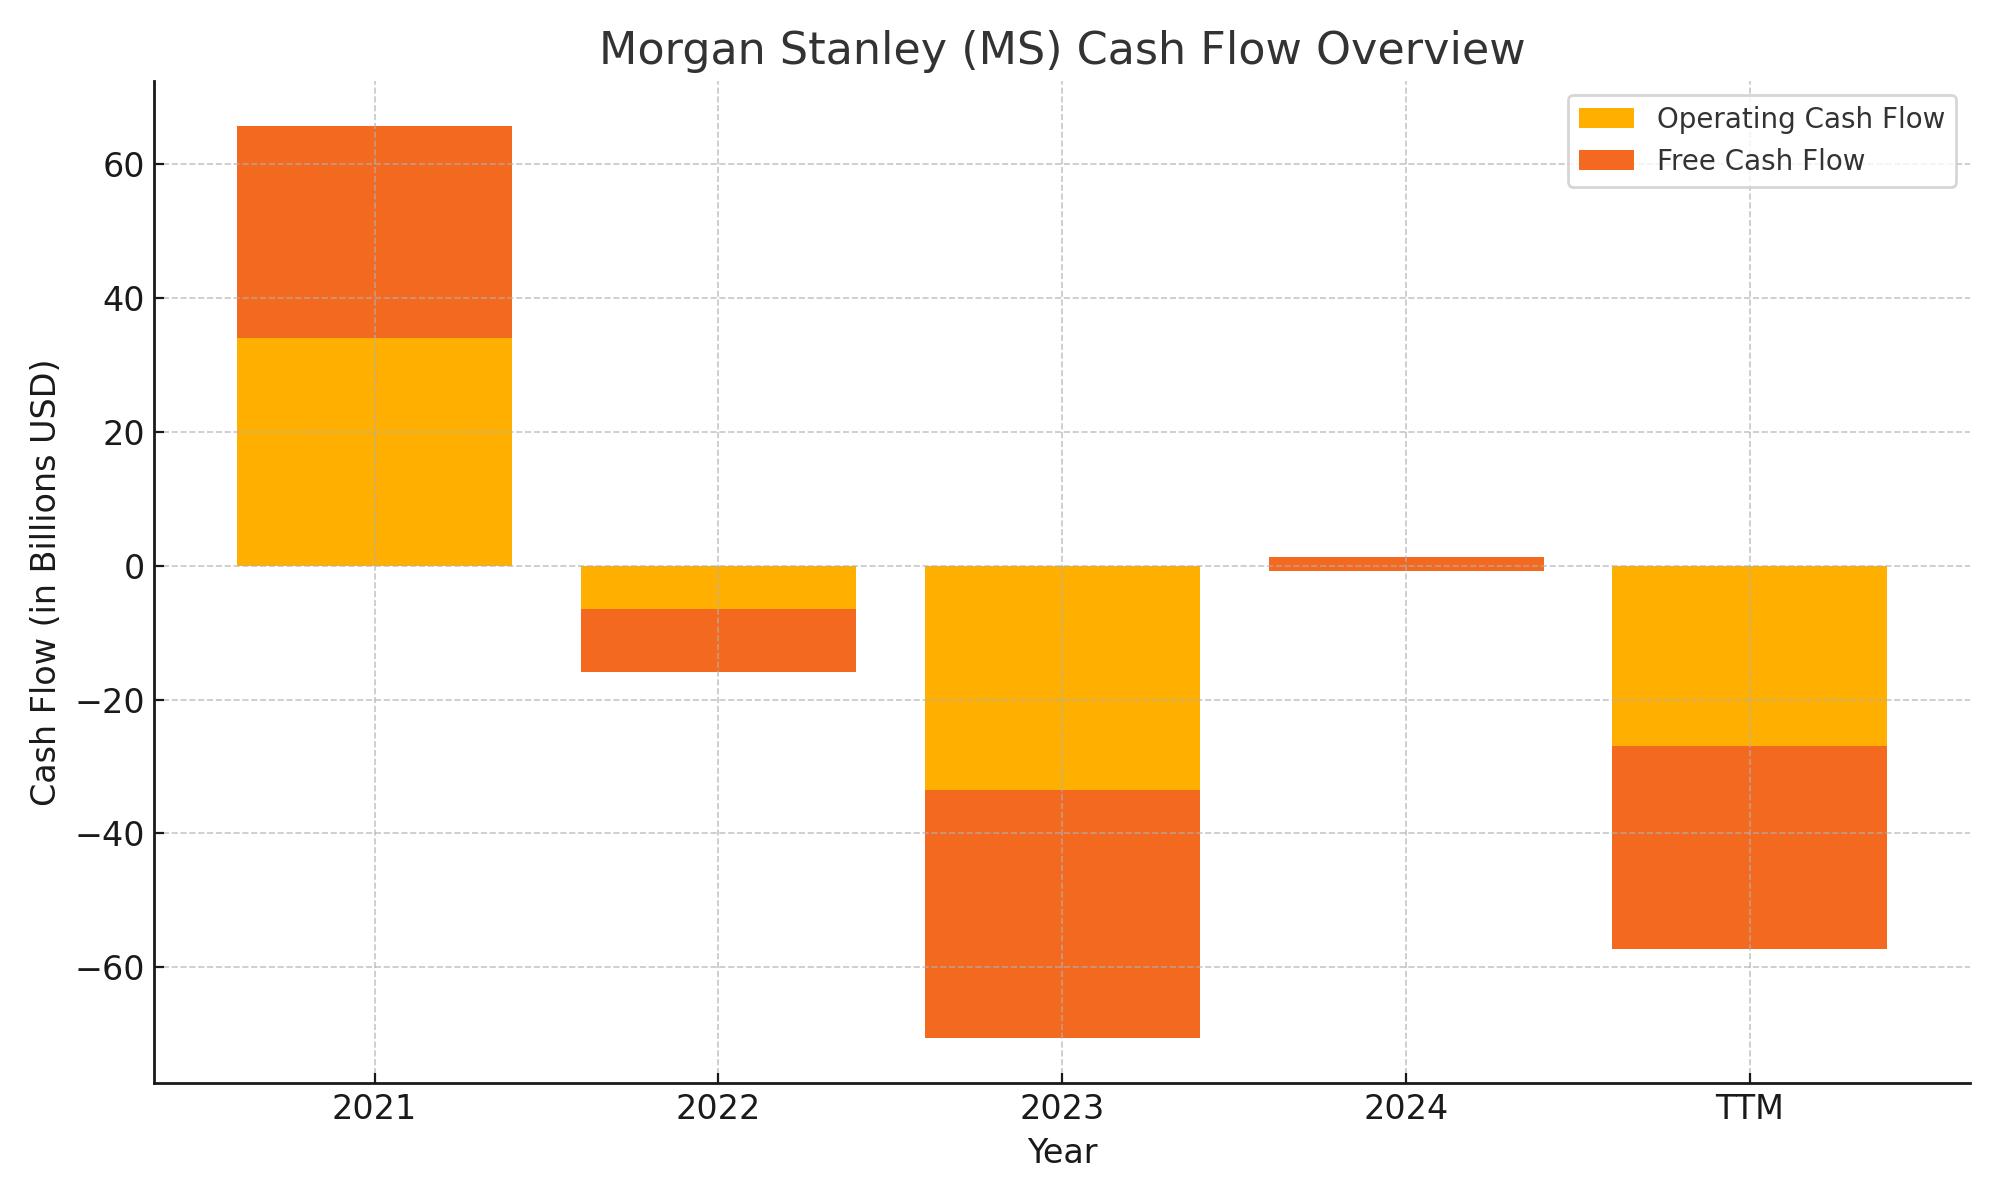
Cash Flow Statement
Morgan Stanley’s trailing twelve-month (TTM) cash flow shows some notable shifts that are worth attention. The firm reported negative operating cash flow of $27 billion over the TTM period, continuing a trend of volatile cash operations seen in prior years. In 2023, for example, it posted a deep operating cash outflow of $33.5 billion, though it had positive $1.36 billion by year-end. This level of fluctuation in core operations doesn’t necessarily point to business weakness—it’s often a reflection of the banking sector’s balance sheet mechanics and shifts in working capital—but it does highlight the importance of watching future quarters for stabilization.
On the financing side, the story is far more aggressive. Morgan Stanley generated nearly $51 billion in financing cash flow during the TTM, fueled largely by fresh debt issuance totaling over $112 billion. This was partially offset by $83 billion in repayments and $4.5 billion in share repurchases, indicating the firm is actively managing its capital structure. Investing activities remained negative at $35.5 billion, a sign the company continues to reinvest in its operations and subsidiaries. With a cash position still strong at $90.7 billion, liquidity remains more than adequate to support ongoing dividend payments and strategic flexibility.
Analyst Ratings
Morgan Stanley shares have been getting steady attention from Wall Street, with the overall sentiment landing around a neutral stance. Out of seventeen analysts covering the stock, eleven have rated it as a hold, six say it’s a buy, and one is calling it a strong buy. The average price target is currently set at $133, suggesting just a bit of upside from where the stock trades now. Targets range from a cautious $118 to a more bullish $156, highlighting a decent spread in analyst expectations.
Recently, there have been a few updates in analyst calls. Goldman Sachs reaffirmed a neutral view, pegging its target price near $136. The move reflects a wait-and-see attitude after Morgan Stanley’s quarterly numbers showed strength in wealth management but still left some questions on trading revenues. Wells Fargo was a bit more upbeat—upgrading the stock from underweight to neutral and raising its target to $142. Their reasoning? Clearer visibility into earnings and a stronger capital return trajectory. HSBC made a quieter move, inching its target from $128 to $131, citing stable fee income and improved return-on-equity metrics.
In general, analyst confidence in the stock seems to be rooted in Morgan Stanley’s solid shift toward more predictable, fee-based revenue. The market may not be pricing in aggressive upside, but there’s a common belief that the fundamentals are sound and shareholder returns are well-supported.
Earning Report Summary
A Quarter That Shows Morgan Stanley’s Strategy Is Working
Morgan Stanley’s latest earnings report came in strong, with the company showing it’s continuing to evolve in all the right ways. Revenue jumped by nearly 16% compared to last year, which caught a few eyes on the Street. The firm’s pivot toward more stable, fee-based income is clearly showing results. Wealth and asset management are now carrying the torch, delivering steady gains and a more predictable revenue stream quarter to quarter.
Trading and investment banking also added a nice boost, thanks to a more active capital markets environment. But even with those cyclical gains, the company’s real story is how it’s steadily built a foundation that doesn’t rely on market swings to grow. Leadership made it clear they’re focused on driving consistency and building long-term value—not chasing short-term wins.
Leadership’s Confidence Is Front and Center
From the top, the message was consistent: things are going according to plan. The CEO talked about the strength of their diversified model and how acquisitions like E*TRADE and Eaton Vance have helped deepen their capabilities. He pointed out that the integration is going well, and that they’re now able to offer more to clients while keeping a strong grip on costs.
Executives also took time to call out the firm’s return on equity, which came in at a healthy clip. That wasn’t just luck—leadership credited smarter capital deployment and strong discipline on expenses. The CFO shared that liquidity remains solid, and the company has plenty of flexibility to continue rewarding shareholders through buybacks and dividends.
A Look Toward What’s Next
As for the rest of the year, Morgan Stanley isn’t promising fireworks—but they’re not being overly cautious either. They expect momentum to continue in their core businesses, especially in wealth management, even if trading and banking slow down a bit. The team seems ready to adjust quickly to whatever the markets or economy throw their way.
They’re also keeping a close eye on efficiency. Operating leverage is improving, which means they’re growing revenue faster than expenses. That’s a great place to be. At the same time, they’re investing in digital tools and platforms that make the advisor and client experience smoother and more scalable.
Culture and People Are Still a Priority
One thing that stood out was how leadership spoke about their people. There’s a real focus on talent, especially in areas tied to client service and technology. Senior leaders sounded upbeat about how the firm is positioned—not just financially, but in terms of culture and client trust. That tone matters, especially when you’re building something meant to last.
All in all, this quarter gave investors a clear sense that Morgan Stanley is no longer just a traditional Wall Street firm. It’s building something broader, something steadier, and that comes through in both the numbers and the leadership’s tone.
Management Team
Leading Morgan Stanley is a leadership team that blends traditional Wall Street experience with a forward-looking strategy focused on stable, recurring revenue. The CEO has been vocal about transforming the firm into a more diversified financial services company. His style leans toward pragmatic execution, emphasizing long-term growth over short-term wins. The CFO complements this with a careful approach to capital allocation—keeping buybacks and dividends in check while funding innovation and digital expansion.
Management’s success integrating E*TRADE and Eaton Vance has been a recurring theme. By all accounts, the process has been smooth, with leadership emphasizing cross-functional collaboration and a unified client-first culture. There’s a clear push to empower advisors and build scalable platforms. Internally, the message is clear: Morgan Stanley isn’t just shifting its business model—it’s evolving its culture to be more agile, client-driven, and digitally enabled.
There’s also a growing emphasis on talent development and leadership succession. The firm appears to be investing in its future bench, especially in areas tied to technology and global wealth services. This is not a leadership team looking to stand still—they’re actively shaping Morgan Stanley’s future direction with discipline and consistency.
Valuation and Stock Performance
Over the last year, Morgan Stanley’s stock has climbed nearly 40 percent, reflecting growing investor confidence. At its current valuation, the price-to-book ratio sits around 2.2—above historical averages, but arguably justified given the shift toward more stable revenue and improved return on equity. The firm’s repositioning toward wealth and asset management continues to support that premium.
While the dividend yield currently stands near 2.8 percent, slightly below its five-year average, that drop is more a reflection of price appreciation than payout reduction. The yield may not be eye-popping, but the dividend is consistent and well-covered, which carries weight with income investors. The payout ratio hovers around 42 percent, giving the firm flexibility for future increases or reinvestment.
Analysts generally see the stock as fairly valued, with price targets clustered between $130 and $140. They point to earnings stability, cost control, and strong capital returns as reasons for optimism. Meanwhile, the company’s continued buyback activity should provide underlying support for per-share metrics.
Still, with the stock trading at a premium to book and above-average multiples compared to peers, there’s less margin for error. Investors will be watching closely for continued execution, especially in navigating macroeconomic shifts and keeping growth on track across key business segments.
Risks and Considerations
Morgan Stanley faces several risks worth noting. Market sensitivity remains a factor, particularly in trading and investment banking. A sharp downturn in capital markets or a prolonged period of low activity could weigh on those revenue lines, even if wealth management continues to perform steadily.
Regulation is another area to watch. Financial firms operate under a shifting landscape of capital and liquidity rules, and any tightening could pressure profitability. Leadership has been proactive in managing capital ratios, but regulatory surprises are part of the territory for large financial institutions.
The firm also faces integration risks. While the absorption of E*TRADE and Eaton Vance has gone well, there’s always the potential for cultural or operational friction over time. Keeping systems aligned and talent retained will be key as the company moves deeper into these markets.
Competition in wealth management is intensifying. Traditional banks, fintech startups, and registered investment advisor networks are all looking to attract high-net-worth clients. Morgan Stanley will need to continue innovating—especially in digital tools and client experience—to stay ahead of that curve.
Finally, valuation itself can be a double-edged sword. With the stock priced for continued strong performance, any stumble could lead to outsized downside. Investors will want to see continued earnings momentum and a steady hand from management to justify the premium.
Final Thoughts
Morgan Stanley has clearly moved beyond its roots as a pure investment bank. Today, it’s operating as a well-rounded financial services company, with a heavy tilt toward wealth and asset management. That transition is visible in the financials, the leadership’s tone, and the market’s response.
What’s appealing from a dividend investor’s standpoint is the predictability that now underpins the business. The payout is backed by recurring revenue, and capital returns are disciplined, not reactive. Even with the stock trading near highs, it’s being driven by solid fundamentals rather than speculative hype.
The road ahead will have its bumps—macroeconomic risks, regulatory complexity, and fierce competition are baked into this sector. But Morgan Stanley seems well-equipped to manage them. The strategy is clear, the execution has been consistent, and the leadership team shows no signs of slowing down.
For long-term income investors who value durability and steady capital return, Morgan Stanley offers a compelling mix. It’s a firm that’s building for the next decade, not just the next quarter, and doing so with the kind of structure and discipline that dividend-focused portfolios tend to favor.