

Key Takeaways
💸 Medtronic offers a 3.42% dividend yield with 48 consecutive years of increases, supported by a consistent dividend growth strategy and a payout ratio near 78%.
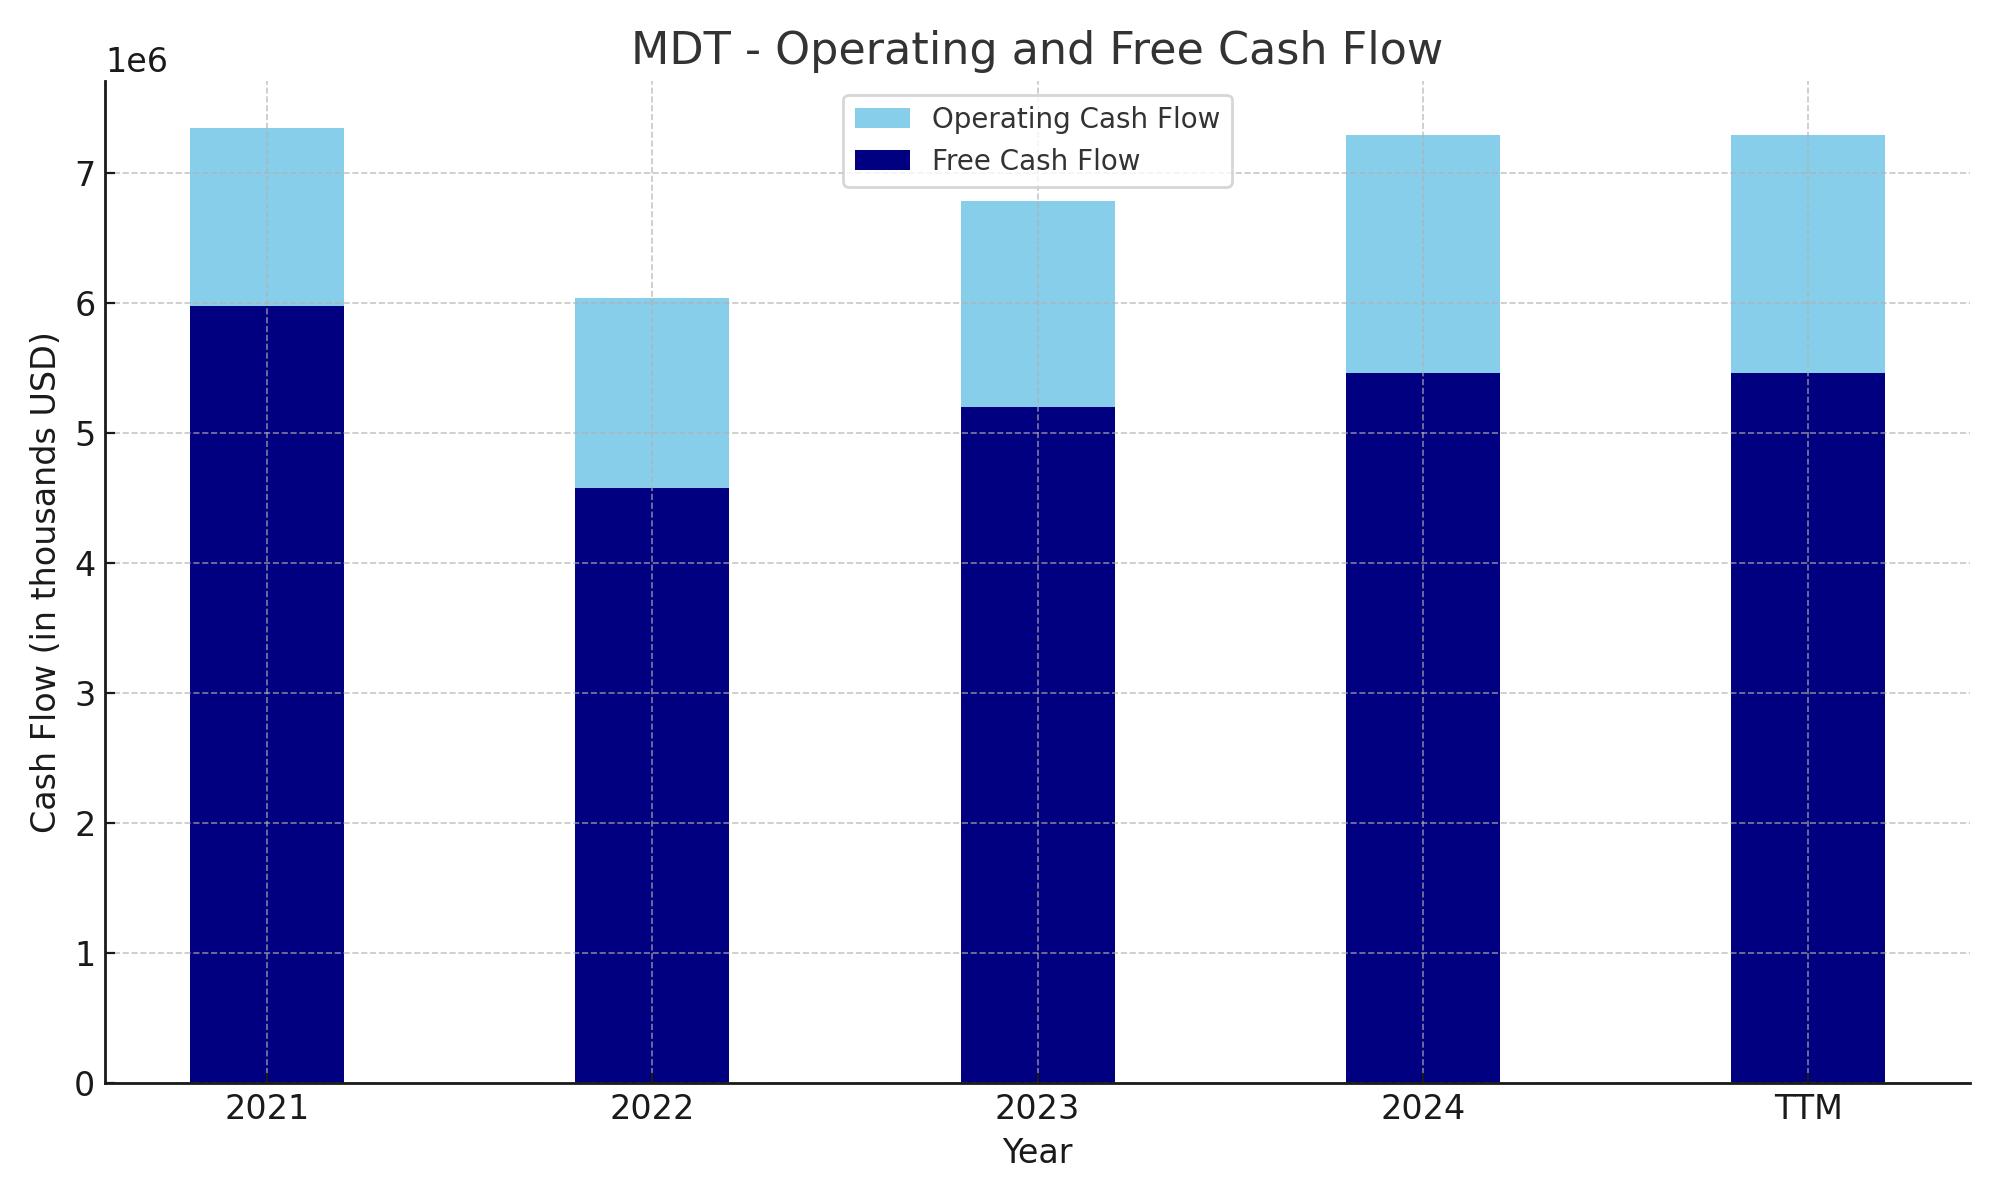
💼 Strong operating cash flow of $7.29 billion and free cash flow of $5.47 billion in the TTM provide solid coverage for dividends and future investment.
📊 Analysts show mixed sentiment with recent downgrades and upgrades; the consensus price target sits around $94, reflecting cautious optimism following a better-than-expected earnings report.
Updated 6/2/25
Medtronic plc (MDT), a global leader in medical technology, continues to stand firm on its long-standing reputation for consistency, innovation, and shareholder value. With a presence in over 150 countries, it operates across core segments like Cardiovascular, Neuroscience, and Medical Surgical, while its Diabetes business is now on track for a strategic spin-off. Backed by a leadership team with deep industry roots and a focus on operational improvement, the company is positioning itself for the next phase of growth.
For income-focused investors, Medtronic remains a compelling option. It offers a 3.42% dividend yield and has raised its payout for 48 consecutive years. Its financials show steady free cash flow generation, disciplined capital management, and a clear vision for long-term profitability. Even with challenges like product recalls and competitive pressure, Medtronic’s combination of stability and innovation continues to appeal to dividend-minded portfolios.
Recent Events
Medtronic has had a fairly eventful stretch recently. The company posted earnings that surpassed Wall Street expectations, and that helped lift some of the weight off its shoulders after a few quarters of sluggish sentiment. Revenue for the trailing twelve months clocked in at $33.5 billion, with a year-over-year bump of 3.9%. The real surprise was earnings, which climbed a solid 61.6% compared to last year. That jump signals the company is making headway on cost management and operational efficiency—something investors have been waiting to see.
Even in a capital-intensive sector like medical technology, Medtronic continues to generate strong free cash flow. It brought in $7.04 billion in operating cash flow and turned that into $4.73 billion of levered free cash flow. Not too shabby for a firm constantly funneling money into research and development.
The stock’s been moving in a pretty tight band lately, bouncing between $76 and $96 over the last year. It’s currently sitting at $82.98, slightly under the 50-day moving average of $84.82. It’s not a dramatic move by any means, but there’s some cautious optimism creeping back in. Investors may be starting to see a more stable path ahead after a rocky patch.
Key Dividend Metrics
💰 Forward Dividend Yield: 3.42%
📈 5-Year Average Yield: 2.79%
🔄 Payout Ratio: 77.56%
📅 Ex-Dividend Date: June 27, 2025
📤 Dividend Growth Streak: 46 consecutive years
📊 Forward Annual Dividend Rate: $2.84 per share
💵 Trailing Annual Dividend Rate: $2.80
💎 Dividend Date: July 11, 2025
Dividend Overview
For investors focused on income, Medtronic’s dividend continues to deliver in a big way. The current yield of 3.42% is noticeably above its five-year average, offering a compelling entry point for those looking for solid yield without venturing into riskier territory. That elevated yield isn’t just a side effect of price weakness—it reflects the company’s commitment to steady, long-term payouts.
With a payout ratio sitting at nearly 78%, it might raise eyebrows. But context matters. Medtronic has long maintained a disciplined approach to dividends, even when operating in an environment that demands heavy investment. That payout is backed by consistent cash flow and a business model rooted in long-term healthcare trends that don’t swing wildly with the economy.
The next dividend, set to hit accounts on July 11 for shareholders on record as of June 27, is another brick in a very long wall. Medtronic has raised its dividend every single year for 46 years. That kind of consistency doesn’t just happen—it’s a result of planning, execution, and a focus on returning value to shareholders no matter what the macro picture looks like.
Dividend Growth and Safety
Even though the payout ratio might look high on the surface, the story changes when you dig into the numbers. Medtronic’s free cash flow easily supports its dividend. That $4.73 billion in free cash flow over the last year covers the dividend comfortably, bringing the cash payout ratio down to a more reasonable level—closer to 60%.
Debt is always something to monitor in dividend-paying companies. Here, Medtronic’s total debt is $28.52 billion. But with nearly $9 billion in cash on hand and a current ratio of 1.85, liquidity doesn’t appear to be a concern. The debt-to-equity ratio is 59.09%, which, while elevated, is not out of step for a firm of this scale operating in this space. Add to that a beta of just 0.83, and you’re looking at a relatively low-volatility income generator.
When it comes to dividend growth, Medtronic hasn’t been aggressive lately—but that’s by design. The increases have been measured, aiming to balance shareholder returns with reinvestment in next-generation devices and platforms. Think surgical robotics, diabetes tech, and AI-driven diagnostics. These investments may limit short-term growth in the dividend, but they’re setting the stage for long-term expansion and durability.
The company’s approach has been remarkably consistent: modest annual bumps that show commitment without overextending. That might not excite the fast-money crowd, but for long-term income investors, it’s exactly the kind of reliable behavior that builds trust. Medtronic doesn’t need to make splashy moves to prove its worth—it just keeps doing what it’s always done: deliver steady growth, generate dependable cash flow, and reward shareholders for sticking around.
Cash Flow Statement
Medtronic’s trailing twelve-month (TTM) cash flow paints a picture of consistency in a capital-heavy industry. Operating cash flow reached $7.29 billion, climbing steadily from the prior year’s $6.79 billion. That improvement in core cash-generating ability underlines stronger operating efficiency and supports the company’s ability to fund dividends and strategic reinvestment. Free cash flow also saw a boost, coming in at $5.47 billion, up from $5.2 billion in the previous period, showing the company’s ability to convert earnings into usable capital even after accounting for $1.83 billion in capital expenditures.
On the financing side, the outflows continue to be notable. Medtronic returned significant capital to shareholders, with $4.59 billion used to repurchase stock and another $5.38 billion in overall financing outflows. While the company issued $3.27 billion in new debt, it continued paying down prior obligations and managing its balance sheet with discipline. The ending cash position landed at $1.4 billion, slightly up from last year’s $1.28 billion, suggesting stable liquidity despite large capital deployments. Overall, the cash flow profile reflects a business that’s tightly managed, capable of meeting its obligations, and still investing in future growth while maintaining shareholder returns.
Analyst Ratings
Medtronic has experienced a mix of analyst sentiment recently, with several firms adjusting their ratings and price targets. 📉 Stifel downgraded the stock from Buy to Hold, trimming the price target from $100 to $85. Their reasoning pointed to concerns over near-term growth potential and uncertainty around how quickly new product launches would translate into revenue. This more cautious tone reflects a wait-and-see approach, especially as Medtronic navigates regulatory timelines and execution risks in certain business segments.
📉 Another downgrade came from Wall Street Zen, which also shifted its rating from Buy to Hold. The firm highlighted modest top-line growth and near-term headwinds, such as cost pressures and operational realignments. While they acknowledged Medtronic’s long-term positioning, the downgrade signals a belief that the stock may remain range-bound until clearer signs of acceleration appear.
📈 On a more positive note, Citigroup moved in the opposite direction, upgrading Medtronic from Neutral to Buy and raising its price target to $107. The analysts behind that call emphasized confidence in the company’s expanding product pipeline and cost-cutting efforts. They see signs of operational improvement and believe the current share price underappreciates upcoming catalysts in diabetes and surgical robotics.
📊 RBC Capital, meanwhile, held its Outperform rating but made a slight adjustment to its target, lowering it from $105 to $101. This revision appears to be more about valuation fine-tuning than a shift in outlook. RBC still sees meaningful upside, especially as Medtronic continues stabilizing its core segments.
🎯 Across the board, the consensus price target for Medtronic now sits around $97. That average reflects cautious optimism—analysts appear aligned in their belief that Medtronic is a fundamentally strong company, but the timeline for clear growth traction remains a bit cloudy in the near term.
Earning Report Summary
Strong Finish to the Fiscal Year
Medtronic wrapped up its fiscal year on a solid note, delivering a fourth-quarter performance that turned a few heads. Revenue reached $8.93 billion, a 3.9% lift compared to the same quarter last year. Earnings per share came in at $1.62, marking an 11% increase, comfortably ahead of expectations. Net income jumped sharply to $1.06 billion—up over 60% year-over-year. That’s not something you see every day from a mature medical device giant.
Much of the momentum came from the Cardiovascular unit, which brought in $3.34 billion in revenue. That’s a healthy 6.6% gain, and within that segment, Cardiac Ablation Solutions really stood out with growth close to 30%, thanks to growing interest in its pulsed field ablation technology. Neuroscience also played its part, bringing in $2.62 billion and logging a near 3% increase. Meanwhile, the Diabetes business continued its turnaround story, posting a 10.4% revenue gain—its sixth straight quarter of double-digit growth.
Strategic Shifts on the Horizon
In a move that had been anticipated by some, Medtronic announced it plans to spin off its Diabetes business into a standalone public company. The goal here is clear: give that unit the freedom to move quicker and focus more narrowly, while Medtronic zeroes in on its larger, more strategic areas—namely Cardiovascular, Neuroscience, and Medical Surgical.
Looking to the next fiscal year, the company expects to grow revenue organically by about 5%. Adjusted earnings are projected to land between $5.50 and $5.60 per share. Leadership also acknowledged that tariffs could bite into profits, with potential added costs of up to $950 million. To blunt that impact, they’re working on supply chain tweaks and cost-saving strategies across the board.
Confidence from the Top
CEO Geoff Martha didn’t hold back his optimism. He said the company is hitting an inflection point and believes the pieces are in place for Medtronic to accelerate both growth and margin expansion. He pointed to stronger fundamentals and renewed momentum in key business drivers as reasons for confidence heading into the next year.
The board also approved a dividend hike to $0.71 per share for the upcoming quarter. That marks 48 straight years of dividend increases—something not many companies can claim. It’s a signal that despite all the moving parts, the company still sees long-term strength in its cash flows and remains committed to returning value to shareholders.
Management Team
Medtronic’s leadership is anchored by Chairman and CEO Geoff Martha, who took the reins in 2020. Under his direction, the company has sharpened its focus on operational efficiency and doubled down on innovation in high-growth areas. He’s led initiatives to streamline the organization while advancing Medtronic’s product pipeline and driving cultural transformation. Supporting him is CFO Thierry Piéton, whose background in finance and operational leadership is helping guide the company through margin expansion efforts and capital discipline.
The broader executive team is made up of leaders with deep experience in the healthcare space. Que Dallara, who heads the Diabetes Operating Unit, has overseen a division that’s been regaining momentum and is now preparing for a full spin-off. Sean Salmon continues to lead the Cardiovascular group, and Brett Wall is responsible for Neuroscience. Each brings a unique blend of industry insight and technical expertise, ensuring each business segment is aligned with the company’s strategic goals. Together, this team has built a cohesive vision focused on long-term performance and patient outcomes.
Valuation and Stock Performance
At $82.98, Medtronic’s stock has been hovering in a tight band over the past year, with a low of $75.96 and a high of $96.25. The current share price places it below both the 50- and 200-day moving averages, which might indicate a consolidation phase. Analysts have landed on a consensus price target around $94 to $95, suggesting a potential upside from current levels. Some even see more room to run if execution on recent initiatives improves and margin expansion materializes.
Valuation-wise, the company trades at a trailing P/E ratio of 22.99 and a forward P/E around 14.9. That forward-looking number hints at anticipated earnings growth and makes the stock look attractive compared to peers in the large-cap medtech space. Medtronic’s price-to-sales ratio of just over 3 and price-to-book ratio around 2.2 are in line with historical norms, signaling that it’s reasonably priced given its size, stability, and market position.
The stock’s performance has been a mixed bag, influenced by macroeconomic conditions, regulatory developments, and company-specific news. But for investors taking the long view, it still presents a blend of stability and dependable dividend income.
Risks and Considerations
Like any global healthcare company, Medtronic comes with its share of risk. Product recalls, such as those involving insulin pumps and certain surgical devices, serve as a reminder that quality and safety are always front and center in this business. These issues can impact not only short-term sales but also long-term brand trust.
Then there’s the upcoming spin-off of the Diabetes unit. While the move could unlock value over time, transitions like this bring complexity. Investors will need to evaluate each entity’s ability to stand on its own, especially when it comes to revenue growth and profitability. Competition in the medtech space remains fierce, and with innovation cycles speeding up, the pressure is on to consistently deliver market-leading solutions.
Other headwinds include regulatory shifts, particularly in reimbursement policies and international compliance. Currency fluctuations also remain a concern given Medtronic’s sizable non-US revenue base. And with inflation and interest rates still shaping cost structures and capital allocation, these macro forces can’t be ignored.
Final Thoughts
Medtronic continues to stand out as a steady presence in the ever-evolving healthcare sector. The leadership team has laid out a clear strategy centered on high-growth segments, operational improvement, and a disciplined approach to capital deployment. While the road ahead includes challenges—especially as the company navigates a major structural shift with the diabetes spin-off—it also holds plenty of opportunity.
The company’s ability to generate strong cash flow, support a rising dividend, and maintain a solid balance sheet adds to its appeal for long-term investors. For those looking for a mix of income, defensive sector exposure, and innovation-led growth, Medtronic still deserves a place in the conversation.