

Key Takeaways
💰 Solid dividend yield of 2.85% with 21 consecutive years of growth and a sustainable payout ratio.
💵 Robust cash flow with $6.75 billion operating and $5.22 billion free cash flow, supporting dividends and buybacks.
📈 Analysts hold a moderately bullish view, with a consensus price target around $545 indicating upside potential.
📊 Recent quarterly earnings beat expectations, driven by strength in missile systems and steady aeronautics performance.
👔 Experienced management team led by CEO Jim Taiclet, emphasizing innovation, operational discipline, and digital transformation.
Last Update 4/24/25
Lockheed Martin (LMT) remains one of the most dependable players in the defense and aerospace space, backed by a long history of government contracts and global demand for its advanced technologies. With flagship programs like the F-35 and strong performance across missile systems and mission solutions, the company continues to generate solid cash flow and return capital to shareholders.
A consistent dividend grower for over two decades, Lockheed also boasts a leadership team focused on innovation and digital transformation. Despite some stock price volatility over the past year, its fundamentals remain intact, with analysts projecting steady growth and a consensus price target near $530. As the company navigates industry risks—from regulatory oversight to evolving defense priorities—it’s also positioning itself for the next generation of aerospace advancement through strategic R&D investments and operational efficiency.
Recent Events
Lockheed Martin has been making steady progress lately, reporting solid earnings that show the business isn’t losing a step. Revenue saw a 4.5% bump compared to last year, and earnings ticked up almost 11%. For a defense giant of this scale, that kind of growth is nothing to shrug at. It signals operational discipline and a customer base that keeps coming back.
Profitability remains healthy. With operating margins sitting at 12.14% and net margins at 7.66%, the company is still squeezing out solid returns from its massive government contracts. It’s not just about winning big deals—it’s about making those deals pay off.
What really stands out, though, is the cash flow. Lockheed pulled in $6.75 billion in operating cash over the last 12 months and kept $5.22 billion of that as free cash flow. That’s not just solid—it’s the kind of cushion that makes dividend investors breathe easy.
While Lockheed’s share price hasn’t exactly lit up the board this past year—slipping slightly even as the broader market moved higher—it doesn’t signal trouble. For income-focused investors, that dip might even look appealing. Especially when the fundamentals are this firm.
Key Dividend Metrics
📈 Forward Yield: 2.85%
💸 Forward Annual Dividend: $13.20 per share
📅 Most Recent Dividend Date: March 28, 2025
📆 Ex-Dividend Date: March 3, 2025
💰 Payout Ratio: 55.60%
📊 5-Year Average Yield: 2.64%
📈 Dividend Growth Streak: 21 consecutive years
🛡️ Free Cash Flow Payout Coverage: Strong (~40%)
Dividend Overview
For anyone building an income-focused portfolio, Lockheed Martin has a lot going for it. The stock currently offers a 2.85% yield—slightly above its average over the past five years. That might not jump off the page at first glance, but the strength lies in the consistency and quality of the payout.
With an annual dividend of $13.20 per share and a payout ratio just over 55%, Lockheed is playing it smart. They’re not overextending to juice the yield, nor are they holding back unnecessarily. The dividend is clearly a priority, but it’s managed with care.
And then there’s the free cash flow story. Covering the dividend at about 40% of free cash flow means there’s room to navigate. Lockheed’s contracts are long-term, often multi-year commitments from governments that aren’t likely to disappear overnight. That makes the cash stream predictable, which is gold for dividend reliability.
The business model helps here. With programs like the F-35 and missile defense systems, Lockheed isn’t chasing trends—it’s embedded in essential military operations around the world. That kind of dependability supports not just the current yield but future raises, too.
Dividend Growth and Safety
This is where Lockheed Martin really separates itself. The company has raised its dividend every year for the last 21 years. That consistency sends a clear message: management is committed to rewarding shareholders over the long haul.
And these aren’t token increases either. The raises have typically landed in the 6% to 10% range, offering a blend of income and growth that’s hard to beat in the large-cap space. For investors reinvesting those dividends, the compounding effect adds up fast.
Debt is one area to keep an eye on. With a total debt-to-equity ratio above 300%, Lockheed is carrying a heavier load than some might prefer. But given the reliability of its cash flows and the low volatility of the stock (beta of just 0.39), that leverage isn’t alarming—at least not yet.
What really matters is the dividend safety, and Lockheed scores well there. Coverage from both earnings and free cash flow gives it plenty of breathing room, even with other capital demands on the table. And because the company operates in a sector where sudden demand shifts are rare, the payout looks well-protected.
For income investors who value consistency over flash, Lockheed Martin checks the boxes. This isn’t a stock that’s trying to reinvent the wheel. It’s a solid, mature business that understands its role—and it keeps showing up, quarter after quarter, to deliver.
Cash Flow Statement
Lockheed Martin’s trailing twelve-month cash flow data reflects a steady, if slightly contracting, operational base. Operating cash flow came in at $6.75 billion, a modest step down from the previous year’s $6.97 billion and well below earlier highs above $9 billion. This trend suggests a normalization following peak pandemic-era spending but still places Lockheed in a strong position to fund dividends and reinvestment. Capital expenditures remained consistent at just over $1.76 billion, leading to a solid free cash flow figure of nearly $5 billion—ample support for shareholder returns.
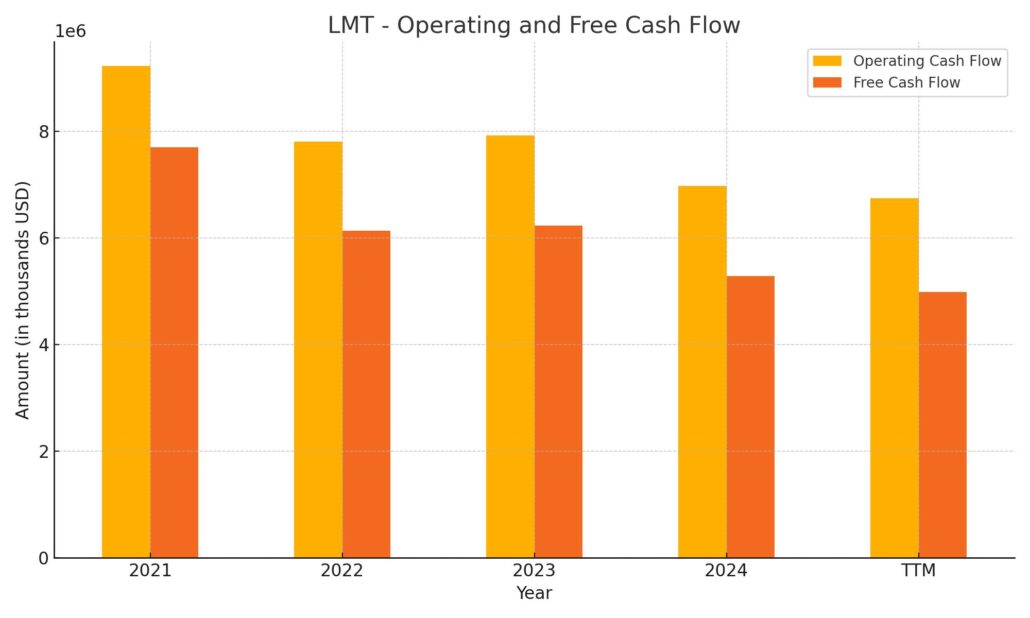
On the financing side, the company leaned heavily on buybacks, repurchasing $3.45 billion of stock. Debt activity was mixed, with $990 million in issuances but no reported repayments for the period. This selective borrowing helped offset reduced cash reserves, which ended at $1.8 billion—down from $2.48 billion the prior year. Despite a sizable outflow from financing, the overall cash picture remains well managed, with free cash flow more than covering capital distributions. This cash flow profile continues to support Lockheed’s dependable dividend and its broader financial flexibility.
Analyst Ratings
Lockheed Martin has seen a mix of analyst activity recently, reflecting varied perspectives on its future performance. 🟢 Baird upgraded the stock from Neutral to Outperform, maintaining a price target of $540. This upgrade was driven by confidence in the company’s strong margins and reaffirmed guidance. 🛫 Similarly, Morgan Stanley raised its rating to Overweight with a price target of $575, citing robust fundamentals and a favorable outlook for its defense contracts and long-term cash flow stability.
🔻 On the other hand, RBC Capital downgraded Lockheed Martin from Outperform to Sector Perform, adjusting the price target to $480 from $550. This downgrade was attributed to concerns over valuation and potential headwinds in the defense sector as budget allocations become more scrutinized. UBS held its Neutral stance but nudged its target price up to $499, acknowledging Lockheed’s strong quarterly results and consistent performance in key defense programs.
📊 The consensus among analysts places the average 12-month price target for Lockheed Martin at approximately $544.79, suggesting a moderate upside from current levels. This average reflects a wide range of sentiment, with targets stretching from a cautious $418 to an optimistic $704, underlining the varying degrees of confidence in the company’s growth trajectory and valuation sustainability.
Earning Report Summary
Lockheed Martin kicked off 2025 with a solid first quarter, showing investors it’s still a steady hand in the defense world. Revenue came in at $17.96 billion, up 4.5% from the same period last year. Earnings hit $1.71 billion, or $7.28 per share, which edged out expectations and gave a clear signal that demand remains strong across its major programs.
Strong Segments Leading the Way
The Aeronautics division, which includes the high-profile F-35 fighter jet, grew sales by just over 3%. While the program had a few bumps—mostly technical holdups—interest in the jet remains strong both domestically and internationally. The real star of the quarter, though, was the Missiles and Fire Control business. It posted a 13% jump in revenue, thanks to growing demand for strike and tactical missile systems. Rotary and Mission Systems also saw some healthy growth, up about 6%, showing continued strength in shipboard and radar systems. The only soft spot was the Space segment, which saw a slight decline.
On the cash front, Lockheed pulled in $955 million in free cash flow for the quarter. That’s a step down from the $1.3 billion recorded in the same period last year, mostly due to timing of payments and a bit more spending on key projects. Still, the company didn’t hold back when it came to rewarding shareholders—returning $1.5 billion through dividends and stock buybacks. That kind of consistency is what long-term investors tend to appreciate.
What Leadership Had to Say
CEO Jim Taiclet shared some insight into where things are heading. He talked about how Lockheed is looking to evolve its fighter jet capabilities, hinting that they’re aiming to build about 80% of the next-generation fighter’s performance using tech already developed for the Next Generation Air Dominance program—but at half the cost. That kind of talk keeps the narrative moving from just defense spending to innovation and long-term positioning.
Looking Ahead
Lockheed Martin didn’t shake up its full-year forecast. The company still expects total sales for 2025 to fall between $73.75 billion and $74.75 billion. They’re guiding for mid-single-digit growth in revenue and expecting free cash flow to climb at a high-single-digit pace. As far as the F-35 program goes, they’re aiming to deliver between 170 and 190 jets this year, with a hefty backlog of around 360 still to work through.
All in all, it’s the kind of quarter that keeps investors steady—not flashy, but focused and dependable. And in a sector where consistency is everything, that goes a long way.
Chart Analysis
Price Trend and Moving Averages
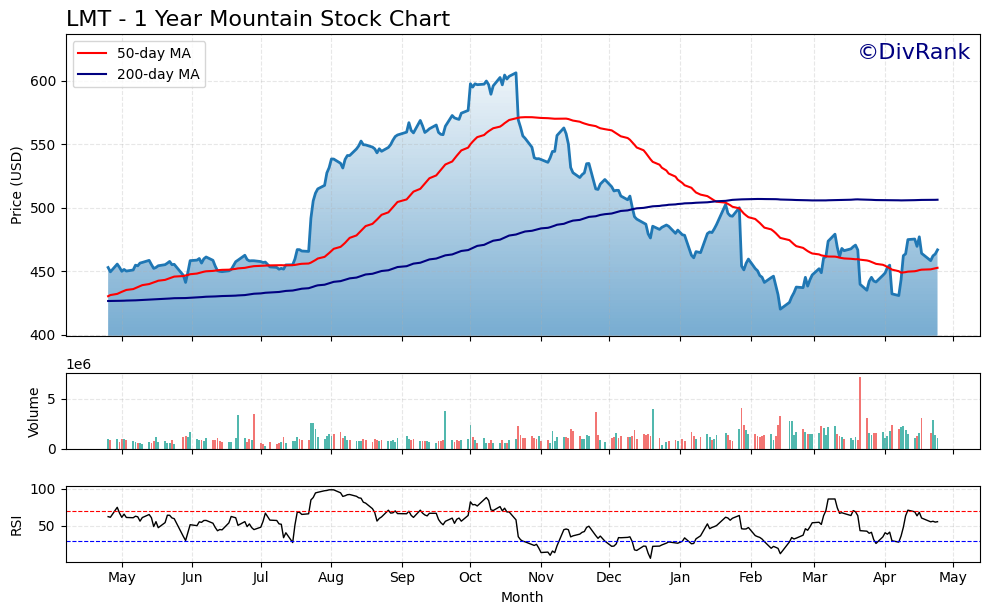
LMT has had an eventful year, and the chart shows it clearly. The price climbed steadily through mid-2023, breaking above the $600 mark in the fall. But after that peak, it took a sharp turn lower, with the 50-day moving average crossing below the 200-day moving average early in the new year—a classic bearish signal that usually reflects a shift in momentum. The price has struggled to find consistent direction since, hovering in the mid-$450s to $480 range.
What stands out now is how the 50-day average is starting to curl upward again, suggesting some near-term support may be building. The 200-day line, meanwhile, has flattened out, reflecting the tug-of-war between buyers and sellers. This kind of setup can sometimes mark the early stages of a longer stabilization, though confirmation still feels a few weeks away.
Volume and Market Activity
Volume has been relatively steady, with a few notable spikes—especially during the sharp pullbacks and brief recoveries. These higher-volume sessions tend to cluster around price inflection points, indicating investor sensitivity to valuation changes. None of the volume surges appear to signal panic selling, which suggests that the recent dip has been met with interest rather than fear.
There’s no clear accumulation phase showing yet, but the lack of heavy selling pressure can be encouraging. It’s the kind of action that often reflects a wait-and-see mood from institutions or steady reinvestment.
Relative Strength Index (RSI)
The RSI has bounced between oversold and neutral levels for much of the year. During the late 2023 downtrend, it spent significant time below 30, showing clear weakness. But since February, it has mostly held above that threshold, with a few trips into the 60–70 range. Most recently, it looks like the RSI is edging higher again—still below overbought territory but showing a bit more life.
That RSI movement, paired with a stabilizing price and an uptick in the shorter moving average, hints at a stock that may be trying to find its footing. It’s not roaring back, but it’s not breaking down either.
Management Team
Lockheed Martin’s leadership team is led by Jim Taiclet, who has served as Chairman, President, and CEO since 2020. He’s kept the company focused on both innovation and operational strength during a time of global uncertainty. Supporting him is Frank St. John, the Chief Operating Officer, whose day-to-day oversight keeps the business aligned with strategic objectives and ensures execution across its massive portfolio.
Jay Malave, the CFO, is responsible for maintaining Lockheed’s financial discipline. His role in managing capital allocation, forecasting, and cash flow has helped the company stay nimble and investor-friendly, even in a rising interest rate environment. Tim Cahill, who heads the Missiles and Fire Control division, and Stephanie C. Hill, leading Rotary and Mission Systems, each bring deep domain knowledge to their respective segments.
Lockheed has also made digital transformation a key focus, with Maria Demaree guiding enterprise business and innovation initiatives. John Clark, overseeing strategic tech development, plays a critical role in future-proofing the company’s capabilities, while Anthony DeSimone ensures engineering rigor across programs. Together, this is a leadership group that balances defense industry expertise with forward-looking vision.
Valuation and Stock Performance
Lockheed Martin’s stock has had a volatile ride over the past year, but the underlying valuation remains grounded. With a trailing P/E ratio around 19.9, it’s trading at a level that reflects consistent earnings power without straying into overvalued territory. It isn’t trading at a deep discount, but it’s not priced for perfection either—there’s room for upside if execution continues to hold.
The average analyst price target sits just under $530, which implies modest appreciation from recent levels. That target reflects stable fundamentals, steady earnings, and reliable cash flow. Some firms have taken a more bullish view, raising their targets on expectations for continued demand in defense and aerospace, particularly given the geopolitical landscape and ongoing investment in advanced weapons systems.
Despite some bumps along the way, the stock has found support around the mid-$450s after retreating from its peak. It’s shown resilience, and while it hasn’t snapped back to its previous highs, it’s also avoided deeper losses. The 50-day moving average has started to turn upward again, hinting at a potential base forming.
Risks and Considerations
There are real-world risks investors need to consider when it comes to Lockheed Martin. Regulatory and legal factors remain front and center. With the company heavily reliant on government contracts, any shifts in budget priorities or policy directions can have material impacts. There’s also the risk of cost overruns, especially on large-scale programs like the F-35, which has faced periodic scrutiny.
International exposure brings opportunity but also volatility. Geopolitical instability, export regulations, or shifts in foreign relations could limit growth in overseas contracts. On the domestic side, competition has increased, especially after the Next Generation Air Dominance contract was awarded elsewhere, which could limit future wins in next-gen fighter aircraft.
The company is also not immune to growing ESG concerns. Environmental regulations, sustainability reporting expectations, and broader social governance issues could add layers of complexity that weren’t as prominent in decades past.
Final Thoughts
Lockheed Martin stands out as a mature, disciplined company operating in one of the most complex industries in the world. Its deep backlog, long-term contracts, and global demand offer a level of visibility many other businesses can’t match. Even in uncertain times, the company continues to produce consistent results, return capital to shareholders, and invest in future technologies.
There are headwinds to be aware of, from regulatory risks to competitive threats, but Lockheed’s leadership appears focused on adapting to those realities rather than reacting to them. It’s a company that values long-term stability over short-term flair, and that attitude is reflected in how it operates, innovates, and allocates capital.