

Key Takeaways
📈 Dividend Yield and Growth: Kimberly-Clark offers a reliable 3.78% yield with consistent annual dividend increases.
💰 Cash Flow: Strong free cash flow of $2.39 billion comfortably covers dividend payouts despite recent revenue pressures.
📊 Analyst Ratings: Analysts remain cautious but positive, averaging a “Hold” with a consensus target price of $145.83.
📝 Earnings Report Summary: Q1 revenue declined 6%, though EPS slightly exceeded estimates at $1.93 amid cost and tariff challenges.
👥 Management Team: CEO Mike Hsu emphasizes margin management, operational efficiency, and brand innovation.
Last Update 4/24/25
Kimberly-Clark (KMB) operates at the core of everyday essentials, with globally recognized brands like Huggies, Kleenex, and Scott forming the backbone of its business. With operations in over 175 countries and a beta of 0.39, the stock reflects stability, while its 3.78% forward dividend yield and history of consistent payouts appeal to income-focused investors. Recent quarters have brought challenges, from a 6% year-over-year revenue decline to new tariff-related costs and FX headwinds, yet the company continues to generate strong free cash flow and maintain disciplined capital management.
Leadership, under CEO Mike Hsu, is focused on margin control, operational efficiency, and long-term brand strength. The stock trades around $133, near the midpoint of its 52-week range, with analysts targeting a 12-month consensus price of $145.83. Amid short-term pressures, Kimberly-Clark’s strategy is grounded in resilience, cash generation, and a clear focus on shareholder returns.
Recent Events
Kimberly-Clark has had a bit of a challenging run lately, reflecting some of the same headwinds facing much of the consumer staples sector. Revenue over the past year hit $19.75 billion, which is respectable, but the pace has slowed—quarterly revenue dipped by 6% year over year. That’s a notable pullback, and it’s paired with a 12% drop in quarterly earnings growth. Not exactly the momentum investors love to see.
Still, the business isn’t stumbling; it’s adapting. Higher costs for materials, freight, and labor continue to squeeze margins, and currency fluctuations are adding their own layer of noise to the top line. Yet, even with those pressures, Kimberly-Clark’s operating margin is close to 17% and profit margin is holding above 12%. These aren’t signs of a company in trouble—they’re the marks of a business that knows how to weather rough patches.
Return on equity sits sky-high above 200%, though that’s inflated by a substantial amount of leverage. Debt-to-equity is pushing near 600%, so the capital structure is carrying some weight. That level of debt isn’t unusual for large, stable consumer brands, but it’s something to factor in, especially with interest rates higher than they’ve been in a long while.
Key Dividend Metrics
🧾 Forward Dividend Yield: 3.78%
💸 Annual Dividend Payout: $5.04 per share
📆 Dividend Payment Date: April 2, 2025
🚫 Ex-Dividend Date: March 7, 2025
📈 5-Year Average Dividend Yield: 3.43%
🔄 Payout Ratio: 67.03%
🧮 Free Cash Flow (ttm): $2.05 billion
These figures paint the picture of a solid dividend stock—not the highest yield in the market, but consistent and backed by healthy cash flows.
Dividend Overview
Kimberly-Clark has long been a go-to name for investors who value stability and income over flashy growth stories. It’s been paying dividends for decades without interruption, which puts it in rare company. The current yield sits around 3.78%, which is actually a bit above its five-year average. That could be read as a value signal for yield seekers or just a function of the recent stock price softness.
What really matters, though, is how well the dividend is covered. And here, Kimberly-Clark still looks pretty solid. With over $3 billion in operating cash flow and $2 billion in free cash flow, the company has the breathing room to keep those payments coming without breaking a sweat. The payout ratio at 67% is on the high side, but not alarmingly so—especially for a business that deals in everyday essentials.
The market might not be thrilled with the company’s recent growth metrics, but for income investors, consistency in payout is often more important than year-over-year sales bumps.
Dividend Growth and Safety
Kimberly-Clark isn’t going to wow anyone with massive dividend hikes, but that’s not what investors here are looking for. Over the past five years, dividend growth has averaged just over 3% annually. That kind of slow-and-steady approach tends to win with long-term income-focused portfolios. It’s not aggressive, but it is predictable—and predictability is valuable, especially when volatility is the backdrop.
Safety-wise, the dividend looks well-supported for now. The company still generates more than enough cash to fund it, and there’s been no indication that the board plans to change course. While the high debt load does introduce some risk, Kimberly-Clark has navigated similar territory before. The balance between debt, cash flow, and dividend obligations is being managed carefully.
And when you step back and look at the broader picture—low beta, sticky product demand, a healthy yield—it’s easy to see why KMB remains a mainstay in so many dividend portfolios. The excitement may be elsewhere in the market, but the quiet consistency of this stock is its own kind of strength.
Cash Flow Statement
Kimberly-Clark generated $3.12 billion in operating cash flow over the trailing twelve months, showing stable cash generation despite a slower revenue environment. This figure is slightly below the previous year’s $3.23 billion but still comfortably supports the company’s dividend payments and capital spending. Free cash flow came in at $2.39 billion, driven by lower capital expenditures of $731 million, suggesting the company is maintaining discipline with its reinvestment strategy. The company continues to produce more than enough cash to cover its dividend obligations, keeping its payout ratio manageable from a cash perspective.
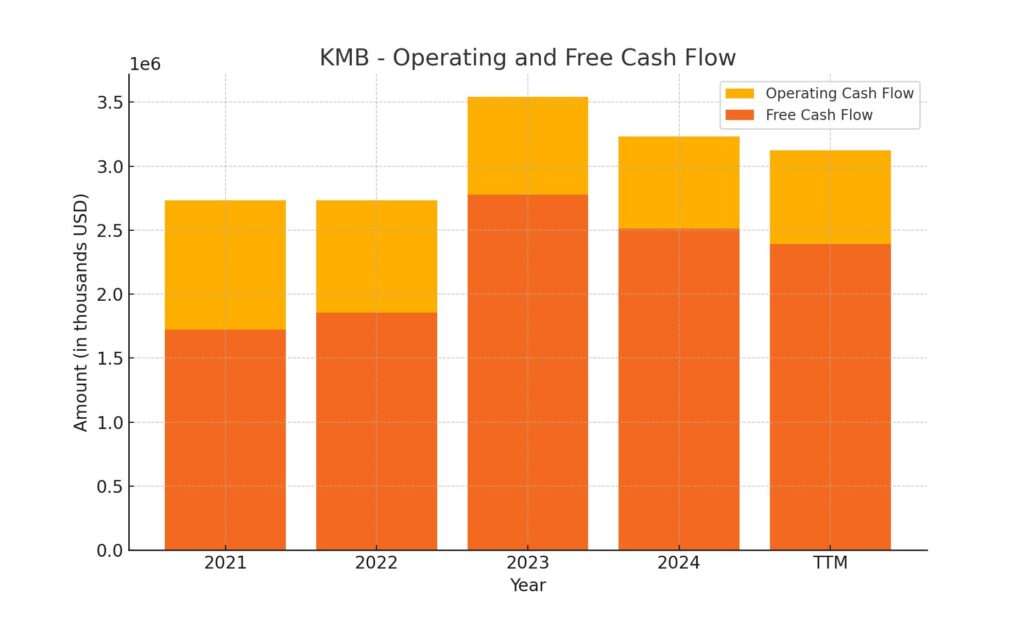
On the financing side, the company returned a substantial amount to shareholders while also managing its debt. Financing cash flow was negative $3.36 billion, largely due to share repurchases and debt repayments, including $804 million used to reduce outstanding borrowings and just over $1 billion for buybacks. With investing cash flow close to neutral at -$38 million, and capital investments trending lower, Kimberly-Clark is prioritizing returns to shareholders over aggressive expansion. The ending cash position declined to $574 million, a drop from $1.02 billion the previous year, but still reasonable given the consistency of operating cash flow and access to capital.
Analyst Ratings
📉 Kimberly-Clark has recently received a downgrade from one analyst, who shifted their rating to “Sell” due to rising concerns over a softer pricing environment and ongoing margin pressures. The company’s first-quarter results showed a 6% decline in net sales year-over-year, largely due to deliberate price cuts aimed at staying competitive. These cuts, along with increased cost burdens from tariffs, are expected to squeeze earnings going forward, raising questions about the current stock valuation.
📊 Despite the downgrade, the broader analyst consensus remains at “Hold.” Among 13 Wall Street analysts, the average 12-month price target is $145.83, which implies a modest potential upside from where the stock currently trades. Price targets vary widely, from a conservative low of $118.00 to a bullish high of $162.00, reflecting the uncertainty in market sentiment and expectations for the year ahead.
🔄 Some firms have tweaked their targets while keeping a positive stance. Piper Sandler, for example, nudged its price target down from $158 to $156 but kept an Overweight rating, citing confidence in management’s plans to manage through headwinds. Evercore ISI also adjusted its target, trimming it from $168 to $155, though still maintaining an Outperform rating.
🔽 On the other hand, TD Cowen took a more cautious view, moving its rating from Buy to Hold and cutting the price target to $145 from $159. This shift was driven by more conservative growth projections and the waning of favorable commodity cost trends, which previously helped support the company’s earnings.
📌 While the road ahead may include a few bumps, Kimberly-Clark’s fundamental strengths, like its defensive product lineup and ongoing cost control strategies, continue to play a central role in how analysts assess its long-term investment profile.
Earning Report Summary
A Mixed Start to the Year
Kimberly-Clark kicked off 2025 with a quarter that had its fair share of ups and downs. Revenue came in at $4.84 billion, which was a step back—about 6% lower than the same quarter last year. A big part of that drop had to do with some strategic decisions, like pulling out of certain markets and getting hit by unfavorable currency exchange rates. Even so, the company managed to beat earnings expectations slightly, posting an adjusted EPS of $1.93.
CEO Mike Hsu addressed the quarter’s challenges head-on. He pointed to new U.S. tariffs as a serious headwind, with about $300 million in extra costs expected for the year. That’s not a small number, but he made it clear that the company isn’t just sitting still. There’s a clear strategy in place to work around those added costs, and the leadership team is leaning into operational agility to stay competitive.
Leaner, Smarter Operations
One bright spot in the quarter was efficiency. Kimberly-Clark reported a solid 5.2% in gross productivity savings, which is helping offset some of the cost pressures. On top of that, they’re targeting $200 million in SG&A savings over the next few years. These kinds of moves are all part of a broader margin management strategy the company’s been rolling out.
It’s clear that they’re not just trimming the fat—they’re trying to become more nimble and better positioned for whatever the market throws their way next. There’s a balance here between staying cost-conscious and continuing to invest in growth, and it seems like the company is walking that line pretty well.
Adjusting the Outlook
With all that in mind, Kimberly-Clark revised its full-year guidance. They’re now expecting earnings and operating profit to be flat to modestly up, assuming constant currency. The updated outlook reflects the reality of the environment they’re operating in. Tariffs, inflation, and uneven demand across regions are real factors shaping the near-term picture.
Even so, management sounded optimistic. The tone wasn’t one of pulling back—it was about adjusting expectations while staying committed to long-term goals. There’s still a strong emphasis on innovation and keeping the brand closely connected to its customers.
While it wasn’t a blowout quarter, it also wasn’t one to be disappointed by. Kimberly-Clark is facing challenges, but it’s facing them head-on, with a clear plan and a steady hand at the wheel.
Chart Analysis
Price and Moving Averages
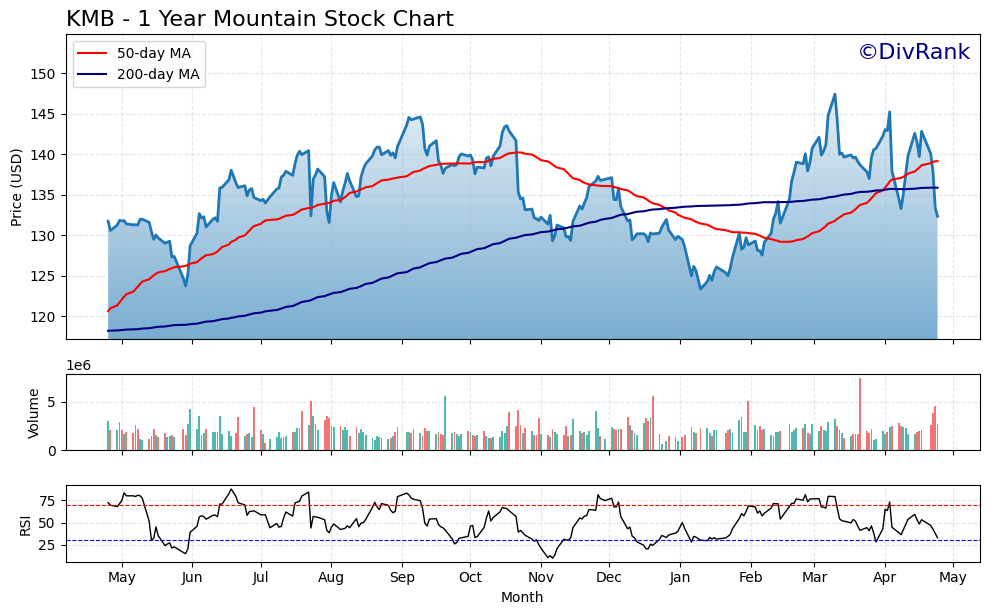
KMB’s one-year price action shows a fair amount of volatility, but with some clear patterns that stand out. The stock began the period trading around $130 and saw a steady climb through mid-year, supported by the 50-day moving average (red line) riding well above the 200-day (blue line). That upward momentum stalled around the fall when the 50-day MA flattened and eventually began to decline, while the 200-day MA kept climbing at a slower, more stable pace.
The most recent price action shows the 50-day average crossing above the 200-day line earlier in the year—a golden cross that typically hints at bullish sentiment. However, that positive momentum seems to have been short-lived. Price has since retreated sharply below both moving averages, which could raise some caution flags about the near-term trend. That said, longer-term moving averages like the 200-day one still point upward, suggesting that the broader trend isn’t completely broken, just under pressure.
Volume
Volume throughout the year stayed within a relatively stable band, but there are noticeable spikes around certain dips and rallies. These surges—especially during downturns—suggest active positioning and a possible rotation between hands rather than quiet accumulation. Most recently, volume picked up during a price drop, which can indicate heightened selling pressure or reaction to broader market events or earnings news.
Relative Strength Index (RSI)
The RSI line offers some added context. It remained mostly between 30 and 70, which reflects a stock trading within a normal range—neither overbought nor oversold for long stretches. There were a few spikes above 70, particularly during rallies in February and early April, which pointed to short-term overheating. These moments were quickly followed by pullbacks, showing that the stock tends to mean-revert fairly quickly. Recently, RSI dipped back toward the 30 zone, suggesting the stock may be entering oversold territory again, or at least sitting at a point where selling momentum is losing steam.
Overall View
The chart suggests a stock that’s navigating a stretch of indecision, with moments of enthusiasm followed by equally quick retreats. The golden cross earlier this year gave some hope, but the recent price dip below both moving averages complicates that narrative. For long-term holders, this type of action might be seen as noise—an oscillation within a longer upward trajectory—but for anyone watching closely, the price pattern and RSI suggest it’s entering a reset phase. How it performs over the next few weeks—especially if it holds above the recent low—could define its next direction.
Management Team
Kimberly-Clark is led by Mike Hsu, who has served as CEO and Chairman since 2019. He joined the company in 2012, bringing with him leadership experience from Kraft Foods and H.J. Heinz. Hsu is known for his steady, long-term approach and his commitment to operational discipline and brand strength, which has helped guide the company through both growth periods and times of pressure.
Supporting Hsu is a strong executive team. Nelson Urdaneta, who became CFO in 2022, came from Mondelez International and brings a firm hand on financial strategy. Patricia Corsi took on the role of Chief Growth Officer in 2024 and is focused on driving innovation and brand expansion. Other key figures include Sandi Karrmann in Human Resources and Zack Hicks, who leads the digital and IT strategy. Collectively, the leadership team balances traditional consumer goods expertise with a push toward modernization.
The board of directors includes a mix of former top executives from companies such as Starbucks, Diageo, and Merck. This diversity brings wide-ranging experience and perspectives to the table, helping shape long-term corporate strategy and oversight.
Valuation and Stock Performance
As of late April 2025, shares of Kimberly-Clark trade around $133, which is down from the recent 52-week high of just over $150. The stock has shown periods of strength over the past year, but also experienced noticeable dips, reflecting a mix of macroeconomic influences and company-specific developments.
The current trailing price-to-earnings ratio is 18.17, with a forward P/E of 17.61. These valuations place the stock near the middle of its historical range and in line with many of its sector peers. Analyst sentiment is generally neutral to slightly positive, with a consensus price target hovering around $145. That points to a modest expected return from current levels, but also suggests confidence in the company’s ability to maintain earnings and cash flow.
With a beta of just 0.39, the stock remains low in volatility, which appeals to investors looking for stability. This kind of consistency has historically made Kimberly-Clark a core holding in more conservative portfolios.
Risks and Considerations
Kimberly-Clark isn’t without its share of risks. New tariffs introduced this year are expected to raise the company’s annual cost base by about $300 million, which will likely pressure profit margins if not offset by other cost controls or pricing actions.
Currency volatility is another persistent challenge, particularly for a company with a global footprint. Fluctuations in the dollar can have a material effect on reported revenues and margins. Competitive pressure also remains a significant factor, both from branded competitors and private-label alternatives, which tend to ramp up during periods of economic uncertainty.
The company is currently facing legal scrutiny related to a facility in Connecticut and concerns about PFAS contamination. While the financial impact of the lawsuit remains uncertain, it does present some potential for both reputational and legal costs.
Operationally, inflation and supply chain dynamics are still factors. Kimberly-Clark has made strides in improving efficiency, but sustaining that momentum while continuing to invest in product innovation, sustainability, and digital transformation will be an ongoing challenge.
Final Thoughts
Kimberly-Clark continues to demonstrate its value as a stable, brand-driven business with a long history of consistent performance. Its core strengths—household name brands, strong free cash flow, and experienced leadership—give it a solid foundation even in a more volatile market environment.
The company is adapting where it needs to, tightening operations, and refocusing its product strategy, especially in categories where brand loyalty still matters. While the short-term may include cost pressures and external challenges, the overall strategy remains aligned with long-term value creation. As it works through these hurdles, Kimberly-Clark’s mix of resilience, discipline, and adaptability will likely keep it relevant and competitive for years to come.