

Last update 5/27/25
J.B. Hunt Transport Services has been steadily building its reputation as a leader in the freight and logistics sector, with deep expertise in intermodal, dedicated contract services, and final-mile delivery. With a market cap around \$13.6 billion and strong partnerships—most notably with BNSF Railway—the company continues to manage through a tough freight cycle with measured, long-term decisions.
Despite recent earnings pressure and a soft freight environment, J.B. Hunt remains committed to returning capital to shareholders, maintaining a disciplined dividend strategy, and managing costs. Its leadership team, consistent free cash flow generation, and focus on intermodal growth position the company for stability and future recovery.
Recent Events
The last twelve months haven’t been the easiest ride for J.B. Hunt. The company’s market cap has come down from north of $20 billion to just under $14 billion. Revenue slipped slightly, down 0.8% year over year, and earnings took a bit of a hit with a 7.7% decline. A slowdown in freight volume and some margin compression were key drivers here, as broader economic softness has filtered into the shipping sector.
Still, the fundamentals aren’t crumbling. Return on equity remains solid at 13.97%, and return on assets sits at 6.11%. Operating margin is holding at 6.12%, and while those numbers aren’t flashy, they point to a company that’s keeping things steady even in a tougher environment.
Liquidity is tight, with a current ratio of 0.89 and just $43 million in cash on hand. Debt stands at about $1.92 billion, giving the company a debt-to-equity ratio around 50%. Free cash flow is positive at $337.65 million—not huge, but enough to keep the lights on and continue funding shareholder returns.
And here’s the kicker: despite all that, JBHT hasn’t skipped a beat on its dividend. That kind of consistency speaks volumes.
Key Dividend Metrics
📈 Forward Yield: 1.28%
💵 Forward Annual Dividend: $1.76
🧾 Payout Ratio: 31.40%
📆 Ex-Dividend Date: May 9, 2025
💳 Dividend Date: May 23, 2025
📊 5-Year Average Yield: 0.85%
🌱 Dividend Growth Streak: Over 10 years of raises
Dividend Overview
The yield on JBHT may not be the first thing that catches your eye. At 1.28%, it sits well below what you’d find in utilities or telecom. But don’t be too quick to judge this book by its cover. Over the last five years, that yield has quietly crept up from an average of 0.85%—an under-the-radar signal that this management team is leaning more into shareholder returns.
The company’s annual dividend payout of $1.76 may seem modest, but it’s been growing consistently, and it’s grounded in sustainable earnings. That’s key. The payout ratio is just over 31%, leaving a lot of headroom even if earnings continue to face pressure.
JBHT doesn’t overpromise. There are no massive hikes or dividend drama. Just solid, predictable returns. And frankly, for dividend investors who prize consistency, that kind of discipline can be more attractive than a flashy high yield that’s on shaky ground.
Dividend Growth and Safety
J.B. Hunt’s dividend strategy is a mirror of how it runs its operations: cautious, calculated, and long-term focused. The company has raised its dividend every year for more than a decade, and it’s done so in a way that reflects careful financial management rather than any aggressive posturing.
That kind of track record doesn’t happen by accident. The payout ratio remains comfortably low, which suggests that management has plenty of flexibility to continue increasing dividends even if the operating environment remains bumpy. Free cash flow, while not explosive, is still comfortably positive—and importantly, it’s been enough to fund dividend payments without dipping into debt or eroding the balance sheet.
Speaking of debt, the company’s leverage is well-managed. With total debt just under $2 billion and a debt-to-equity ratio of about 50%, JBHT doesn’t appear stretched. There’s enough margin in their capital structure to keep things stable even if the freight market stays soft for a while.
It’s also worth noting that JBHT hasn’t needed to rely on splashy announcements to impress shareholders. Instead, it has let its consistency do the talking. In a sector where volatility can run high, that’s a trait worth valuing.
And while the latest numbers show some pressure on the top and bottom lines, there’s been no indication from management that the dividend is in jeopardy. That’s the kind of quiet confidence that income investors tend to appreciate—and it’s a sign that JBHT is playing the long game, even as the short-term winds shift.
Cash Flow Statement
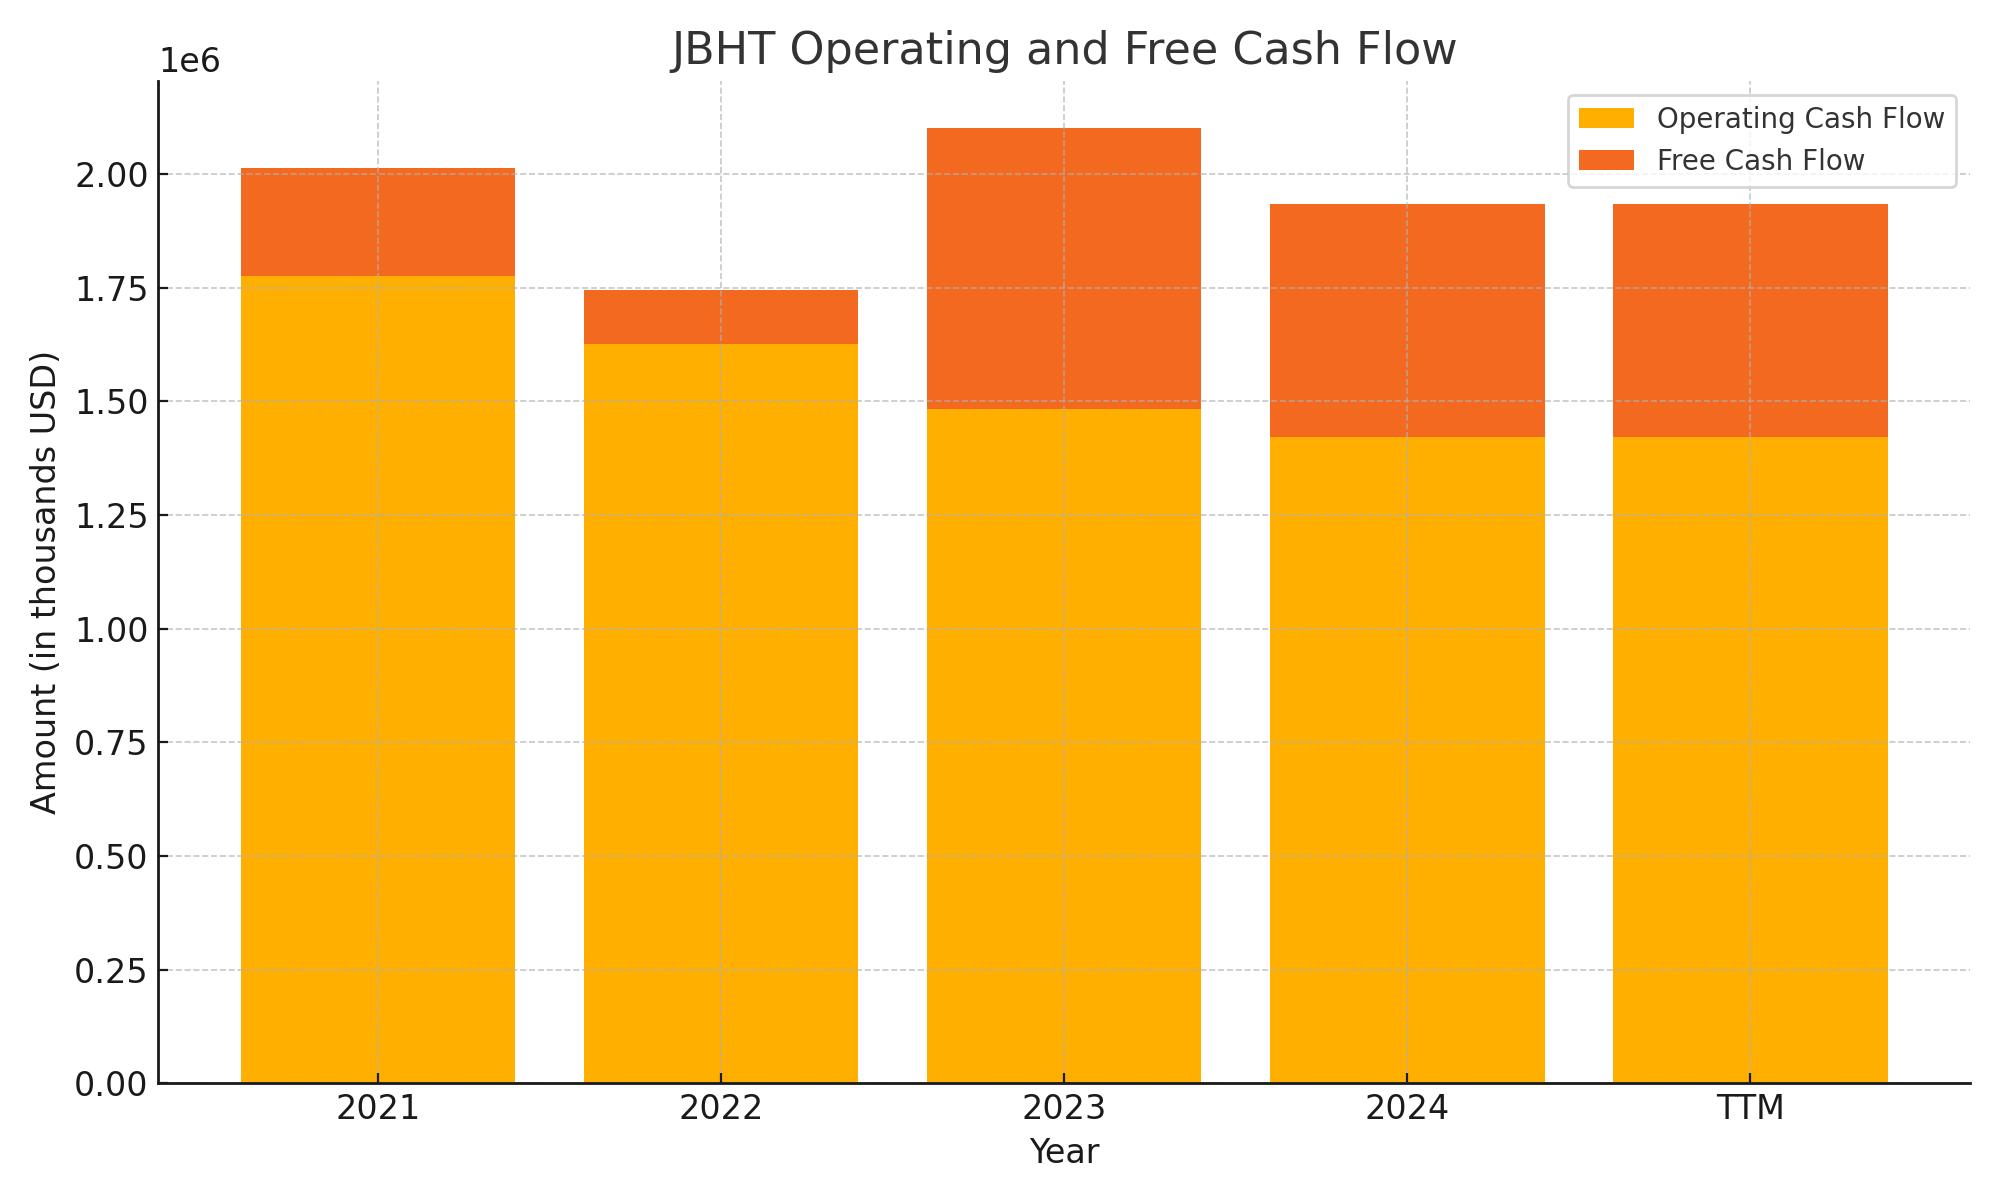
J.B. Hunt’s cash flow statement over the trailing twelve months reflects a company exercising disciplined financial management amid a softer freight environment. Operating cash flow came in at $1.42 billion, which, while lower than previous years, remains strong and demonstrates the core business is still generating meaningful cash. Free cash flow rebounded to $513 million after dipping into negative territory in 2023, thanks to a pullback in capital expenditures and steady income generation. Capex still remains substantial at $907 million, showing JBHT is reinvesting heavily, likely in fleet upgrades and infrastructure.
On the financing side, the company returned significant capital to shareholders, with $751 million spent on stock repurchases. Debt repayment reached an eye-catching $3.86 billion over the TTM period, highlighting a clear focus on deleveraging. Combined with $78 million in interest payments and $303 million in taxes paid, these outflows underscore how JBHT is managing its balance sheet prudently. Despite all of this, the company’s cash position only dipped slightly, ending at $43 million—down from $47 million the year before. This paints a picture of a business navigating macro headwinds while staying committed to both capital investment and shareholder returns.
Analyst Ratings
📉 J.B. Hunt Transport Services (NASDAQ: JBHT) has seen a shift in analyst sentiment recently, reflecting both macro conditions and sector-specific headwinds. On March 26, 2025, Susquehanna moved its rating from “Positive” to “Neutral.” The call came amid ongoing freight softness and what they identified as growing overcapacity across the industry. JBHT’s dedicated contract services unit saw a notable 5% drop in average truck count, and its final-mile delivery segment experienced a 15% decrease in delivery stops—two data points that suggest customers are pulling back or adjusting contracts.
🚚 Meanwhile, the company’s integrated capacity solutions business also showed strain, with a 13% reduction in total load count. That’s a meaningful pullback and likely contributed to the downgrade, as it reflects weaker activity in one of J.B. Hunt’s key growth areas. While these challenges are likely temporary, they still weigh on near-term expectations and confidence.
📈 Still, optimism remains in certain corners. Bank of America recently raised its price target to $166 and held its “Buy” rating. Benchmark echoed that sentiment with a $175 target, while Citigroup adjusted its target to $164—again with a “Buy” stance. The general consensus among 20 analysts sits at “Moderate Buy,” with an average price target of $162. That implies a potential upside of nearly 18% from current levels, signaling that many analysts believe JBHT’s current valuation may not fully reflect its long-term capabilities.
Earnings Report Summary
Slower Start to the Year
J.B. Hunt’s first-quarter results for 2025 came in a bit soft, reflecting what’s been a tough stretch for the freight industry overall. Revenue dipped slightly to $2.92 billion, and net income slid to $117.7 million, or $1.17 per share. That’s down from $127.5 million and $1.22 per share a year ago. Operating income also took a hit, falling 8% to $178.7 million. The company pointed to higher insurance claims, medical costs, and equipment maintenance as key drivers behind that decline—expenses that just weighed heavier than usual this quarter.
Intermodal Sees Bright Spots
One of the few highlights was intermodal. The segment brought in $1.47 billion in revenue, a 5% jump from last year. Load volumes were up 8%, which is encouraging, though revenue per load was down a bit—around 2%—mostly because of shifts in freight mix and pricing adjustments. That still marks the strongest first-quarter volume ever for their intermodal business, which is no small feat given the current environment.
Other Segments Feel the Pressure
Elsewhere, the picture was more mixed. Dedicated contract services saw revenue decline 4%, mainly due to a 5% reduction in average truck count. Final mile services were down more sharply, dropping 12%, while the integrated capacity solutions segment slipped 6%. There was a bit of good news in that last group though—its operating loss narrowed compared to a year ago, which signals some internal improvements even if top-line numbers are lagging.
Leadership’s Take on the Quarter
CEO Shelley Simpson didn’t sugarcoat the situation. She spoke directly to the realities of a softer freight market and too much capacity floating around. That said, she also highlighted cost-saving moves the company has been making, including a $200 million payroll reduction spread over two years. The goal there is clearly to protect margins without sacrificing long-term capabilities.
Executive VP Spencer Frazier added some color on the broader climate. He mentioned that customers are cautious right now, hesitant to make major supply chain decisions while tariff issues hang in the air. That uncertainty is slowing down some strategic moves, but it’s also something J.B. Hunt seems prepared to ride out.
Focused on Long-Term Discipline
Even in a slower quarter, the company’s commitment to discipline stands out. They’re staying firm on pricing strategy and doing what they can to control costs where it makes sense. With intermodal continuing to perform and some internal efficiencies starting to take hold, J.B. Hunt is positioning itself to manage through the noise and emerge with a stronger grip on its core operations.
Management Team
J.B. Hunt’s leadership team is made up of seasoned professionals who bring decades of experience in logistics and transportation. Shelley Simpson, the Chief Executive Officer, has been a driving force behind the company’s strategic evolution. Her leadership reflects a clear vision for innovation and long-term growth. Nick Hobbs, serving as Chief Operating Officer and President of Highway Services, oversees the company’s expansive trucking operations. His operational focus has been central to maintaining service standards during times of industry volatility.
Stuart Scott, the Executive Vice President and Chief Information Officer, is responsible for integrating advanced technology across J.B. Hunt’s platforms. Eric McGee leads Highway Services as Executive Vice President, while Brad Hicks heads up Dedicated Contract Services, guiding one of the company’s most stable segments. Supporting them is a diverse and well-rounded Board of Directors, led by Executive Chairman John N. Roberts III, whose long history with the company continues to shape its governance and strategy.
Valuation and Stock Performance
As of May 23, 2025, shares of J.B. Hunt are trading at $137.42, showing a modest dip on the day. The stock has been trending lower over the past year, currently down about 31 percent from its 52-week high of $200.40. That pullback has reset expectations and valuations, bringing the price-to-earnings ratio to 24.94. For a company with a strong earnings history, that figure sits on the lower end compared to broader industry peers.
Other valuation metrics show a similar theme. The price-to-sales ratio stands at 1.16, and the enterprise value to EBITDA multiple is 9.60—both of which suggest the stock is trading at a relatively fair, if not slightly discounted, level. Analysts seem to agree on that front. The consensus rating is a moderate buy, and the average price target sits at $162. That leaves room for around 18 percent upside, depending on how market conditions unfold in the coming quarters.
Risks and Considerations
There are some real pressures that investors need to weigh. The transportation industry is notoriously cyclical, and J.B. Hunt is not immune to those shifts. Economic slowdowns, changes in freight demand, and macro uncertainties—especially those tied to global trade—can all influence the company’s financial results. Recent quarters have shown how quickly earnings can be impacted by rising costs, including insurance, healthcare, and equipment maintenance.
Capacity overhang in the freight market continues to be an issue. Even as J.B. Hunt tightens costs, excess industry capacity may weigh on pricing and margin improvement. Liquidity is another consideration. With a current ratio just under 0.9 and cash reserves sitting around $43 million, the company doesn’t have a huge cash cushion. That said, management appears to be actively controlling expenditures and focusing on profitability. Still, any prolonged downturn in freight activity could limit their flexibility.
Final Thoughts
J.B. Hunt continues to be a key player in the logistics and transportation space, backed by a capable leadership team and a well-established operational footprint. Its dividend profile and steady approach to growth make it an appealing name for income-focused investors with a long-term view. While the near-term outlook carries challenges—from freight softness to rising operational costs—the company’s ability to adapt remains a strength.
The focus on intermodal growth, digital freight platforms, and cost control gives JBHT some important levers as the industry recalibrates. It’s a story still in motion, but the company’s response to adversity suggests it’s playing for the long haul. For investors keeping an eye on resilient businesses in a cyclical sector, J.B. Hunt is one to continue watching closely.