

Key Takeaways
💰 HII offers a forward dividend yield of 2.37% with a conservative 38% payout ratio, and has steadily increased its dividend annually, reflecting disciplined capital allocation.
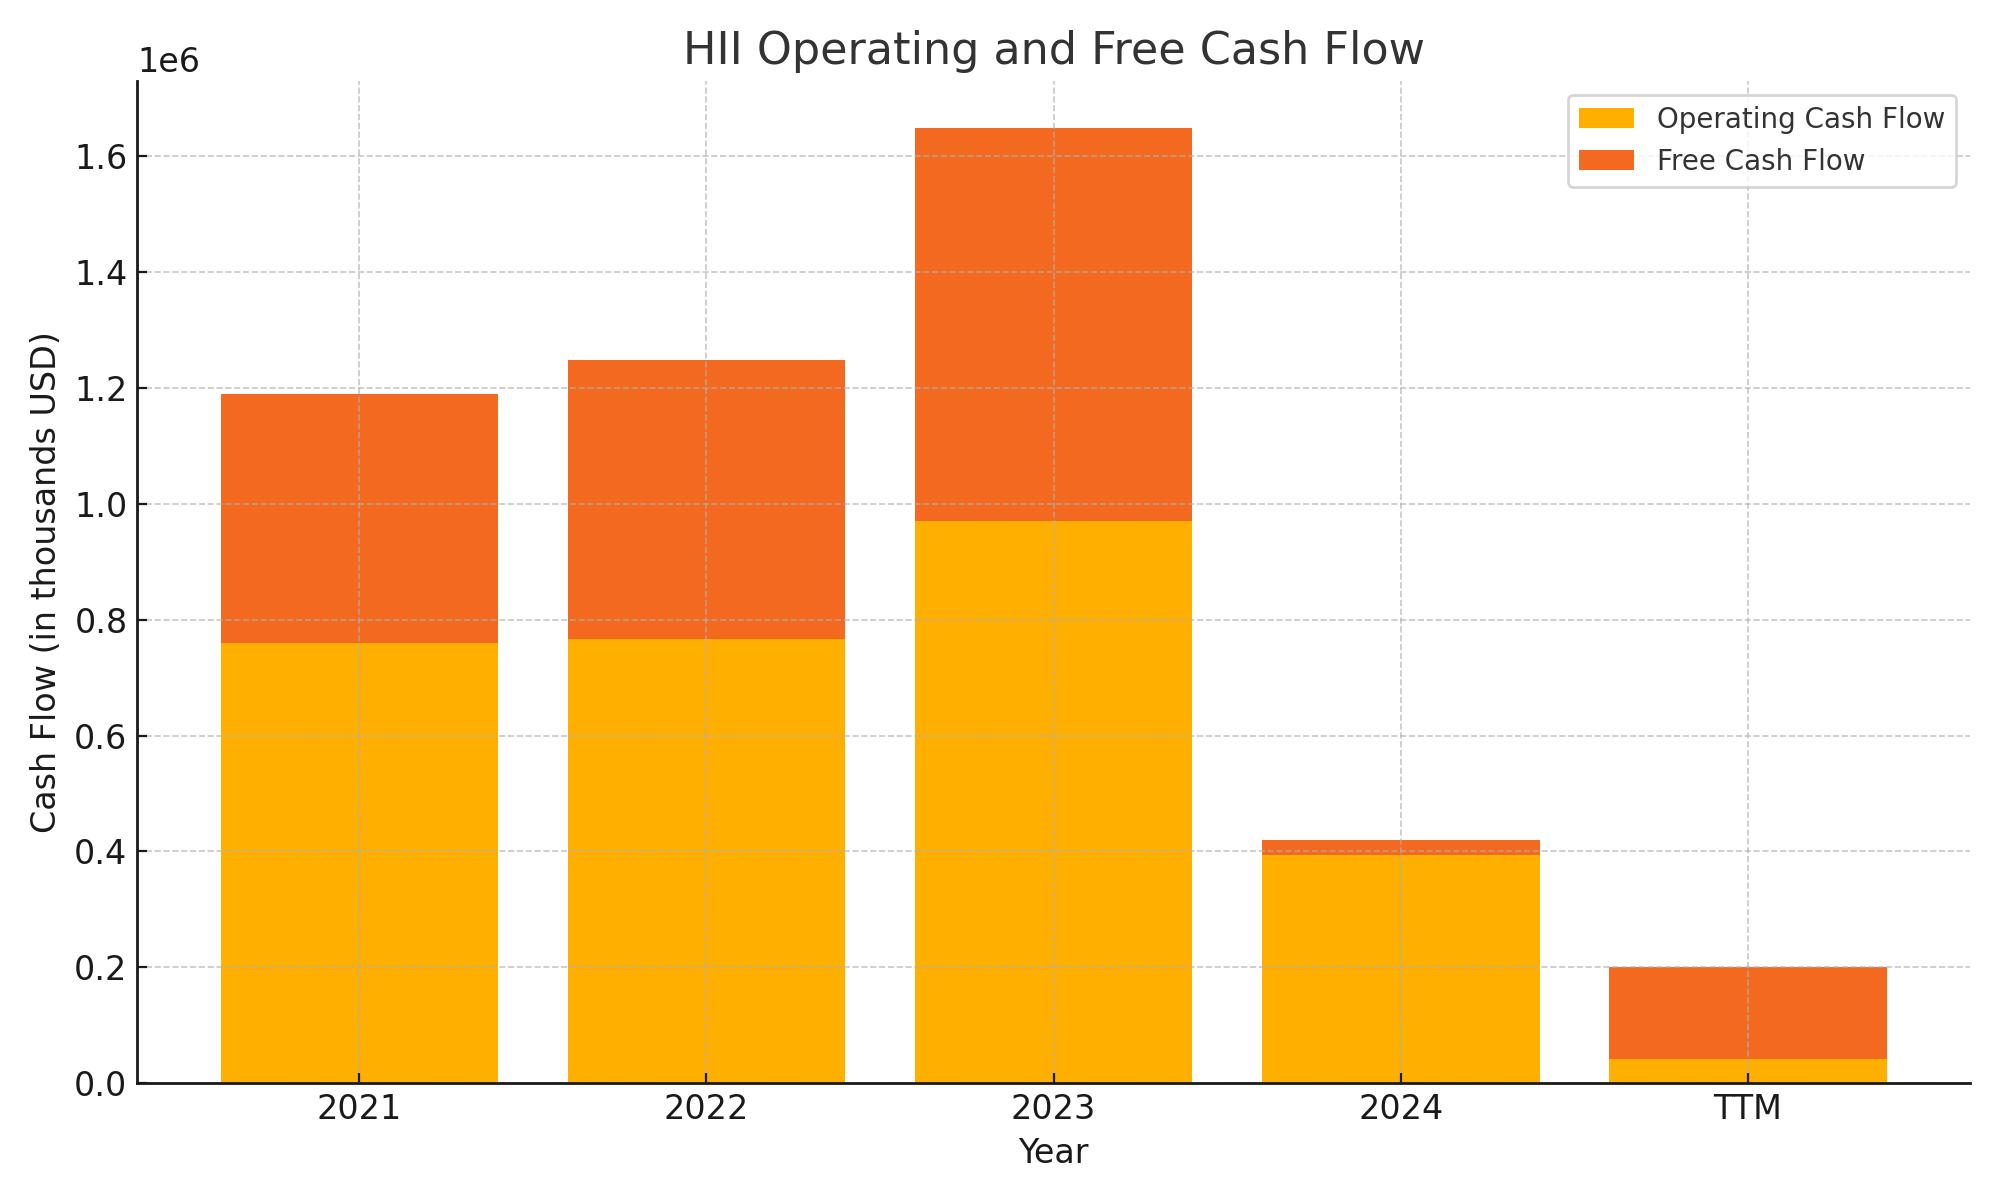
📉 Operating cash flow has declined significantly to $200 million on a trailing twelve-month basis, resulting in negative free cash flow of $159 million, driven by steady capital investment.
📊 Analysts are split, with a consensus Hold rating and a 12-month average price target near $244, though recent upgrades point to growing optimism tied to defense spending momentum.
Updated 5/16/25
Huntington Ingalls Industries builds and maintains some of the most advanced ships in the U.S. Navy’s fleet, with a history rooted in reliable, long-cycle defense contracting. The company operates through three major segments—Newport News Shipbuilding, Ingalls Shipbuilding, and Mission Technologies—each playing a key role in its \$48 billion backlog. With strong institutional ownership and a leadership team focused on execution, HII continues to balance operational challenges with long-term demand stability.
The stock trades around \$228 and offers a forward dividend yield of 2.37%, backed by a conservative payout ratio of 38%. While recent results showed slight revenue softness, operating margins held up and management reaffirmed full-year guidance. Analysts remain mixed, but recent upgrades highlight improving sentiment around defense spending and shipbuilding demand.
Recent Events
HII’s latest quarterly results came in a bit light. Revenue dropped by 2.5% from the prior year, and earnings dipped slightly as well. But for a business like this, a quarter or two of soft numbers doesn’t move the needle too much. The pace of work depends on contract milestones, not a regular monthly cycle. These are multi-year defense projects with long tails.
The market didn’t seem rattled by the results. The stock’s been climbing steadily and has comfortably broken past its 50-day and 200-day moving averages. That suggests some quiet confidence in the name, even if Wall Street isn’t loudly cheering from the sidelines.
Debt is worth mentioning. Total debt sits at $3.41 billion, with a debt-to-equity ratio of just over 71%. That’s on the higher side, but not unusual for a capital-heavy business like shipbuilding. Management has been disciplined with capital allocation, maintaining their dividend commitment while keeping leverage manageable.
Cash flow’s been tight, with levered free cash flow in the red, but that hasn’t put the dividend at risk. And in this business, lumpiness is part of the game. As long as projects continue to progress and government contracts remain firm, cash should normalize.
Key Dividend Metrics
📈 Forward Dividend Yield: 2.37%
💸 Forward Annual Dividend Rate: $5.40 per share
🔁 5-Year Average Dividend Yield: 2.27%
🧮 Payout Ratio: 38.18%
📆 Next Dividend Date: June 13, 2025
🔔 Ex-Dividend Date: May 30, 2025
Dividend Overview
Let’s be honest—no one is buying HII for a monster yield. But that’s not the point. This is a name for people who want stability. The dividend is well-funded, sits modestly above its five-year average, and isn’t at risk of being cut. For income investors looking to hold something that won’t keep them up at night, this kind of consistency is gold.
The current payout ratio is just under 40%, giving HII a nice cushion to weather slower quarters. It also leaves room for future hikes. The company has never tried to dazzle with aggressive dividend raises. Instead, they’ve built a track record of thoughtful, manageable increases that compound over time.
This is the kind of dividend policy you want to see from a firm with government contracts and cyclical project timelines. There’s a real commitment to returning capital to shareholders without overextending.
Dividend Growth and Safety
Over the past several years, HII has made dividend growth part of its playbook. The increases aren’t flashy, but they’ve been steady. This year’s bump to a $5.40 annual dividend shows that pattern continuing. It’s a quiet signal that management believes in the business’s future cash flow, even if the headlines are muted.
So how safe is the dividend? Quite safe. Revenue may fluctuate from quarter to quarter, but these are locked-in contracts from the U.S. government. Once a project kicks off, it’s not going anywhere. The visibility and stability that provides are key reasons why HII can afford to consistently return capital to shareholders.
The stock’s low beta of 0.30 also tells a story. It doesn’t move in wild swings, which is exactly what you want if you’re building a portfolio meant to generate income over the long haul. This isn’t a rollercoaster. It’s more of a steady cruiser, delivering checks every quarter.
There’s no denying the negative levered free cash flow sticks out. But again, it’s the nature of the business. Shipbuilding means big upfront investments. That cash burn isn’t ideal, but it’s not alarming either—especially when the earnings side remains strong.
For investors who prize predictability and appreciate the quiet strength of a well-run industrial contractor, HII offers a compelling dividend story. It might not light up the front page, but it keeps delivering where it counts.
Cash Flow Statement
Huntington Ingalls’ latest trailing twelve-month (TTM) cash flow data reflects some tightening in its financial flexibility, particularly in operating and free cash flow. Operating cash flow dropped significantly to $200 million from $393 million the prior year and $970 million the year before that. This downward trend suggests a more sluggish conversion of earnings into actual cash, likely due to the timing of milestone payments on long-term defense contracts and rising working capital needs. On the free cash flow front, the TTM shows a negative $159 million, reversing the strong positive flows seen in previous years. This shift appears tied to a combination of reduced operating cash and steady capital spending at $359 million, as HII continues to invest in facilities and technology.
Investing cash flow also remained firmly negative at -$476 million TTM, driven largely by those capital expenditures. Meanwhile, financing activity turned positive again, coming in at $433 million—supported by new debt issuance of $883 million, offset by $106 million in debt repayments and a moderate $100 million in share repurchases. The result: the company’s cash position has dropped sharply to $167 million, its lowest level in five years, signaling a more leveraged stance compared to prior periods.
Analyst Ratings
📈 In recent weeks, Huntington Ingalls Industries (HII) has seen a shift in sentiment from Wall Street, with a few notable rating changes and revised price targets that have caught investors’ attention.
One of the more surprising moves came from Goldman Sachs, which upgraded HII from a Sell to a Buy and bumped the price target from $145 to $234. This two-level jump wasn’t just technical—it was rooted in a growing belief that U.S. defense priorities are shifting in ways that could significantly benefit the shipbuilding industry. The White House’s recent focus on domestic shipyard production, including new executive actions, added weight to the argument. Analysts pointed to the possibility of better margins and steadier contract flow as key reasons for their upgraded view.
🏗️ Not long after, Citi placed HII on its North American Focus List, reiterating a Buy rating and tagging it with a $235 price target. Their team highlighted an improved backdrop for defense contractors, especially those tied to shipbuilding and command, control, communications, computers, intelligence, surveillance, and reconnaissance (C4ISR) operations. The creation of a federal shipbuilding office was seen as another meaningful tailwind for HII in securing consistent, long-term work.
📊 Even with these optimistic calls, the overall analyst consensus remains somewhat cautious. The average 12-month price target across the board is about $244.56, with a range spanning from $180 to as high as $310. The prevailing rating leans toward Hold, suggesting that while there are pockets of strong enthusiasm, many analysts are taking a wait-and-see approach before turning fully bullish.
Earning Report Summary
A Mixed Start to the Year
Huntington Ingalls Industries kicked off 2025 with results that felt like a mixed bag. Revenue for the first quarter came in at $2.73 billion, a slight dip from the same time last year. The company pointed to lower volumes across all three business segments—Ingalls Shipbuilding, Newport News Shipbuilding, and Mission Technologies—as the main reason for the pullback. But not everything moved backward. Operating income actually improved year over year, landing at $161 million, which gave them an operating margin of 5.9%. Net earnings came in at $149 million, or $3.79 per diluted share, just a touch lower than the $3.87 they reported last year.
What helped cushion the revenue drop was a solid inflow of new contracts. HII added $2.1 billion in new awards during the quarter, pushing their total backlog to around $48 billion. That’s a reassuring figure for a company that builds massive, long-lead-time defense platforms. According to leadership, the first quarter was in line with expectations, and they remain focused on ramping up throughput and driving cost efficiencies through the rest of the year.
CEO Commentary and Outlook
CEO Chris Kastner acknowledged the slow start but sounded confident in the direction the company is heading. He said the team is on track to increase throughput over the coming quarters and that they’ve been focused on improving execution. There’s also a sense that macro-level support is shifting in HII’s favor. Kastner pointed to the administration’s recent push to strengthen domestic shipbuilding as a tailwind for the business, something that could bring more visibility and support to their operations over time.
When breaking down the segments, Ingalls Shipbuilding posted revenues of $637 million, down slightly due to less work on amphibious assault ships. Newport News Shipbuilding was at $1.4 billion, also slightly lower, with some softness in aircraft carriers and nuclear support work. But there was an uptick in Columbia-class submarine activity, which helped balance things out. Mission Technologies brought in $735 million, with a bit of a dip in C5ISR volume, although gains in cyber, space, and electronic warfare helped soften that impact.
Steady Guidance Ahead
Despite the softer start, HII didn’t make any changes to its 2025 guidance. They’re still projecting shipbuilding revenue to come in between $8.9 billion and $9.1 billion for the full year, with operating margins holding between 5.5% and 6.5%. Mission Technologies is expected to contribute between $2.9 billion and $3.1 billion in revenue, with slightly tighter margins around 4 to 4.5%.
Free cash flow is projected to fall in the $300 million to $500 million range for the year, which, while not as high as past years, still gives them room to fund operations, maintain the dividend, and continue investing in strategic priorities. Overall, the quarter showed a company in transition—steady, cautious, but keeping its eyes on long-term value.
Management Team
Huntington Ingalls Industries is led by a management team with extensive experience in both shipbuilding and defense services. Chris Kastner serves as President and CEO, bringing a background in financial leadership from his prior role as Chief Financial Officer. His focus has been on driving operational efficiency and integrating emerging technologies across HII’s platforms, all while maintaining the company’s core strength in naval shipbuilding.
Supporting him is Thomas Stiehle as Executive Vice President and CFO, who ensures financial discipline across large, long-term contracts. Chad Boudreaux handles legal strategy and compliance as Chief Legal Officer. On the operations side, Kari Wilkinson leads Newport News Shipbuilding with deep experience in shipyard operations, while Brian Blanchette is in charge at Ingalls Shipbuilding. Andy Green oversees Mission Technologies, offering leadership on defense services including cyber, AI, and surveillance. Together, this team blends operational acumen with strategic foresight, giving HII a stable leadership foundation during a time of modernization and change in the defense sector.
Valuation and Stock Performance
HII’s stock is currently trading around $228 per share. This marks a notable recovery from its recent 52-week low near $159, though it remains below its high of roughly $286. The company’s market capitalization is just under $9 billion, placing it firmly in the mid-cap range within the defense industry. Recent price action reflects cautious investor optimism as the company addresses production challenges while maintaining a sizable backlog.
From a valuation perspective, HII trades at a trailing price-to-earnings ratio of 16.44 and a forward P/E of 15.92. These metrics are in line with peers, suggesting the stock is reasonably valued relative to its earnings potential. Analysts have set a consensus 12-month price target near $238, with a range that stretches between $180 and $310. Most rate the stock as a Hold, reflecting both confidence in the company’s contract strength and caution around execution risk. While not currently in favor with aggressive growth investors, HII remains a steady presence for those with a long-term view on defense demand.
Risks and Considerations
Like any major contractor, HII faces risks that come with the scale and complexity of its projects. One of the more pressing legal issues involves a revived class-action lawsuit claiming wage suppression tied to historical no-poach agreements. This case, while not new, has gained renewed attention and could impact the company financially and reputationally depending on its outcome.
Operational risks have also emerged in recent quarters. Labor shortages, particularly skilled trades, have slowed progress on high-profile projects like aircraft carriers. To address this, HII is increasing outsourcing, which could introduce new quality control and cost variability challenges. Managing supplier timelines and contractor consistency will be critical as the company works to stay on schedule.
Technological risk is another layer, particularly as HII expands into areas like artificial intelligence, cyber capabilities, and electronic warfare. These are growth areas but come with fast-moving regulatory and operational standards. Additionally, while debt is being managed, the company’s overall leverage remains a watchpoint, especially if cash flow generation becomes uneven in the near term.
Final Thoughts
Huntington Ingalls continues to play a central role in America’s defense landscape, particularly in naval shipbuilding. It is one of the few companies capable of handling the scale and complexity of nuclear-powered vessels, and its services arm is becoming increasingly relevant in areas like cyber and intelligence systems. The leadership team is well equipped to manage both the legacy side of the business and the newer, tech-forward initiatives.
Stock performance has been mixed, but fundamentals remain intact. The firm’s massive backlog provides strong visibility into future revenue, and despite current challenges, management has kept long-term guidance steady. Risks, while present, are being addressed with targeted strategies such as outsourcing, workforce investments, and digital transformation.
For long-term investors focused on defense exposure with a balance of income and stability, HII offers a durable profile. It’s not without its pressures, but its core business, leadership stability, and strategic relevance suggest staying power in a shifting global defense environment.