

Key Takeaways
💰 HFWA offers a forward dividend yield of 4.18% with a consistent payout history and a 62.84% payout ratio, suggesting steady income potential and room for future growth.
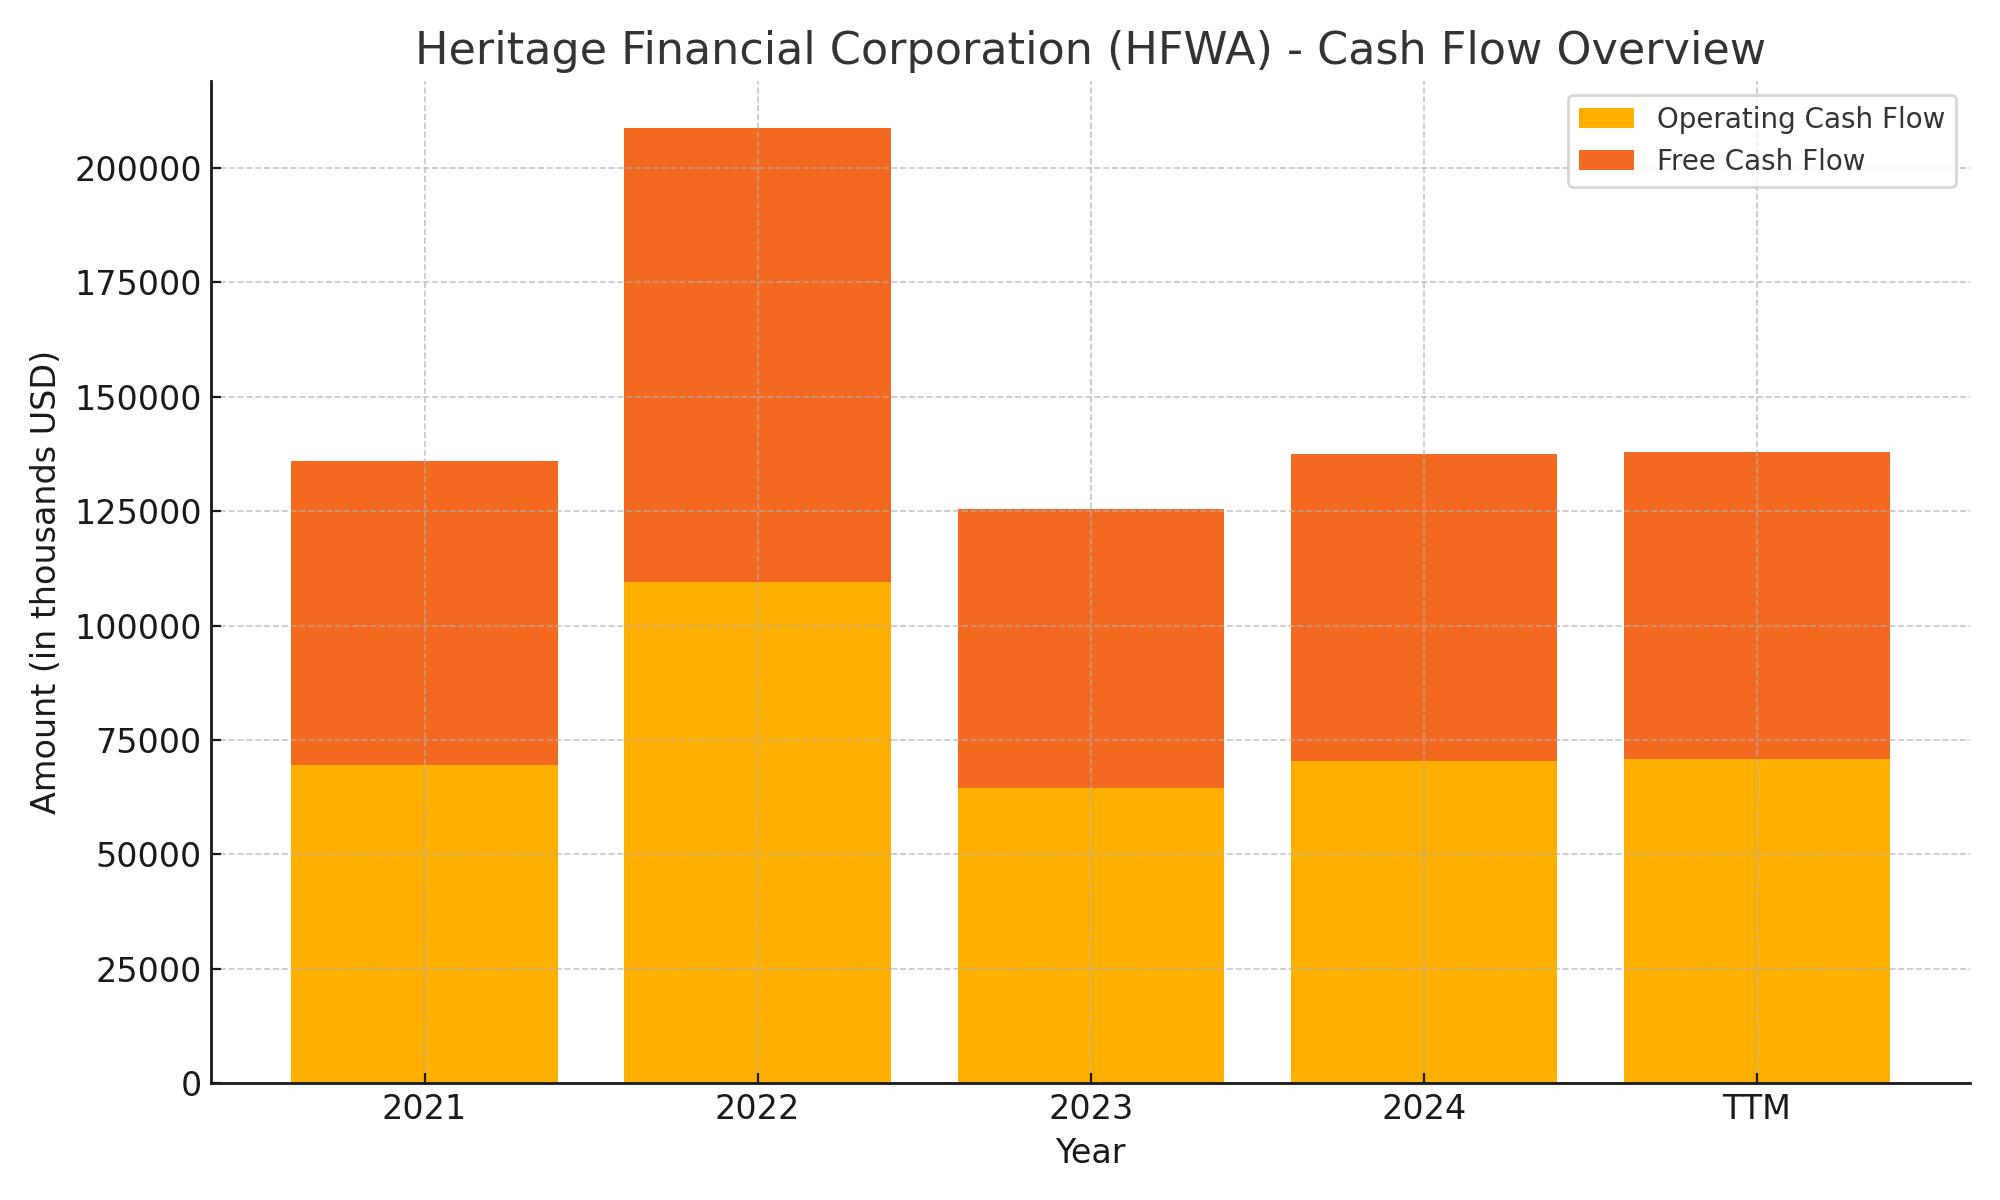
💵 Operating cash flow reached $70.8 million in the trailing twelve months, with free cash flow closely aligned at $67.1 million, supporting the reliability of the dividend.
📈 Analysts hold a neutral to slightly bullish stance with a consensus price target of $27.67, and recent earnings showed net income more than doubling year-over-year with improving margins.
Last Updated 5/11/25
Heritage Financial Corporation (HFWA) is a regional bank based in Washington with a focus on relationship-driven commercial lending and disciplined growth. Its leadership team, with deep roots in community banking, has guided the company through shifting interest rate environments while maintaining solid asset quality and a strong capital position. The bank has reported consistent earnings improvement, a healthy 4.18% forward dividend yield, and recently expanded into the Spokane market to strengthen its regional presence.
Recent earnings showed a sharp increase in profitability, with net income more than doubling year-over-year. Credit quality remains high, and operating cash flow continues to support a stable dividend. With a forward P/E of 12.33 and a price-to-book ratio under 1.0, HFWA offers income-focused investors a balance of value, cash flow, and conservative management.
Recent Events
The early part of 2025 has brought some tailwinds for Heritage. Earnings for the first quarter were especially strong, jumping 142% compared to the same period last year. Revenue over the trailing twelve months hit $220.86 million, a solid 21.8% increase year-over-year. These aren’t the kinds of numbers you see every day from a regional player.
EPS now stands at $1.48, and the current price-to-earnings ratio is 15.85. Interestingly, the forward P/E is even more attractive at 12.33, suggesting investors may be underestimating how much gas is still in the tank.
The stock price has moved up over 21% over the past year, well ahead of the S&P 500. Shares are currently trading around $23.46—off their 52-week high of $27.58 but still comfortably above the low of $16.55. It’s been treading water near the 200-day moving average, possibly waiting for the next meaningful catalyst to set a direction.
Institutional ownership is very high at 89%, which points to a strong vote of confidence from professional investors. Meanwhile, short interest is minimal. Only 2.78% of the float is currently sold short. That low figure tells us that few expect any dramatic downside in the near term.
Key Dividend Metrics
📈 Forward Dividend Yield: 4.18%
💰 Annual Dividend Rate: $0.96
🧮 Payout Ratio: 62.84%
📅 Ex-Dividend Date: May 7, 2025
🎯 5-Year Average Dividend Yield: 3.79%
📉 Trailing Dividend Yield: 3.95%
Dividend Overview
Right now, HFWA’s 4.18% forward yield is a nice bump above its five-year average, which makes it an attractive option for investors seeking income. The most recent quarterly dividend of $0.24 went ex-dividend on May 7 and will be paid out on May 21, keeping with its consistent quarterly pattern.
There’s been no drama here—no dividend cuts, no massive jumps meant to attract short-term buyers. Just slow, reliable payments quarter after quarter. It’s the kind of routine dividend investors appreciate. No surprises, just a steady stream of income.
At 62.84%, the payout ratio shows management is being thoughtful. They’re not overextending themselves, yet they’re not hoarding cash that could be going back to shareholders. That balance is crucial for maintaining a sustainable dividend over time, especially in an industry where credit cycles can turn quickly.
Dividend Growth and Safety
Heritage hasn’t gone all in on big dividend hikes, but what it has done is more important—it’s built a foundation for safe, reliable income. Over the past several years, its dividend has grown at a conservative pace, staying well aligned with earnings.
The company is sitting on $248.66 million in cash. That’s a nice buffer, especially given its $286.53 million in debt. There’s no sense here that the company is playing it fast and loose with its balance sheet.
Return on equity comes in at just under 6%. That’s not explosive, but in a tightening rate environment where many banks are under pressure, it’s a respectable figure. Heritage seems more focused on risk management and capital preservation than chasing short-term gains.
Another comfort point for income investors is volatility. With a beta of just 0.52, this is a stock that tends to move less dramatically than the broader market. If you’re building a portfolio designed to weather different market cycles, that kind of stability is valuable.
Lastly, the current price-to-book ratio of 0.91 suggests the stock is still trading at a discount to its book value. That could indicate that the market hasn’t fully caught up to the company’s steady performance, or simply that investors are waiting for clearer signs of future growth. Either way, the valuation gives some margin of safety for those focused on income rather than capital appreciation.
HFWA keeps things simple. It doesn’t chase headlines or get ahead of itself. It just delivers results, pays out a respectable dividend, and keeps its balance sheet in check. For dividend investors looking to add a bit more consistency to their holdings, that’s a formula worth paying attention to.
Cash Flow Statement
Heritage Financial’s trailing twelve-month cash flow profile shows a rebound in operational efficiency, with operating cash flow at $70.8 million, up from $64.5 million the prior year. This bounce comes after a dip from the 2022 peak of $109.5 million, and signals the bank is regaining steady ground in its core business. Free cash flow closely mirrors this strength, totaling $67.1 million—another sign that cash generation is healthy and supporting ongoing dividend payments without strain.
On the investing side, cash outflows have moderated significantly compared to the steep drawdown in 2021, when Heritage deployed over $1.2 billion. Over the TTM, net investing cash outflows stood at $40.2 million, indicating more disciplined capital allocation. Financing activities show net inflows of $28.4 million, largely due to new debt issuance totaling over $1.55 billion, though most of it was offset by repayments of $1.79 billion. This refinancing activity appears tactical rather than concerning. The company ended the period with $248.7 million in cash—more than doubling last year’s cash position, and its strongest cash reserve since 2021.
Analyst Ratings
📊 Heritage Financial Corporation (HFWA) has recently seen a mix of cautious and optimistic takes from analysts. 🟡 Keefe, Bruyette & Woods lowered their price target slightly, trimming it from $27 to $26 while keeping a “Market Perform” rating. This signals a neutral stance, implying the stock is expected to hold steady rather than outperform. The shift appears tied to updated expectations for loan growth and margin pressure within the regional banking space.
📈 Meanwhile, Piper Sandler remains more upbeat. They’ve reaffirmed their “Overweight” rating, though they also adjusted their price target downward—from $34 to $31. Despite the reduced target, their stance shows ongoing belief in the bank’s long-term fundamentals. The revised target accounts for changes in rate sensitivity and a recalibration of earnings estimates after the most recent results.
🎯 As it stands, the average 12-month price target among analysts comes in around $27.67. This figure reflects a slight premium over the current share price, pointing to modest expected upside. Targets currently range from $26 on the low end to $31 on the high end, underscoring a split between neutral and mildly bullish expectations among the analyst community.
Earning Report Summary
Heritage Financial kicked off 2025 with momentum, showing a clear turnaround from last year’s sluggish first quarter. Net income for Q1 came in at $13.9 million, up from $11.9 million in the final quarter of 2024 and more than double the $5.7 million they posted a year ago. Earnings per share hit $0.40, which is a solid bump from $0.34 in the prior quarter and a big leap from $0.16 this time last year. That kind of improvement sends a message that management is starting to hit a more comfortable stride, especially after navigating some challenging economic conditions.
Improving Margins and Deposit Growth
One of the highlights this quarter was the bank’s net interest margin, which ticked up to 3.44%. That’s a sign they’re getting a better return on their loans and investments relative to what they’re paying on deposits. Deposit growth was also healthy—up $160.7 million, or just under 3%. Most of that came from increases in money market accounts, suggesting customers are still looking for yield but sticking with Heritage.
They did take a pre-tax hit of $3.9 million after selling off some lower-yield investment securities, but leadership was clear that the move was intentional. The cash from those sales was shifted into higher-yielding opportunities and new loans, so the short-term pain looks like a bet on better returns down the line.
Steady Credit Quality and Operating Expenses
Credit quality continues to look stable. Non-performing loans stayed extremely low at just 0.09% of the total loan book, and charge-offs were minimal—only $299,000 for the quarter. The allowance for credit losses held steady at 1.09%, so there’s no indication that the bank sees any brewing trouble in the loan portfolio.
On the expense side, costs were up by $1.8 million. Most of that came from higher compensation and employee benefits, which might be partly due to a growing workforce as the bank expands into new markets. That’s not unexpected and doesn’t seem out of line given the overall growth.
Strategic Moves and Leadership’s Tone
A big move this quarter was the company’s entry into the Spokane market. Heritage brought on three experienced commercial bankers to lead the charge there, signaling that they’re putting some weight behind regional expansion. This isn’t just a foot in the door—it looks like a real push to deepen their footprint in the Northwest.
Management’s tone was confident. They talked about the strength of their balance sheet and emphasized a focus on disciplined risk management. Their tangible common equity ratio moved up to 9.3%, which gives them some flexibility going forward. Whether that means more investment, a buyback, or continued dividend growth remains to be seen, but it’s clear they’re not sitting still.
Management Team
Heritage Financial’s executive leadership brings a long-standing, steady hand to the company’s strategy. CEO Jeff Deuel has led the organization since 2019 and been part of the team for well over a decade. His experience in regional banking has helped shape Heritage’s focus on conservative lending and thoughtful geographic expansion. He’s not one to chase headlines, but under his watch, the bank has strengthened its balance sheet, navigated interest rate shifts smoothly, and stayed focused on community-based commercial banking.
President and COO Bryan McDonald has also been with Heritage for many years and plays a key role in overseeing day-to-day operations and lending growth. His operational insight helps the company execute well at the branch level while keeping costs under control. The leadership team emphasizes internal stability and measured decision-making, and that culture trickles down through the entire organization. They’ve built a business that values risk control and sustainable performance, rather than short-term excitement.
Valuation and Stock Performance
The stock has quietly gained ground, up over 21% in the past year and currently trading around $23.46. That’s still below the recent high of $27.58, but the overall trend reflects improving fundamentals and investor confidence. Compared to many regional banks, that’s a respectable recovery and speaks to Heritage’s ability to deliver in a cautious environment.
Valuation remains reasonable. The trailing P/E is 15.85, and the forward P/E sits even lower at 12.33. The price-to-book ratio of 0.91 indicates shares are still trading at a discount to their net asset value. For dividend investors, this is the kind of setup that can offer a mix of yield and modest upside without needing aggressive assumptions.
Average volume is consistent, and institutional investors control a large portion of the float, which helps with stability. Short interest remains low, so there’s no significant downward pressure from speculative bets. With shares hovering around their 200-day moving average, the stock appears to be in a holding pattern—waiting for either a new catalyst or a shift in market sentiment.
Risks and Considerations
Interest rate sensitivity is a clear risk for any bank right now, and Heritage is no exception. If the Federal Reserve moves toward cuts or if yield curves flatten further, the net interest margin could come under pressure. Heritage has managed this well so far, but it remains an important variable.
Credit risk, while currently stable, is always worth monitoring. Heritage has kept non-performing loans low and reserves solid, but changes in the broader economy, especially real estate markets, could test the bank’s loan portfolio. A slowdown in regional commercial activity could have an outsized impact, given the bank’s focused footprint.
The limited geographic reach also introduces some concentration risk. With most of its operations based in Washington and a few surrounding areas, any local economic downturns could affect earnings more quickly than for a more diversified bank.
From a valuation perspective, while the discount to book is appealing, expectations for high growth should be tempered. This is a bank that prioritizes consistency over aggressive expansion, so investors should be clear about what they’re getting: a steady income stream more than explosive upside.
Final Thoughts
Heritage Financial continues to deliver the kind of performance that dividend investors appreciate. The bank has shown discipline in lending, grown deposits without relying on promotional rates, and maintained strong capital levels. The leadership team has stayed focused on the fundamentals, and that consistency is starting to pay off.
A yield north of 4% combined with a conservative payout ratio offers a cushion in uncertain markets. Earnings growth is steady, not spectacular, but that fits with the bank’s overall character. It’s a company built for long-term investors who value reliability over surprises.
The stock isn’t the cheapest it’s ever been, but it’s far from expensive. And for those looking for stability in the regional banking space—with a focus on community ties and measured expansion—Heritage is continuing to show it deserves a place on the radar. It may not make a lot of noise, but it makes a strong case for patient capital.