

Key Takeaways
💸 Hartford offers a 1.63% forward dividend yield with a low 19.74% payout ratio, supporting steady growth potential backed by consistent quarterly payments.
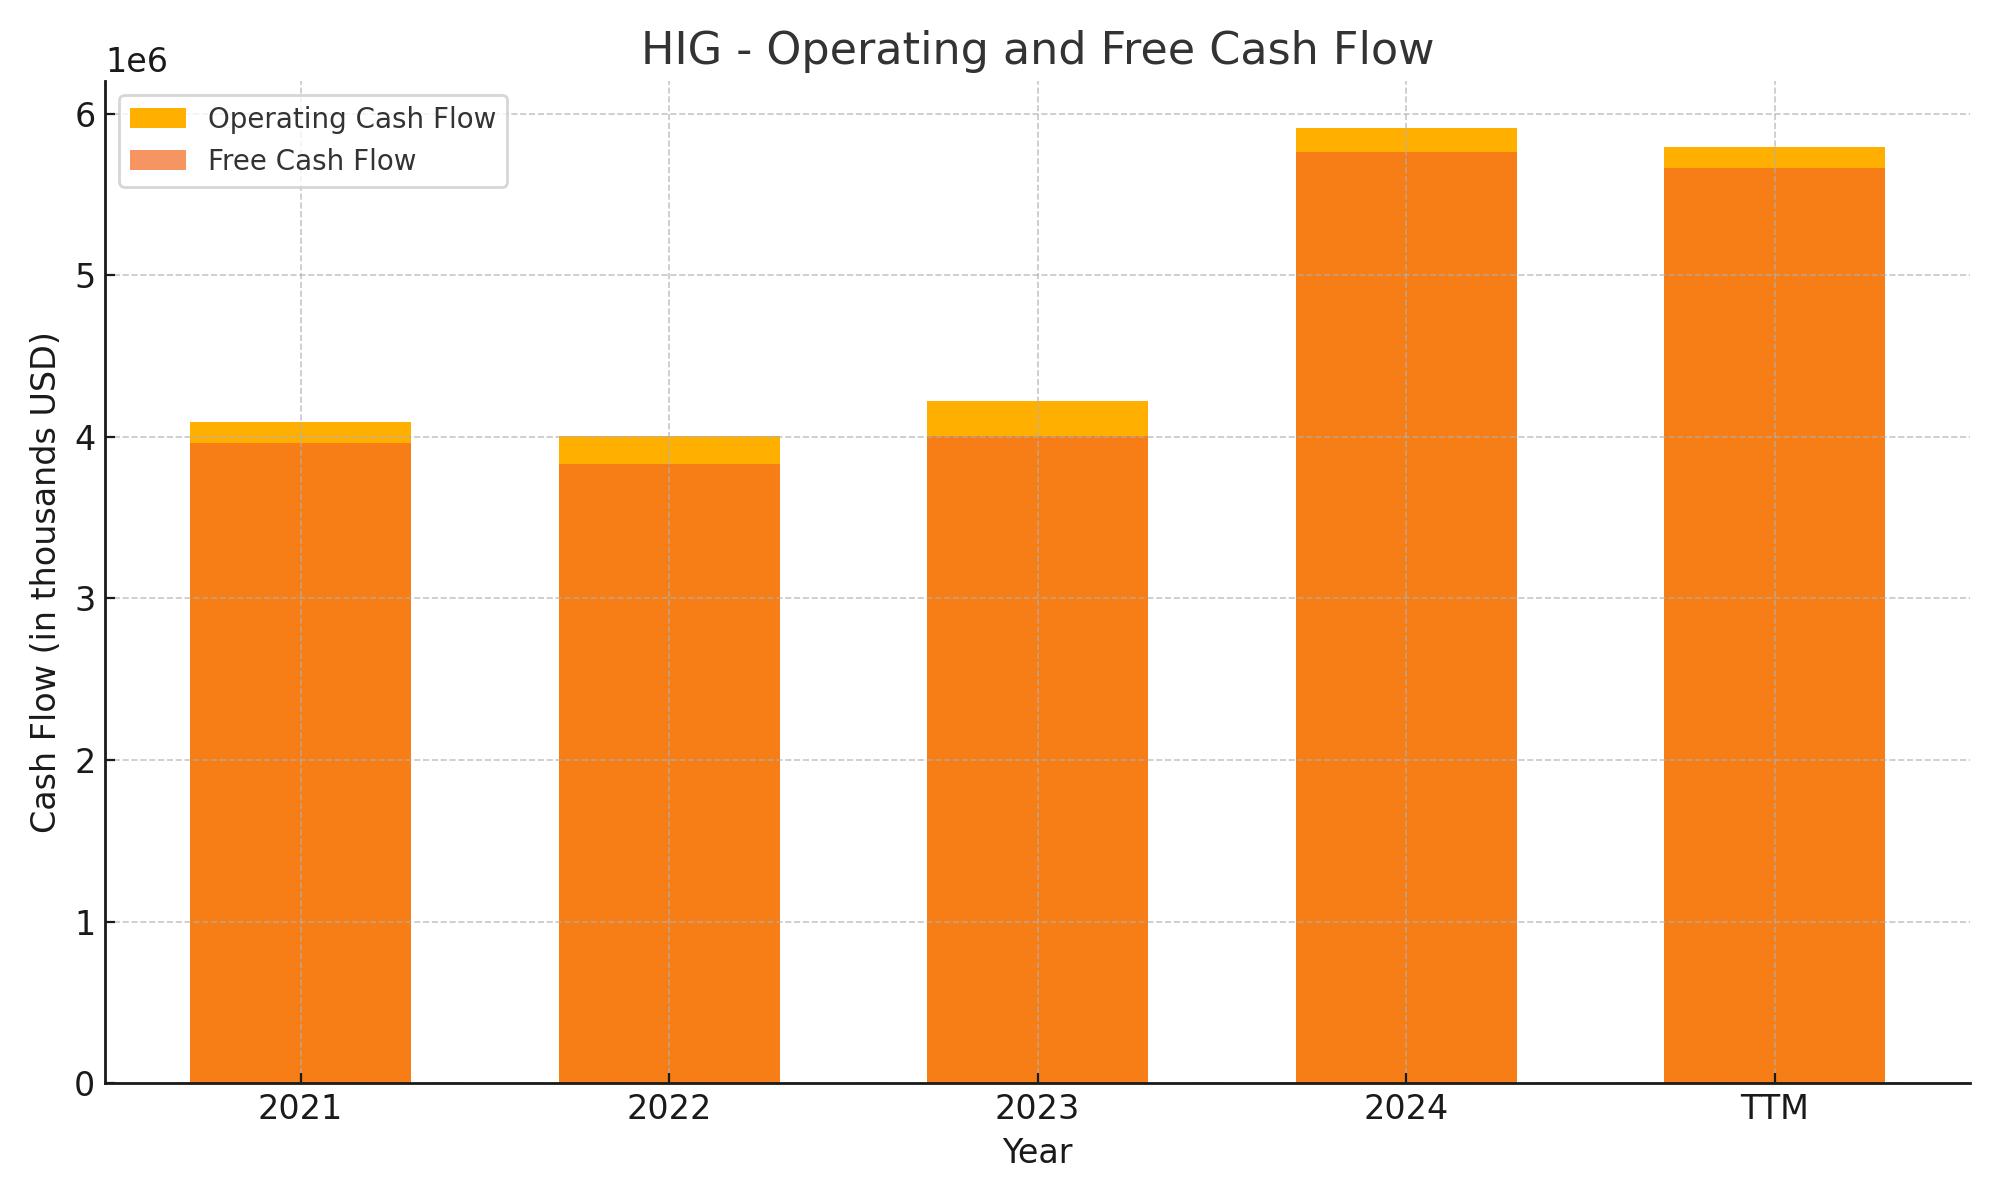
💼 The company generated $5.8 billion in operating cash flow and $5.7 billion in free cash flow over the trailing twelve months, highlighting strong liquidity and disciplined capital use.
📊 Analysts maintain a moderate buy rating with a consensus price target of $126.87, reflecting confidence in Hartford’s performance despite some recent downward revisions.
Last Update 5/8/25
The Hartford Financial Services Group, Inc. (HIG) has delivered strong, steady performance backed by disciplined underwriting, conservative capital management, and a commitment to shareholder returns. With over two centuries in the insurance industry, the company continues to demonstrate resilience through thoughtful leadership, risk control, and effective execution across its property and casualty, group benefits, and mutual fund segments.
Recent quarters have shown consistent growth in premiums, improved underwriting margins, and rising investment income, even while navigating significant catastrophe losses. Paired with a growing dividend, modest payout ratio, and healthy free cash flow, Hartford offers investors a well-managed financial stock grounded in long-term fundamentals.
Recent Events
The latest quarterly report shows a mixed bag. Net income for the trailing twelve months landed at $2.97 billion, though year-over-year earnings were down by 16.3%. That’s certainly something to monitor, but it doesn’t tell the whole story. Hartford still pulled in $5.8 billion in operating cash flow and $5.3 billion in levered free cash flow — both solid figures that give it room to manage the business and reward shareholders.
Revenue continues to trend in the right direction, with 6% growth compared to last year. Profit margin sits at a healthy 11.09%, and the return on equity of 18.5% shows the company is putting investor capital to good use.
Despite the dip in earnings, the market seems to have confidence. Shares are up more than 26% over the last year, a performance that easily outpaces the broader S&P 500. Institutional ownership stands tall at over 96%, which adds another layer of stability and shows that the big players are still on board.
Key Dividend Metrics
📈 Forward Dividend Yield: 1.63%
💰 Forward Dividend Rate: $2.08 per share
📆 Most Recent Dividend Date: April 2, 2025
🗓️ Ex-Dividend Date: March 3, 2025
🎯 Payout Ratio: 19.74%
📊 5-Year Average Yield: 2.19%
📉 Trailing Yield: 1.56%
📈 Dividend Growth Rate (5-Year Avg): Gradual and consistent
Dividend Overview
Hartford’s dividend isn’t trying to make a grand entrance. At 1.63%, the forward yield won’t raise many eyebrows, but that’s not necessarily a drawback. What matters more here is how comfortably that dividend sits on top of the company’s financial foundation.
With a payout ratio under 20%, Hartford is giving investors a slice of the pie without overcommitting itself. This is a level of restraint that can be a real asset during tougher market conditions. It also suggests room for future growth, which is important for those who prefer to reinvest dividends and compound returns over time.
The company hasn’t skipped a beat in its payout schedule, either. The most recent dividend of $0.52 per share was handed out in early April, right on schedule. There’s a rhythm here that dividend investors can appreciate — no sudden jumps or suspensions, just steady payments backed by strong fundamentals.
With a forward price-to-earnings ratio just over 11 and price-to-book around 2.2, there’s a case to be made that the stock still trades at a reasonable valuation. Earnings power remains solid, and Hartford continues to return capital to shareholders without stretching itself thin.
Dividend Growth and Safety
What sets Hartford apart is the way it balances growth with security. That low payout ratio is the clearest sign of how seriously the company takes its dividend obligations. Even with earnings dipping in the most recent quarter, there’s no sign that the dividend is at risk. In fact, there’s a good chance it will keep rising.
While the dividend growth rate hasn’t been flashy, it has been consistent. And that’s often what income-focused investors want — regular increases that help offset inflation and provide a rising income stream over time. With over $5 billion in free cash flow, Hartford has the breathing room to continue growing its dividend while still investing in the business and buying back shares when it makes sense.
On the balance sheet, debt levels remain manageable. With a debt-to-equity ratio under 26%, the company isn’t carrying a load that would threaten its ability to return cash to shareholders. Insider ownership is minimal, but institutional ownership is extremely high, which suggests confidence from professional money managers.
There’s also little evidence of short-term skepticism. Short interest is just 1.45% of float — a low figure that speaks to the relative calm surrounding this name.
Cash Flow Statement
The Hartford’s trailing twelve-month cash flow profile reflects a company in solid financial health, with $5.8 billion in operating cash flow and $5.7 billion in free cash flow. This is a notable year-over-year improvement, building on $5.9 billion in operating cash flow in 2024 and $4.2 billion in 2023. The consistent growth in core cash generation suggests stable underwriting performance and disciplined cost control. Capital expenditures remain minimal at just $133 million, preserving the bulk of operating cash for shareholder returns and strategic flexibility.
Investing activities show outflows of $3.7 billion, largely driven by portfolio repositioning and acquisitions typical of an insurer managing a large investment book. On the financing side, Hartford returned a meaningful amount of capital to shareholders, with $1.56 billion used for stock buybacks. Debt activity was minimal, and overall cash usage in financing totaled $2.15 billion. Despite these outflows, the company maintained a steady cash position of $230 million at period end, only slightly lower than the prior year, underscoring the company’s strong liquidity management.
Analyst Ratings
📊 Analysts have been actively adjusting their outlook on The Hartford Financial Services Group (HIG) in recent weeks, reflecting a mix of optimism and caution. 🎯 The consensus 12-month price target currently stands at $126.87, with individual estimates ranging from $107 to $145.
📈 Several firms have raised their price targets, citing strong financial performance and strategic initiatives. For instance, UBS increased its target from $139 to $142, maintaining a “Buy” rating, while Barclays lifted its target from $140 to $145, also reiterating an “Overweight” stance. These adjustments reflect confidence in HIG’s earnings stability and capital management.
⚠️ Conversely, some analysts have taken a more cautious approach. Jefferies lowered its price target slightly from $118 to $117, maintaining a “Hold” rating, due to concerns over potential headwinds in the insurance sector. Wells Fargo also reduced its target from $126 to $125, citing similar industry-wide challenges.
🟡 Despite these mixed signals, the overall analyst sentiment remains moderately positive, with a consensus rating of “Moderate Buy.” This suggests that while there are some concerns, the majority of analysts believe HIG is well-positioned for steady performance in the coming year.
Earning Report Summary
A Tough Quarter, But Steady
The Hartford kicked off 2025 with a solid performance, though the numbers were impacted by some sizable catastrophe losses. Net income for the quarter came in at $625 million, or $2.15 per diluted share, which was a drop from $748 million, or $2.47 per share, in the same period last year. On a core basis, earnings were $639 million, down from $709 million. The hit mostly came from wildfire-related losses in California, with catastrophe costs totaling $467 million for the quarter. Even with that pressure, the company kept its footing.
Premium growth was one of the clear positives. Total written premiums in the property and casualty segment climbed 9%, with Business Insurance leading the way. Personal Insurance also contributed to the top-line push. Despite headwinds, these segments showed that Hartford’s strategy around disciplined underwriting and pricing is sticking.
Leadership Tone and Direction
CEO Chris Swift didn’t sugarcoat the impact of the disasters, but he also pointed to what went right. He emphasized how underwriting discipline and smart pricing helped balance out some of the volatility. Business Insurance saw a strong 10% rise in premiums, with a very healthy combined ratio that stayed well below 90%. That kind of margin shows real operational control.
In Personal Insurance, the team was able to pull back on losses through better pricing and fewer auto damage claims. They also highlighted some cost tailwinds and frequency improvements. Meanwhile, Employee Benefits turned in another strong performance, coming in ahead of their long-term margin goals — a good sign for ongoing strength in that part of the business.
Cash Flow and Capital Returns
Investment income gave an extra lift this quarter, jumping to $656 million from $593 million a year earlier. Hartford credited higher invested assets and better yields for the gain. Even with the big catastrophe payouts, they were still able to return $550 million to shareholders, split between $400 million in stock buybacks and $150 million in dividends.
The book value also continued to trend higher, reaching $57.07 per diluted share. That’s a meaningful gain from last year’s $50.23 and speaks to how the company is building long-term value even when the short-term headlines look tough.
Overall, the message from leadership was clear: despite a rough quarter for weather events, the business model is working. They’re sticking to their strategy, managing risks smartly, and keeping an eye on profitable growth through the rest of the year.
Management Team
The Hartford’s leadership team is led by Chairman and CEO Christopher Swift, who has been steering the company since 2014. Under his leadership, Hartford has leaned heavily into disciplined underwriting, careful risk assessment, and steady execution. His vision has helped the firm consistently perform, even in turbulent markets. Beth Costello, the Chief Financial Officer, brings solid financial expertise and plays a key role in maintaining the firm’s strong capital position and navigating interest rate impacts.
Supporting the financial and strategic framework are Amy Stepnowski, Chief Investment Officer, and Robert Paiano, Chief Risk Officer. They help shape the firm’s conservative yet effective investment and risk management strategies. This leadership bench brings a mix of insurance expertise and measured decision-making, which has translated into consistent shareholder returns and operational stability.
Valuation and Stock Performance
At the start of May 2025, Hartford shares were trading near $127.78, reflecting roughly a 27% gain over the past 12 months. That outperformance compared to the broader market isn’t driven by flash but by solid underwriting results and effective use of capital. The company’s trailing P/E is around 12.1, which keeps it in value territory relative to industry peers and the broader financials sector.
The consensus analyst price target stands at about $131.94, suggesting some upside from current levels, albeit modest. This target reflects confidence in the company’s core fundamentals and its ability to continue returning capital to shareholders. The company’s beta of 0.69 tells you something important too — Hartford isn’t a name that tends to swing wildly with market moods, making it appealing for investors looking for a bit more predictability in their portfolio. Combined with its consistent dividend history and low payout ratio, the valuation picture supports a story of reliable, steady growth rather than high-risk speculation.
Risks and Considerations
Even with its strengths, there are a few real risks to keep on the radar. Catastrophic weather events remain one of the bigger concerns, and Q1 2025 was a reminder of that. The company took a hit of $467 million from catastrophe losses, much of it tied to California wildfires. These types of events aren’t predictable and can quickly pressure underwriting margins and reserves.
Another consideration is regulatory risk. As the insurance industry adapts to changing standards around climate, data, and governance, Hartford — like its peers — must remain agile. Shifts in ESG expectations, particularly regarding investment portfolio transparency or underwriting exposure, could impact how the company allocates capital. Then there’s the broader competitive landscape. The market for property and casualty coverage is crowded, and price competition can eat into margins if not managed carefully. And, of course, economic cycles still matter. A downturn could affect both claims frequency and investment returns, putting downward pressure on earnings.
Final Thoughts
The Hartford has shown that it knows how to manage through uncertainty. With an experienced leadership team, strong underwriting performance, and consistent capital returns, it has built a reputation for reliability. The firm isn’t chasing risky growth, but it continues to deliver value through a well-balanced, disciplined approach.
For income-oriented investors and those who value conservative financial management, Hartford represents a stable insurance play with a clear focus on long-term shareholder value. Its blend of moderate dividend yield, low payout ratio, and disciplined capital return strategy makes it an appealing candidate for a core holding in a dividend-focused portfolio. While it won’t be immune to industry-wide risks, its track record suggests it knows how to navigate them.