

Key Takeaways
💸 Genpact offers a 1.37% dividend yield with steady annual growth and a low 21% payout ratio, supported by recent increases and a disciplined capital return strategy.
💰 The company generated $615 million in operating cash flow and $530 million in free cash flow over the trailing twelve months, providing strong coverage for dividends and buybacks.
📊 Analysts have a consensus price target of $50.38, with recent upgrades reflecting confidence in Genpact’s digital strategy and earnings momentum.
Last Update 5/6/25
Genpact Limited (NYSE: G) delivers digital transformation and analytics services to global enterprises, with a growing emphasis on AI-driven solutions. Originating from GE’s internal operations, it has built a strong position across business process management and technology consulting, now generating over \$4.7 billion in annual revenue. The company has shown consistent growth in its Data-Tech-AI segment and maintains stable operating margins with solid free cash flow exceeding \$530 million over the trailing twelve months.
The leadership team, under CEO BK Kalra, continues to steer the company toward deeper digital integration while balancing innovation with operational discipline. With a dividend yield of 1.37%, a conservative 21% payout ratio, and a recently expanded \$500 million buyback program, Genpact is making clear efforts to reward shareholders. Analysts hold a consensus price target of \$50.38, and the stock has climbed more than 50% year-over-year, reflecting investor confidence in its long-term execution.
🗞 Recent Events
Looking ahead, Genpact will report earnings on May 7, and the numbers should provide a clearer picture of how its digital pivot is progressing. For now, the broader financial story holds steady. Revenue for the past twelve months came in at $4.77 billion, up nearly 9% from the year before—a healthy clip for a services firm in today’s uncertain climate.
That said, the sharp drop in earnings growth, down more than 50% year-over-year in the latest quarter, is worth noting. The business is absorbing higher investment costs, particularly in digital infrastructure and talent. It’s not ideal, but if those investments begin to bear fruit—as management clearly believes they will—earnings could stabilize and resume climbing.
Investors have responded with optimism. Shares have climbed more than 50% over the last year, reflecting confidence that Genpact is positioning itself for long-term digital leadership. The stock most recently closed at $49.68 and inched a bit higher after hours, suggesting the market is taking a wait-and-see approach ahead of earnings.
📈 Key Dividend Metrics
💰 Dividend Yield: 1.37% (Forward)
🧾 Annual Dividend Rate: $0.68
🕒 5-Year Average Yield: 1.18%
📉 Payout Ratio: 21.4%
📆 Last Ex-Dividend Date: March 11, 2025
📅 Last Dividend Paid: March 26, 2025
📈 Dividend Growth Trend: Gradual and consistent
📬 Dividend Overview
Genpact isn’t going to be anyone’s high-yield darling—but that’s part of the appeal. The 1.37% yield isn’t setting any records, but it’s backed by earnings, supported by strong cash flow, and, most importantly, paid out responsibly.
The forward dividend of $0.68 per share marks a small but notable increase from the prior year. For a company reinvesting heavily in its capabilities, continuing to raise the dividend—even modestly—shows confidence in the long-term trajectory. And with a payout ratio just a tick above 21%, Genpact has a lot of breathing room. They aren’t stretching to make payments, which means the dividend can hold steady even if the next couple quarters get choppy.
The balance sheet adds another layer of reassurance. With $675 million in cash and $1.45 billion in debt, the leverage is manageable. A current ratio over 2.0 points to comfortable liquidity. They’re clearly not overextended, and that’s exactly what income investors want to see.
One other thing that catches the eye: institutional ownership is sky-high, actually exceeding the number of shares outstanding due to derivative exposure. While insider ownership is under 1%, that hasn’t translated into any signs of misalignment or weak capital discipline. Quite the opposite—management has steered capital prudently, and the dividend history reflects that.
📈 Dividend Growth and Safety
Genpact’s dividend path won’t win awards for flash, but it wins points for reliability. Over the last five years, the company has nudged its dividend higher bit by bit, sticking to a formula that doesn’t overpromise.
This year’s increase to $0.68 represents an 11.5% bump from the previous year—a strong move considering the broader environment. And they’ve done it while keeping the payout ratio low and cash flow healthy. Operating cash flow hit $615 million over the past year, and even after accounting for capital expenditures, free cash flow came in at $426 million. That’s more than enough to support the dividend comfortably.
Margins are still in solid shape, with operating margins around 15% and profit margins just shy of 11%. ROE above 22% shows they’re putting capital to work efficiently. And with debt manageable, there’s nothing on the balance sheet right now that would pose a real threat to the dividend.
If Genpact’s reinvestment strategy starts to bear fruit and margins rebound, the dividend could keep growing at a faster clip. On the other hand, if margin compression sticks around longer than expected, they still have more than enough cushion to maintain current payments without trouble.
In the end, Genpact offers a familiar formula for dividend investors who appreciate stability over spectacle. It’s the kind of name that sits quietly in a portfolio, does its job, and delivers a stream of income without the need for constant monitoring.
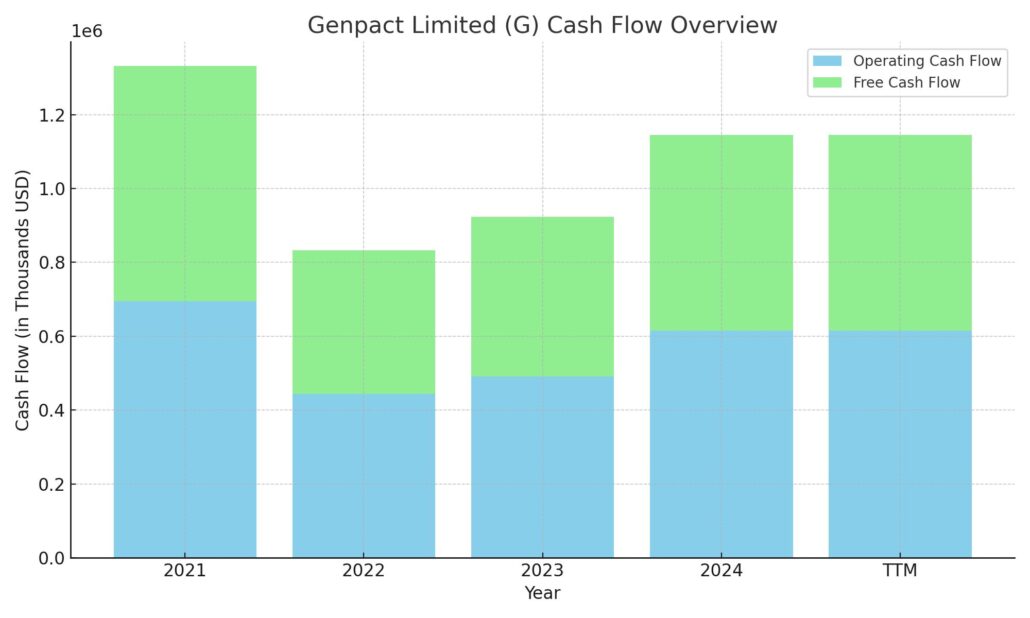
Cash Flow Statement
Genpact’s cash flow profile remains strong, anchored by a solid $615 million in operating cash flow over the trailing twelve months. This marks a notable increase from the prior year’s $491 million, signaling improved efficiency in core operations despite a competitive and evolving environment. Free cash flow followed a similar trend, coming in at $530 million TTM, up from $432 million. This kind of cash generation offers valuable flexibility for both reinvestment and shareholder returns.
On the financing side, the company continued its trend of debt repayment, retiring over $500 million in debt, even as it issued $450 million in new debt. Net cash flow from financing was negative at $425 million, largely due to these repayments and consistent capital return practices. Genpact also held a healthy $648 million in cash at the end of the period, positioning it well for upcoming obligations and potential opportunities. While capital expenditures and investing activities remain modest, the strength in free cash flow reflects the company’s disciplined approach to growth and capital allocation.
Analyst Ratings
📈 Genpact has been drawing more attention from analysts lately, with several shifting their outlook on the stock. TD Cowen upgraded the stock from “Hold” to “Buy” and bumped their price target from $45 to $60, pointing to a stronger conviction in Genpact’s long-term strategic execution and ability to capitalize on digital transformation trends. Needham & Company echoed that sentiment, keeping a “Buy” rating and lifting their target from $55 to $65. Their view seems to rest on Genpact’s growing presence in AI and analytics, combined with a steady performance in cash flow generation.
🟢 Jefferies also moved from a neutral position, raising its rating from “Hold” to “Buy” and lifting its price target from $44 to $55. Their analysts see improving fundamentals and a valuation that still leaves room for upside, especially if Genpact continues to deliver consistent revenue growth and margin improvement over the next few quarters.
🟡 Not all analysts are leaning bullish, though. Some remain cautious, citing valuation concerns after the stock’s significant run-up over the past year. The stock’s sharp rise has led a few to suggest that much of the optimism might already be priced in.
🎯 The current consensus price target sits around $50.38, with a wide range from $35 on the low end to $65 on the high. While opinions differ, the average analyst rating is a “Hold,” reflecting a wait-and-see approach as the company prepares to report earnings and provide updates on its digital strategy.
Earning Report Summary
A Solid Start to the Year
Genpact kicked off 2025 with a strong performance, reporting first-quarter revenue of $1.21 billion. That’s about a 7% bump from the same time last year, and most of it came from the company’s Data-Tech-AI division. That segment continues to be the engine behind Genpact’s growth, up nearly 10% year-over-year as more clients turn to them for AI and analytics capabilities. Their Digital Operations group also did its part, rising just over 4%, which shows consistent traction across the board.
On the earnings side, adjusted EPS came in at $0.79, landing right in line with expectations and up 9% compared to last year. Margins held steady, and the cash flow picture remains healthy. Operating cash flow over the trailing twelve months reached $615 million, which puts the company in a good spot to keep investing in growth while also rewarding shareholders. They’ve already bumped the quarterly dividend up 11% to $0.17 a share and expanded the share buyback program by another $500 million—clear signals that leadership is confident in where things are headed.
Leadership’s Focus on Digital and Growth
Genpact’s leadership team didn’t mince words about where the company is going next. CEO BK Kalra called out their progress with AI-driven solutions and said that weaving AI deeper into client operations is a top priority. He seems confident that Genpact’s role in helping companies modernize their operations will only grow from here.
Meanwhile, CFO Mike Weiner emphasized staying agile and efficient, especially in a market where client needs are shifting quickly. He mentioned that maintaining operational discipline is key as Genpact continues investing in tech and expanding its capabilities.
What’s Next
Looking ahead, the company reaffirmed its guidance for the full year. Revenue is expected to come in between $5.03 billion and $5.13 billion, with adjusted EPS landing somewhere between $3.52 and $3.59. That suggests management sees no major surprises on the horizon and feels comfortable with the momentum building in their digital-focused segments.
It’s clear Genpact is leaning heavily into its strength in AI, analytics, and digital transformation. As more companies look for help navigating a fast-changing business environment, Genpact seems ready to meet that demand with scalable, tech-forward solutions.
Management Team
Genpact is led by President and CEO BK Kalra, who stepped into the top role in early 2024. Since then, Kalra has kept the company focused on scaling its digital transformation services and deepening its client relationships. He brings a balanced approach—strategic in vision and pragmatic in execution—which has resonated with Genpact’s global client base.
Supporting him is a well-rounded executive team. CFO Mike Weiner plays a key role in shaping Genpact’s financial direction, keeping a firm hand on cost control while allowing room for growth investments. Heather White oversees legal and corporate governance, while Piyush Mehta handles people and culture initiatives as CHRO. Growth efforts are led by Riju Vashisht, while Sanjay Srivastava continues to shape the firm’s digital and AI strategy. This group brings diverse experience and has maintained clear alignment with Genpact’s long-term goals.
Valuation and Stock Performance
As of early May 2025, Genpact trades near $49.71 per share, giving the company a market cap just shy of $8.7 billion. The stock has rebounded significantly over the past year, up more than 50% from its 52-week low, and currently trades at about 17.5 times trailing earnings. That’s slightly above its historical average, but still within range for a company growing steadily with dependable cash flow.
The analyst consensus price target sits at $50.38, with individual estimates ranging from $35 to $65. That range suggests a mix of cautious optimism and valuation concern. Over the past year, the stock has outperformed the broader market, helped by strong operational results and growing confidence in Genpact’s digital strategy. Its free cash flow generation—over $530 million TTM—gives it flexibility to reinvest, raise dividends, and return capital through buybacks, all of which it’s doing.
Genpact has also grown its dividend steadily, most recently raising the quarterly payout to $0.17 per share, a solid 11% increase. Combined with a $500 million expansion of its repurchase program, this shows management is staying committed to rewarding shareholders while still reinvesting for future growth.
Risks and Considerations
Despite a solid operational base, there are risks that come with investing in Genpact. The company operates in a global market, and that naturally exposes it to currency movements that can hit reported revenue and earnings. There’s also pressure from increasing competition—larger players in IT services are investing heavily in AI and digital tools, meaning Genpact will need to continue differentiating itself through execution and client outcomes.
Operational costs, especially related to hiring, training, and upskilling talent, could weigh on margins if not carefully managed. Genpact is walking a line between investing enough to stay ahead of the curve without letting spending outpace growth. Regulatory environments are another concern—data privacy laws and cybersecurity rules are tightening around the globe, and compliance requires constant vigilance.
Macro factors are also worth watching. An economic slowdown or a sharp pullback in client tech spending could affect Genpact’s growth, especially if clients begin delaying or scaling back transformation projects. While the company has diversified its client base across industries, it still depends on long-term contracts that could be renegotiated under stress.
Final Thoughts
Genpact remains a company with a steady hand at the wheel, a clear digital roadmap, and a strong foundation in both operations and finance. Its leadership has shown a consistent ability to adapt, grow, and respond to shifts in client demand. The stock isn’t the flashiest name in tech-enabled services, but its performance over the past year and rising institutional confidence speak volumes.
For investors looking to balance growth and reliability, Genpact offers a compelling story. Its focus on AI and analytics puts it on the right side of industry trends, and its financial position supports ongoing investments without compromising shareholder returns. While it’s not without risks, the company’s track record and disciplined strategy make it one to watch in the evolving tech services space.