

Key Takeaways
💰 General Mills offers a 4.36% dividend yield with a payout ratio just over 52%, showing solid income potential with room for continued payouts and modest growth.
💵 The company generated $3.17 billion in operating cash flow over the trailing twelve months, comfortably covering its dividend and supporting financial stability.
📊 Analyst sentiment is mixed, with a consensus hold rating and an average price target of $65, reflecting cautious optimism amid near-term challenges.
Last Update 5/6/25
General Mills, Inc. (GIS) is a global food company behind household names like Cheerios, Pillsbury, and Blue Buffalo. With a steady dividend, a strong brand portfolio, and a business model rooted in consumer staples, the company appeals to investors seeking income and resilience in a shifting market. Despite recent pressure on revenue and margins, GIS continues to generate consistent cash flow and maintains a healthy payout ratio.
Trading near its 52-week low, the stock offers a dividend yield above 4%, supported by more than \$3 billion in annual operating cash flow. Leadership remains focused on long-term brand equity, innovation, and maintaining financial flexibility while navigating cost pressures and evolving consumer behavior.
Recent Events
This past year has been a bit of a grind for General Mills. The stock has dropped over 20% in the last twelve months, and while that’s frustrating on the surface, it’s also created an opportunity for those focused on income.
The company’s revenue is down about 5% year-over-year, and earnings have dipped around 6.6%. These aren’t catastrophic numbers, but they do reflect the current environment. With post-pandemic demand settling and store-brand competition heating up, it’s getting tougher out there. On top of that, higher ingredient and freight costs are eating into profitability.
Still, General Mills has managed to keep margins healthy. Net profit margin is holding at just over 13%, and the operating margin sits comfortably near 17%. Those are solid figures, especially when you consider the storm the food sector has been navigating. Return on equity remains strong at nearly 27%, although a good chunk of that is fueled by leverage—the company carries over $14 billion in debt, with a debt-to-equity ratio north of 149%.
Even so, the dividend has been untouched. And that says a lot.
Key Dividend Metrics
🟢 Forward Dividend Yield: 4.36%
📈 5-Year Average Yield: 3.21%
💸 Trailing Annual Dividend: $2.39 per share
📆 Next Dividend Date: May 1, 2025
🚫 Payout Ratio: 52.53%
🔒 Dividend Safety: Stable with room to breathe
📊 Dividend Growth Streak: 2 years
Dividend Overview
For dividend investors looking for steady, dependable income, GIS has quietly become one of the more compelling names in the consumer staples space. The yield, now at 4.36%, is a standout, especially compared to the broader market. And with shares trading near the lower end of their recent range, that income stream becomes even more attractive.
This isn’t a case of a company stretching to support the dividend, either. General Mills generates over $3 billion in annual operating cash flow, which more than covers its dividend obligations. The current payout ratio sits just over 52%, which gives the company enough flexibility to handle bumps in the road without putting the dividend at risk.
It’s the kind of setup that’s built for consistency. No drama. No big promises. Just a business quietly sending cash to shareholders quarter after quarter.
Dividend Growth and Safety
Now let’s talk about growth. General Mills isn’t chasing high-speed expansion, and that’s by design. The company paused dividend increases briefly in 2023 to navigate rising costs but resumed hikes in 2024. That shows a level of caution that actually inspires confidence. They didn’t want to push it just to keep a streak alive—and that kind of discipline usually bodes well over the long term.
There’s room to grow the payout going forward, but don’t expect fireworks. It’s going to be slow and steady. And for many investors, that’s more than enough.
The safety of the dividend is supported not just by cash flow, but by the company’s fundamental business model. People buy cereal, snacks, and frozen meals in good times and bad. That recurring demand is what allows General Mills to stay the course, even when economic winds shift.
Yes, the company does carry a lot of debt, and the current ratio under 1 suggests there isn’t a huge cushion for short-term liquidity. But that’s typical for a firm with stable cash inflows. And as long as operating performance remains solid, there’s little reason to think the dividend is in any real danger.
GIS won’t wow anyone with explosive dividend hikes, but what it offers is arguably more valuable to income-focused investors—reliability, predictability, and a yield that holds its own in a low-yield world. For those building out a long-term income stream, that combination is hard to beat.
Cash Flow Statement
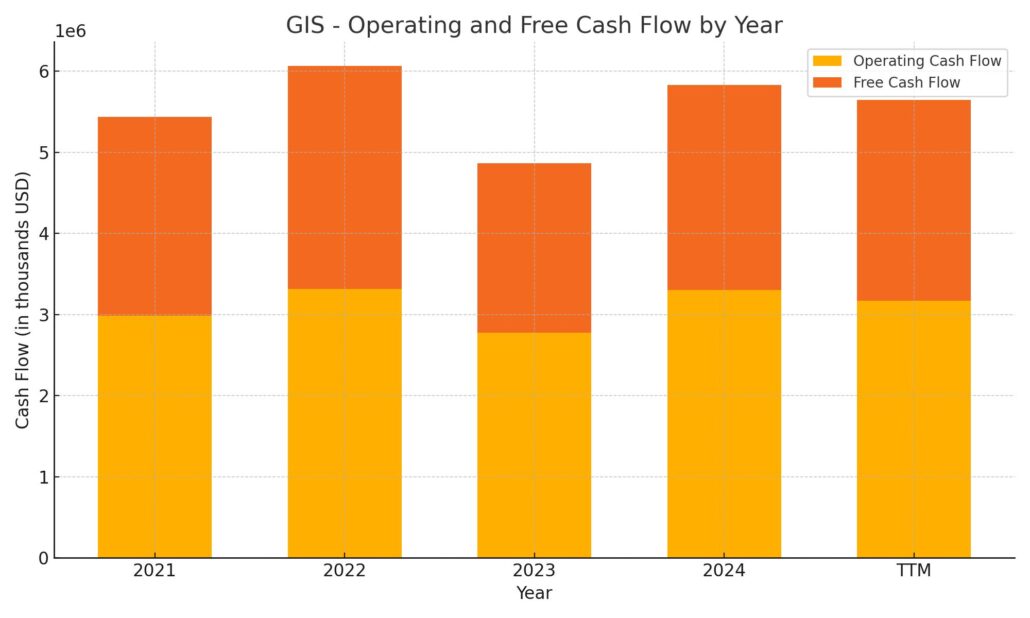
General Mills continues to show reliable cash generation, with trailing twelve-month (TTM) operating cash flow at $3.17 billion. While this marks a slight dip from the $3.3 billion recorded in fiscal 2023, it’s still a healthy figure that supports both its dividend and capital allocation strategy. Free cash flow over the same period stands at $2.48 billion, reflecting solid efficiency in converting operating income into usable cash. This is more than enough to cover the company’s dividend commitments and leaves room for some strategic flexibility.
Investing cash flow came in notably negative at -$2.27 billion TTM, reflecting a more aggressive capital deployment pace compared to previous years—potentially pointing to acquisitions or stepped-up capital expenditure. On the financing side, the company continued its trend of net cash outflows, with -$954 million in financing activities, down from larger outflows in prior years. General Mills issued about $2.56 billion in debt during the TTM period but only repaid $501 million, signaling a shift toward refinancing or extending leverage, possibly to maintain liquidity while continuing shareholder returns. Despite this, the company’s end cash balance improved to $536 million, indicating stability in cash reserves.
Analyst Ratings
📈 General Mills has seen a mix of analyst opinions recently, reflecting both optimism and caution. 🟢 One major investment bank upgraded the stock to a buy rating, pointing to expectations of a quicker rebound in organic sales compared to its competitors. This outlook is largely tied to improving momentum in its pet food division, particularly with the Blue Buffalo brand, and renewed strength in the baking segment, driven by increased marketing investments.
🔻 On the flip side, another firm initiated coverage with a sell rating and a price target of $54, expressing concerns over mounting competitive pressure and changing consumer habits. 🔴 A separate investment house echoed this cautious stance, also issuing an underweight rating with a $53 target, flagging potential risks tied to market share erosion and category stagnation.
🔍 Overall, the consensus rating for GIS sits at hold, with an average analyst price target of $65. 📊 That points to moderate upside from current levels, suggesting a wait-and-see approach from Wall Street. While there are hurdles, the company’s strong household brands and strategic focus still lend support to the long-term narrative.
Earning Report Summary
A Slower Quarter, But No Panic
General Mills recently posted its quarterly results, and while it wasn’t a blowout quarter, it also wasn’t a complete disappointment. Net sales came in at $4.84 billion, down 5% from the same period a year ago. That was slightly below what analysts were looking for. Net income also took a hit, landing at $625.6 million or $1.12 per share, compared to $670.1 million, or $1.17 a share, the year before.
On the brighter side, when you strip out some of the one-off items, adjusted earnings per share came in at $1.00, just ahead of estimates. So while the top line fell short, they still managed to beat where it counts for many investors—profits.
What’s Dragging and What’s Holding Up
The North America Retail segment, which is a huge piece of General Mills’ business, saw a 7% drop in sales. That came down to lower volume and a bit of a drag from pricing and mix. International sales also slipped 4%, partly due to currency challenges. But it wasn’t all bad news. The pet food and foodservice segments held up pretty well. Products like Pillsbury refrigerated dough and Totino’s snacks even picked up some market share.
Leadership’s Viewpoint
CEO Jeff Harmening didn’t sugarcoat it—he pointed out that the quarter was hurt by things like retailers pulling back on inventory and some slowdown in snacking trends. But he made it clear the focus is now on turning things around. The plan is to ramp up investment in product innovation and brand marketing, with a strong emphasis on showing consumers the value they’re getting, not just cutting prices to chase volume.
Looking Ahead
General Mills has updated its expectations for the fiscal year, and they’re taking a more cautious approach. The company now expects organic net sales to decline by about 1.5% to 2%, instead of staying flat or slightly positive. Earnings are also expected to dip a bit more than previously thought, with adjusted EPS projected to fall by 7% to 8%.
To help offset some of that pressure, the company is aiming to pull out $600 million in productivity savings in fiscal 2025 and another $100 million the year after that. Rather than chasing after the lowest prices, they’re betting that consumers will continue to pay for quality. Expect to see more product launches that blend health with flavor—like Cheerios with added protein or bolder snack options aimed at keeping things fresh in the grocery aisle.
Management Team
General Mills is led by a seasoned executive team with broad experience across food, retail, and global operations. At the top is Jeff Harmening, CEO since 2017, who’s steered the company with a focus on long-term brand building and disciplined innovation. Under his leadership, the company has emphasized maintaining brand strength while managing through a more price-sensitive consumer environment.
Chief Financial Officer Kofi Bruce plays a key role in the company’s strategy, balancing financial rigor with the flexibility needed to invest in key areas. His oversight helps General Mills maintain a healthy capital structure, even as they return capital to shareholders and fund future growth.
Dana McNabb oversees the North America Retail division, which includes some of the company’s most recognized brands. Her focus remains on category leadership and adapting core products to meet evolving consumer needs. Meanwhile, Jonathon Nudi handles the Pet, International, and Foodservice segments, guiding areas of strategic growth like Blue Buffalo and expanding presence in markets outside traditional grocery.
The leadership team includes executives focused on supply chain optimization and digital transformation, helping position the company to compete effectively across channels and modernize key business functions.
Valuation and Stock Performance
As of early May 2025, shares of General Mills are trading just above $54, hovering near the bottom of their 52-week range. That’s a notable pullback from last year’s high of around $76. The market’s reaction has been shaped by concerns around slowing revenue growth, shifting shopping habits, and tougher competition, especially in the budget and private-label space.
Still, at current levels, the stock trades at a price-to-earnings ratio of 12.1—well below its recent historical averages. That signals investors may be underestimating the company’s ability to stabilize earnings and grow modestly over time. With consumer staples typically seen as a defensive sector, General Mills could attract value-oriented investors looking for steady income and durable cash flow.
The dividend remains a key attraction. At a yield of 4.36%, and with a payout ratio just over 52%, the company continues to offer investors a reliable income stream. Analysts tracking the stock have landed on a consensus price target of $65, suggesting the potential for modest upside from current levels as the business regains momentum.
Risks and Considerations
General Mills faces a number of challenges that are worth keeping in mind. Consumer preferences are clearly shifting, with demand leaning more toward fresh, organic, and cleaner-label products. While the company has made progress in adapting, legacy brands still need regular reinvention to stay relevant.
Price competition is also heating up. Store brands and private labels have been gaining traction, especially as consumers become more budget-conscious. That dynamic forces branded players like General Mills to stay on top of product innovation and marketing spend just to maintain share.
Operational risks aren’t going away either. Supply chain pressures, from commodity pricing to logistics disruptions, remain part of the landscape. These factors can have real effects on margins, especially when pricing power is limited.
On the global front, the company’s international exposure brings both opportunity and volatility. Currency fluctuations, shifting regulations, and geopolitical issues all play into how much of that opportunity translates into bottom-line growth.
Final Thoughts
General Mills continues to show why it has remained a staple—both in pantries and in income-focused portfolios. The current environment presents real challenges, from declining volumes to increased pricing pressure. But the company’s leadership team, long-standing brand equity, and disciplined financial approach provide the foundation to adjust and stay competitive.
The pullback in share price has made valuation more reasonable, and the dividend remains compelling. While growth won’t come easy, the company’s steady hand and clear focus on execution give it a path forward, even if the pace is slower than investors may have hoped. For those looking for consistency and yield in a consumer-facing business, General Mills still fits the bill.