

Key Takeaways
💵 FNF offers a forward dividend yield of 3.08% with a consistent history of growth and a conservative payout ratio under 42%, supporting long-term income potential.
💧 Operating cash flow reached $6.82 billion TTM with free cash flow close behind at $6.67 billion, reinforcing the company’s ability to fund dividends and remain financially flexible.
📊 Analysts maintain a “Moderate Buy” consensus with an average price target of $71.60, citing strong fundamentals and steady performance.
📈 The upcoming Q1 2025 earnings release is expected to highlight stability in core operations and updates on the F&G insurance segment’s continued growth.
Last Update 5/4/25
Fidelity National Financial (FNF) operates at the center of U.S. real estate transactions, providing title insurance and settlement services through a network of well-known underwriters. With strong positions in both residential and commercial markets, FNF has built a steady revenue base supported by decades of operational expertise and disciplined leadership. The company also benefits from its growing insurance arm, F\&G, which adds diversification and long-term income potential.
Its recent performance reflects a business that remains resilient in changing conditions. Operating and free cash flow remain strong, the balance sheet is healthy, and management has maintained a commitment to shareholder returns. Combined with a forward dividend yield above 3% and solid analyst support, FNF continues to attract attention from income-focused investors seeking dependable, cash-generating companies.
Recent Events
As of early May, shares of FNF are trading around $65, up over 25% in the past year. That’s well ahead of broader market gains, and it reflects a quiet optimism surrounding the company. A rebound in transaction activity, particularly in residential real estate, has helped fuel stronger top-line numbers. At the same time, profitability remains solid with a 9.26% net margin and a healthy return on equity of 17.4%.
Revenue is moving in the right direction too, growing over 5% year-over-year. These aren’t explosive numbers, but they reflect real progress in a housing market that has seen its fair share of disruption.
What’s more telling is the shape of FNF’s balance sheet. The company holds $6.46 billion in cash against $4.71 billion in debt, giving it room to maneuver—whether that means pursuing strategic acquisitions, absorbing market shocks, or simply continuing to fund its dividend without strain.
This kind of financial flexibility is rare, especially in a rate-sensitive industry like real estate services.
Key Dividend Metrics
💰 Forward Annual Dividend Yield: 3.08%
📈 5-Year Average Dividend Yield: 3.79%
🔄 Payout Ratio: 41.72%
📅 Next Dividend Date: March 31, 2025
📉 Trailing Annual Dividend Rate: $1.94
🚀 52-Week Price Range: $47.79 – $66.72
Dividend Overview
For investors looking to generate steady income, Fidelity National Financial delivers a solid dividend backed by real earnings—not financial engineering or short-term cost cuts.
The forward yield of 3.08% makes FNF stand out in the financial sector, especially when compared to the average dividend yield of the broader market. Even though the yield is a bit below its five-year average, that’s mostly because the stock price has climbed. The underlying payout has remained steady and sustainable.
With earnings per share at $4.65 and a payout ratio below 42%, there’s a wide margin of safety. That means FNF doesn’t need to push its cash reserves to keep the dividend flowing. It also leaves room for potential increases down the road.
This isn’t a company that chases aggressive growth in its dividend just to attract attention. Instead, it raises payouts when the fundamentals support it—and avoids cuts even in tougher years. It’s the kind of approach that tends to build long-term trust among income investors.
Dividend Growth and Safety
FNF doesn’t make a lot of noise about its dividend, but it has quietly built a strong track record. Over the years, the company has consistently raised its payout, showing a preference for measured growth backed by results.
The most recent dividend was paid in March, and the payout history has remained intact even during more volatile periods. What really sets FNF apart is the underlying financial stability. Operating cash flow reached $6.82 billion over the last year, giving the company plenty of dry powder. Levered free cash flow, after investments and expenses, still came in positive, showing that the core business can sustain itself and continue returning capital to shareholders.
It’s also worth calling out the balance sheet again. The company’s debt-to-equity ratio sits comfortably at 55%, but with more cash than debt on hand, FNF isn’t depending on credit markets to meet its obligations.
Another thing dividend investors should appreciate: FNF’s sensitivity to the real estate cycle is more measured than you might expect. Yes, transaction volumes matter. But the company benefits from recurring activity across a range of property types, including commercial deals. It also has a scalable business model, meaning that as volumes rise, profitability can improve even faster.
FNF’s beta of 1.13 suggests it moves roughly in line with the market—not wildly volatile, but not overly defensive either. That middle ground makes it a reliable option for investors who want market exposure along with consistent income.
So while it might not generate a lot of excitement in the press, Fidelity National Financial continues to quietly do what dividend investors value most: deliver dependable income, backed by real earnings and strong stewardship.
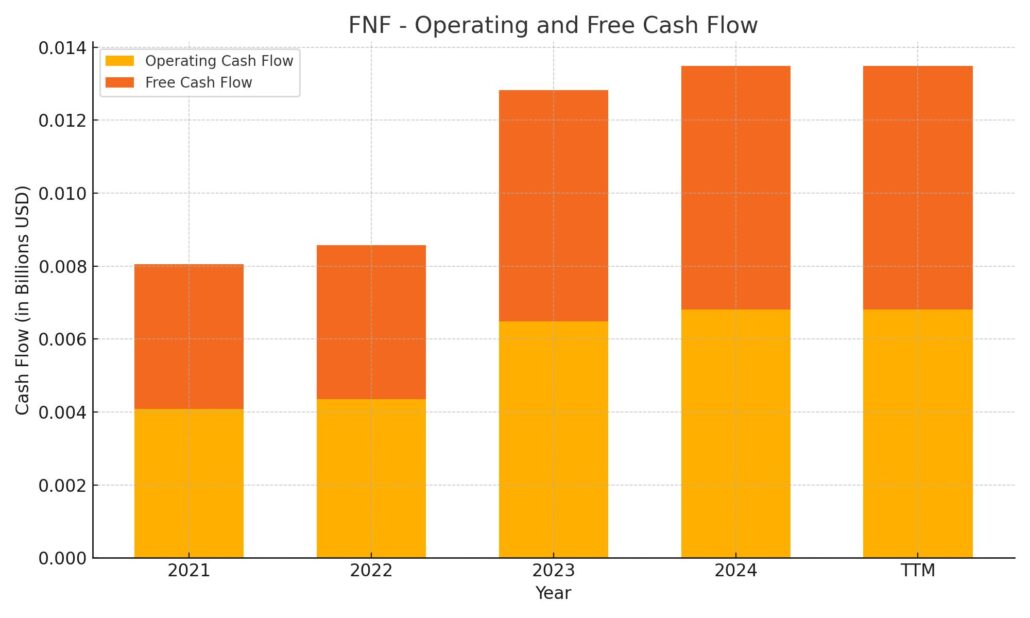
Cash Flow Statement
Fidelity National Financial has delivered strong operating cash flow over the trailing twelve months, bringing in $6.82 billion. This figure marks a steady climb from prior years and highlights the company’s resilient core operations. Even more notable is its ability to maintain robust free cash flow at $6.67 billion, suggesting FNF continues to convert a high portion of earnings into cash, a critical trait for funding dividends and maintaining financial flexibility. Capital expenditures remain modest, coming in at just $146 million, underscoring a low capital intensity business model.
On the investing side, outflows totaled $7.86 billion, continuing a multi-year trend of heavy investment activity. Much of this likely supports strategic acquisitions and positioning in key growth areas. Financing cash flow turned positive at $1.76 billion, reflecting debt issuance of over $1 billion and a relatively modest $615 million in repayments. The company’s cash position improved significantly, ending the period with $3.48 billion in cash—up from $2.77 billion a year earlier. Despite spending, the strong net cash generation and rising balance sheet liquidity reinforce the sustainability of its capital return strategy.
Analyst Ratings
Fidelity National Financial (NYSE: FNF) has been gaining traction with analysts lately, and the sentiment has been shifting in a more optimistic direction. 🟢 Keefe, Bruyette & Woods recently upgraded the stock from “Market Perform” to “Outperform” and lifted their price target to $69. Their reasoning? Strengthening operating performance and a more constructive view on the title insurance market. As the housing and refinancing environment improves, FNF’s positioning looks increasingly attractive.
🟡 Deutsche Bank moved its rating up from “Hold” to “Buy” while nudging the price target from $76 to $77. Analysts pointed to the company’s solid cash flow generation, conservative capital management, and long-term earnings resilience. These factors, they noted, give FNF the tools to maintain shareholder returns even if macroeconomic pressures persist.
📈 Stephens & Co. reaffirmed its “Overweight” stance and increased its target to $75, noting the company’s strong dividend discipline and low capital intensity as key support pillars. Meanwhile, 🟠 Barclays adjusted its price target to $67 from $61, keeping an “Equal Weight” rating, but acknowledging FNF’s stable top-line and attractive valuation.
The current analyst consensus on FNF is a “Moderate Buy” with an average price target of 💵 $71.60. That implies a potential upside of around 10% from current levels, backed by fundamentals that continue to trend in the right direction.
Management Team
Fidelity National Financial is guided by a leadership team with decades of experience in both title insurance and broader financial services. Michael J. Nolan, who took over as CEO in 2022, has been part of the company since the early 1980s. His deep familiarity with the business and the industry gives him a grounded perspective in a market that constantly shifts. Under his leadership, the company has maintained its disciplined approach to operations and capital allocation.
Anthony J. Park, the Chief Financial Officer, has been instrumental in managing the company’s finances with a steady hand. His focus on maintaining strong liquidity and navigating variable rate environments has kept Fidelity in a solid financial position. Alongside him is Roger Jewkes, the Chief Operating Officer, who plays a key role in daily operations and strategic execution. Peter T. Sadowski, as Chief Legal Officer, ensures the company continues to meet regulatory expectations while staying ahead of compliance challenges. Together, this team provides a combination of operational know-how and long-term vision that continues to shape the company’s stability and growth.
Valuation and Stock Performance
Shares of Fidelity National Financial are trading around $65, reflecting more than 25% growth over the past year. That performance has outpaced many sector peers and has caught the attention of income-focused and value-oriented investors alike. The market has rewarded the company’s consistency in earnings, cash flow generation, and capital discipline, particularly during a time of rising interest rates and market volatility.
From a valuation standpoint, FNF trades at a trailing price-to-earnings ratio of just under 14, which remains reasonable when compared to historical averages and its peer group. The price-to-book ratio stands at 2.3, suggesting that the stock is not overvalued, especially considering its cash-generating ability and strong return on equity of over 17%. Combined with a forward dividend yield above 3%, the current stock price seems to offer a solid balance between value and income, which continues to appeal to long-term investors who prefer financial durability over flash.
Risks and Considerations
While Fidelity National Financial has a resilient business model, there are several factors that investors should keep in mind. The company’s revenues are tied closely to real estate transaction volumes, which can fluctuate with interest rates, economic cycles, and housing demand. When mortgage rates rise or affordability becomes strained, transaction activity tends to slow—and that inevitably affects demand for title insurance.
There’s also the regulatory component. As a major financial services provider, FNF operates in an environment with complex compliance demands that can change with little warning. The company must continually adapt to legal and policy shifts at both the state and federal levels. Cybersecurity is another risk that deserves attention. With vast stores of sensitive customer data, Fidelity is a potential target for cyber threats. Any serious breach could damage its reputation and incur material costs. Finally, competition within the title insurance space remains intense, and maintaining market share will require ongoing investment in technology and customer service.
Final Thoughts
Fidelity National Financial stands out as a steady, well-run business in a sector that can be sensitive to economic changes. The leadership team has shown they can navigate tough cycles while protecting cash flow and continuing to return capital to shareholders. That kind of reliability matters, particularly for dividend investors looking for a consistent performer.
Valuation remains attractive, especially when considering the company’s solid financial footing, reasonable payout ratio, and growth in free cash flow. At the same time, it’s important to remain aware of the macro and regulatory risks that come with the territory. While no investment is without its challenges, Fidelity National Financial’s history of measured execution and shareholder alignment makes it a stock worth watching in any income-oriented portfolio.