

Key Takeaways
💸 EBTC offers a 2.69% forward dividend yield with a five-year average of 2.67%, supported by a low 29.66% payout ratio and a steady track record of dividend growth.
💼 The company generated $46.5 million in operating cash flow and $44.1 million in free cash flow over the trailing twelve months, showing strong capital efficiency even after investments.
📊 Analyst coverage is limited, but recent initiation with a Hold rating reflects stable fundamentals; no consensus price target has been established.
📈 First-quarter earnings showed year-over-year growth in net income and net interest margin, driven by loan expansion and disciplined expense control.
Last Update: 5/1/25
Enterprise Bancorp (NASDAQ: EBTC) has delivered a year of strong performance, marked by 50 percent stock appreciation, steady earnings growth, and a reliable dividend supported by a sub-30 percent payout ratio. The bank’s recent quarter showed continued strength in loan growth, net interest income, and balance sheet health, while management prepares for a strategic merger with Rockland Trust.
Backed by a leadership team with deep roots in the business and strong insider ownership, EBTC continues to build long-term value. With consistent dividend growth, a conservative payout structure, and solid credit quality, it offers a well-rounded profile in the regional banking space.
📈 Recent Events
Enterprise’s latest quarter shows why this small bank continues to punch above its weight. Revenue increased nearly 9% year-over-year, while net income surged over 22%. That kind of growth isn’t easy to come by in the banking space right now, especially with interest rates and lending environments shifting the way they are.
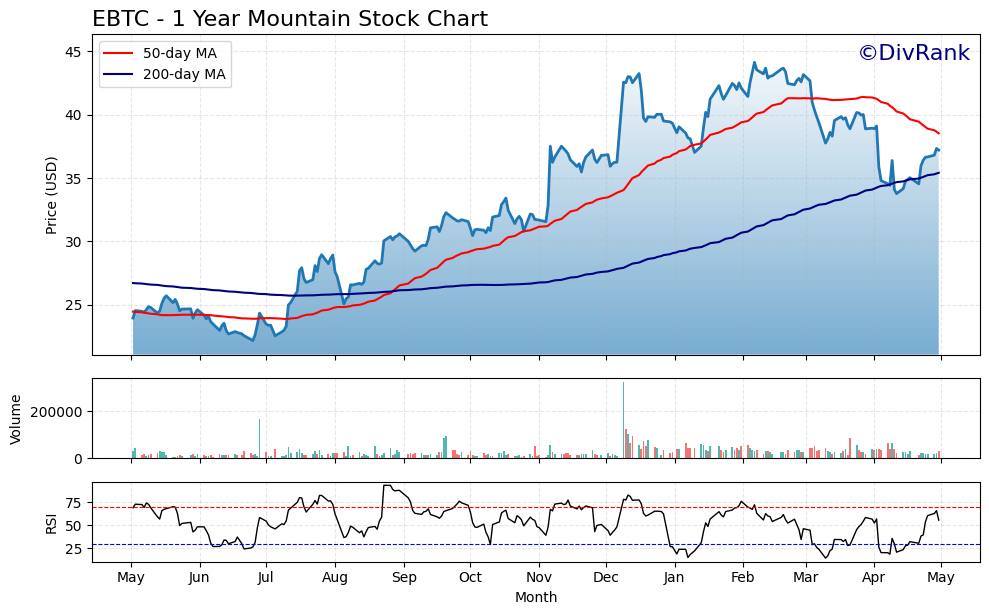
Looking at the stock’s performance, it’s held up well. Shares are up significantly over the past year, and while there’s been a modest pullback from the 50-day moving average of $38.52, there’s no major sign of concern. The 52-week high sits at $44.41, and even though the stock has cooled a bit, it’s still comfortably above its 200-day average of $35.66.
Volume tends to stay on the light side, which isn’t surprising for a regional bank with a relatively small float. Still, a beta of 0.55 tells you this isn’t a stock that swings wildly—just what income-focused investors like to see.
💰 Key Dividend Metrics
📅 Ex-Dividend Date: May 12, 2025
💵 Next Payout Date: June 2, 2025
🔄 Dividend Frequency: Quarterly
📊 Forward Yield: 2.69%
📈 5-Year Average Yield: 2.67%
🔒 Payout Ratio: 29.66%
🚀 Growth Outlook: Stable with room to expand
💼 Insider Ownership: 20.73%
🧾 Dividend Overview
At a glance, EBTC’s dividend yield of 2.69% might not jump off the page—but what sets it apart is how secure and predictable it is. The current payout represents less than 30% of earnings, which means the company is only using a small part of its profit to reward shareholders. That’s a good sign for anyone looking for income that doesn’t come with a side of risk.
Enterprise Bancorp has a habit of gradually increasing its dividend. It’s not flashy about it, but the growth is there if you look back over the years. The fact that the company hasn’t paused or slashed the dividend even during tougher times speaks volumes about its commitment to returning capital to shareholders.
And it’s not just the numbers—it’s the rhythm. With a clear quarterly payout schedule and the next ex-dividend date already marked on the calendar, this is a name that income investors can plan around. You know when the checks are coming, and you know they’ll likely keep coming.
📈 Dividend Growth and Safety
This is where EBTC really shines. A payout ratio under 30% is exactly what dividend investors want to see. It means the company has plenty of flexibility, especially if earnings ever come under pressure.
Earnings per share currently sit at $3.27, comfortably covering the annual dividend of about $1.00. Add in the fact that net income is growing—up over 22% in the latest report—and there’s a solid foundation here for future increases. The bank isn’t paying out more than it can afford, and that adds a layer of protection that’s hard to find in higher-yielding names.
Return on equity is another bright spot. At 11.31%, it tells us that management is generating solid profits from shareholder capital. And with a profit margin of 23.6%, the bank is keeping a good chunk of what it earns—exactly what you want to see in a dividend-paying business.
The valuation is reasonable, too. EBTC trades at 1.2 times book value, not exactly cheap but definitely not stretched. The balance sheet looks sound, with $86 million in cash and $178 million in debt. Nothing here feels out of line for a regional bank, and that further supports the dividend’s staying power.
Looking at the last five years, the dividend yield has hovered near where it is now. That stability means the company hasn’t had to juice the payout just to keep shareholders interested. Instead, the share price has moved largely in tandem with earnings and dividends, which usually points to healthy investor sentiment.
Enterprise Bancorp might not be on the tip of every investor’s tongue, but that’s not the point. For those focused on reliable, sustainable income, it offers the kind of measured, consistent approach that’s increasingly hard to find.
Cash Flow Statement
Enterprise Bancorp’s cash flow profile shows a company actively managing growth through significant investment, balanced by strategic financing activity. For the trailing twelve months, operating cash flow came in at $46.5 million, which reflects solid core earnings performance. Free cash flow stood at $44.1 million, showing the bank is able to convert most of its operating cash into usable capital even after covering necessary capital expenditures, which were modest at just under $2.5 million.
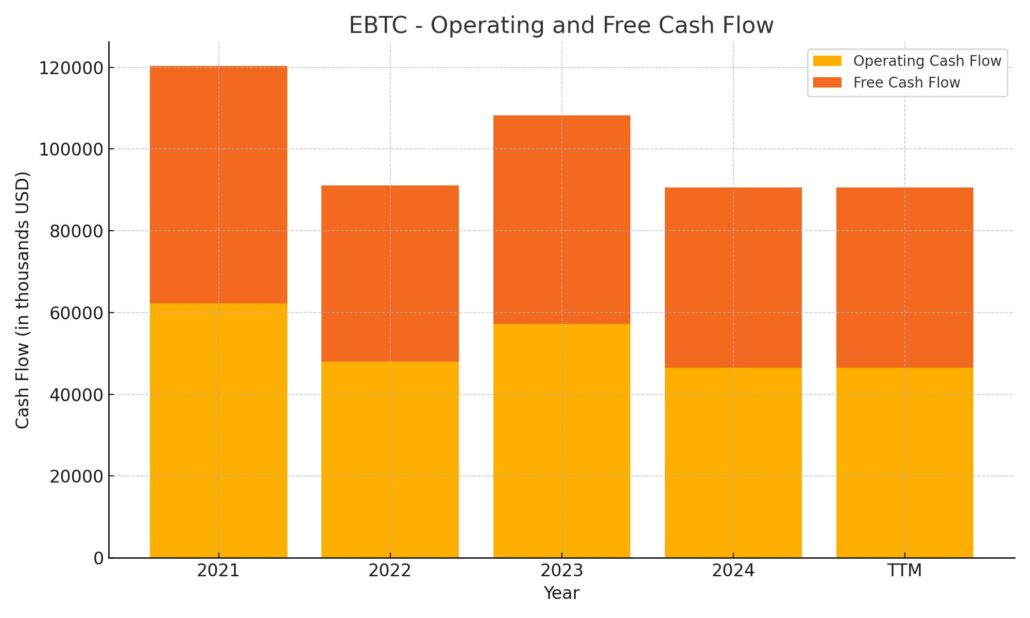
The real action was on the investing and financing sides. EBTC deployed over $346 million in investing activities, likely tied to loan growth and securities purchases typical of a growing regional bank. To fund this, the company leaned into financing, raising over $327 million—driven largely by $183.8 million in new debt issuance. While that’s a sharp increase compared to previous years, it aligns with a strategic expansion and liquidity positioning. The year also saw $56 million in debt repayments, showing they’re not over-leveraging. The result is a year-end cash position of nearly $84 million, a solid buffer that reflects thoughtful balance sheet management amid active capital deployment.
Analyst Ratings
Enterprise Bancorp (NASDAQ: EBTC) has recently attracted fresh attention from analysts. 🧐 StockNews.com initiated coverage with a “Hold” rating, signaling a more neutral stance on the stock’s short-term direction. This isn’t a downgrade or an endorsement—it simply reflects an expectation that the stock will perform in line with the broader market, at least for now.
The decision to begin coverage with a Hold rating likely stems from the bank’s steady but not flashy performance. EBTC currently trades at a price-to-earnings ratio of around 11.15 and has a beta of 0.56, suggesting lower volatility than the overall market. Metrics like return on equity, sitting at 11.15%, and a net profit margin over 15% show solid fundamentals, but analysts may be waiting for a stronger growth catalyst before shifting sentiment one way or the other. 📊
At the moment, there is no published consensus price target for EBTC. That may simply be a result of limited analyst coverage typical for smaller regional banks rather than a reflection of the company’s performance. As earnings unfold and the company continues its growth strategy, more clarity could emerge, potentially drawing greater analyst attention. 🔍
Earnings Report Summary
Solid Start to the Year
Enterprise Bancorp kicked off 2025 on a steady note, reporting net income of $10.4 million for the first quarter. That came out to $0.84 per diluted share, a healthy improvement over the same period last year when they posted $8.5 million, or $0.69 per share. It was just a touch below the previous quarter, which came in at $0.86 per share, but still represents strong overall momentum.
What really stood out was the increase in net interest income. It rose 10% from last year, landing at $38.7 million. That gain was fueled in large part by a $6.6 million bump in loan interest income. In a rate-sensitive environment, that’s no small feat. The bank’s net interest margin also moved in the right direction, ticking up to 3.32% from 3.29% in the fourth quarter and 3.20% a year ago.
Lending Growth and Capital Strength
Loan growth remained solid, with total loans reaching $4.05 billion—a 1.7% increase for the quarter. That signals healthy demand and shows the bank is actively deploying capital where it sees opportunity. On the deposit side, there was a slight dip of about 0.9%, bringing customer deposits down to $4.15 billion. Wealth assets under management also pulled back a bit to $1.51 billion.
Operating expenses rose during the quarter, mainly from higher salaries and merger-related costs. Non-interest income took a small hit, down 6% to $5.2 million, mostly because of lower gains from equity securities. Even with those headwinds, the bank’s total assets nudged higher to $4.90 billion, and shareholders’ equity climbed to $385.4 million—a 7% lift.
Stable Credit and a Look Ahead
Credit quality remained consistent, which is exactly what you’d want to see in this kind of lending environment. The allowance for credit losses held at $64 million, or 1.58% of total loans. Non-performing loans edged up slightly to $28.5 million, now making up about 0.70% of the loan book, but nothing alarming.
Leadership also touched on the bank’s pending merger with Rockland Trust Company. The shareholder vote already passed in early April, and now the focus shifts to integration planning. CEO Steven Larochelle highlighted strong loan activity and rising interest income as key wins for the quarter. Executive Chairman George Duncan sounded confident about the upcoming merger, noting the positive response from customers and the community, as well as the cultural fit between the two institutions.
Enterprise looks to be in a solid spot. The first quarter brought steady growth, controlled risk, and a clear direction going forward—especially with the merger expected to close in the second half of the year.
Chart Analysis
Price and Moving Averages
Looking at EBTC over the past year, the overall trend has been encouraging with a notable uptrend from mid-year through early spring. After a relatively flat start, the stock picked up momentum around late July, breaking above both its 50-day and 200-day moving averages. This bullish crossover held strong until early April, when some profit-taking or broader market softness pulled the price below the 50-day line. Despite this pullback, the stock remains above its 200-day moving average, which continues to trend upward—suggesting the broader trend is still intact.
The decline in the 50-day moving average in April shows a cooling of recent momentum, but not a reversal. The recent rebound from around $33 back toward the mid-$36 range shows buyers are stepping in near support, and the price is now approaching the underside of the 50-day average again. That’s a spot to watch—how the stock behaves here may set the tone for the next leg.
Volume Activity
Volume has been relatively quiet for most of the year, with the exception of a couple of spikes that may have been related to earnings or corporate announcements. There’s no evidence of panic selling, even during recent dips, which supports the idea that this has been a healthy consolidation rather than a breakdown. The periods of accumulation in late summer and fall were backed by modest volume increases, adding credibility to those price gains.
Relative Strength Index (RSI)
RSI has mostly hovered in the middle zone this past year, moving between overbought and oversold conditions without many extremes. Recently, it dipped near 30 but bounced quickly, suggesting that selling pressure may have hit a short-term bottom. It’s now rising toward neutral territory, which reflects the mild recovery in price over the past couple of weeks. During the stronger rallies in late 2023 and early 2024, RSI consistently reached higher levels without lingering in overbought zones too long—another positive sign of controlled upward momentum rather than excessive enthusiasm.
General Outlook
From a technical standpoint, EBTC still sits comfortably within a longer-term upward trend. The short-term weakness in April hasn’t damaged the bigger picture, especially since the 200-day average remains solidly rising. The stock’s recovery off recent lows shows resilience, and if it can reclaim the 50-day moving average, that could mark a fresh leg higher. Even if that takes time, the structure remains healthy and supported by a rising base of long-term moving averages.
Management Team
Enterprise Bancorp has long benefitted from steady, relationship-driven leadership that remains closely tied to the communities it serves. At the helm is CEO Steven Larochelle, who stepped into the role with a focus on strategic expansion while maintaining the local banking culture that has defined the institution for decades. He’s a known quantity inside the company, having worked across various leadership roles before taking over as chief executive. His understanding of both the numbers and the neighborhoods gives the bank a unique edge as it grows.
Executive Chairman George Duncan continues to play a significant role in shaping the broader vision of the company. Duncan founded the bank and has remained a guiding influence, especially as the bank moves through its upcoming merger with Rockland Trust. His long-standing presence ensures continuity and reinforces a focus on long-term value over short-term gains. The rest of the management team blends deep institutional knowledge with a willingness to evolve, seen in the bank’s embrace of tech-forward initiatives without losing sight of personalized service. That balance of tradition and adaptation is one of Enterprise’s less tangible but more powerful competitive advantages.
Valuation and Stock Performance
Over the past twelve months, EBTC shares have delivered an impressive run, rising more than 50 percent and reaching a high of 44.41 before recently settling around the 37 dollar range. This move came alongside strong earnings growth, increased lending activity, and firm expense control, which together drove investor confidence.
From a valuation standpoint, the stock is still reasonably priced. The trailing price-to-earnings ratio sits just above 11, and the stock trades at about 1.2 times book value. That’s not a deep discount, but it’s far from expensive, especially when compared to peers in the regional banking space. The price-to-sales ratio is also in check, suggesting investors are getting real value relative to revenue.
The 200-day moving average remains in an upward trend, which is often seen as a sign of long-term strength. Although the stock recently slipped below the 50-day moving average, that move appears to be part of a normal cooling-off period rather than the start of a sustained decline. Investors seem to be consolidating gains, not heading for the exits.
Add in the modest beta of 0.55 and you’ve got a stock that generally holds up well when markets get choppy. While that might not excite short-term traders, it should appeal to those who value stability and consistent capital appreciation over time. The share performance has aligned well with the company’s financial results—no speculative spikes, just a steady climb supported by real numbers.
Risks and Considerations
Like any financial institution, Enterprise Bancorp isn’t without its risks. One of the more immediate considerations is the pending merger with Rockland Trust. While the deal is expected to bring scale and synergies, the integration phase always carries execution risk. Cultural alignment, technology platforms, and customer retention all become areas that require careful navigation. Fortunately, management has emphasized early planning and clear communication, which should ease some of that uncertainty.
Interest rate volatility is another factor worth watching. While the bank has managed its net interest margin effectively so far, changes in rate policy can affect lending dynamics and deposit behavior. EBTC’s loan growth has been strong, but any sustained rate pressure or shifts in consumer credit quality could weigh on margins. Additionally, although credit metrics remain healthy, the slight uptick in non-performing loans is a reminder that the current credit cycle may be approaching a more cautious phase.
Another potential concern is limited analyst coverage. This can lead to underappreciation in the market and potentially higher volatility around earnings announcements. That said, the flip side of low coverage is that there’s often more room for upside as more institutional investors start to take notice.
Lastly, EBTC operates in a relatively concentrated regional market. While that gives it a deep understanding of its customer base, it also limits diversification. Economic slowdowns or regulatory changes that affect its footprint in Massachusetts or southern New Hampshire could have a disproportionate impact compared to more nationally diversified banks.
Final Thoughts
Enterprise Bancorp has quietly positioned itself as a well-run, community-focused bank with strong fundamentals and a clear growth trajectory. The management team blends long-standing leadership with operational discipline, and the upcoming merger with Rockland Trust represents a meaningful next step in its expansion story. Despite its size, EBTC has delivered returns and stability that many larger institutions would envy.
Valuation remains reasonable, especially when factoring in the consistency of earnings and the bank’s commitment to maintaining a shareholder-friendly approach. Risks are present, as they are with any bank, but they seem manageable in the context of the company’s track record and leadership team’s experience.
The past year has shown what the company is capable of when loan demand is healthy, interest income is rising, and costs are kept under control. The market has responded with confidence, and while the stock has pulled back slightly from its highs, it still trades in a range that reflects belief in the business, not just momentum.
This is a name that’s stayed true to its local roots while finding a way to grow without compromising on the basics. As it moves through 2025 and beyond, the focus will remain on solid execution, smart lending, and delivering value to shareholders one quarter at a time.