

Key Takeaways
💰 Dividend yield sits at 2.89% with steady annual increases around 3–4%, supported by a 75% payout ratio typical for regulated utilities.
💵 Operating cash flow remains strong at $4.49 billion TTM, though free cash flow is negative due to elevated capital expenditures.
📊 Analysts maintain a Moderate Buy rating with a consensus price target of $91.50, citing strong earnings and regulatory clarity.
📈 First-quarter earnings beat expectations with $0.82 EPS, driven by industrial demand growth and disciplined cost control.
Last Update: 5/1/25
Entergy Corporation (ETR) operates as a regulated utility serving over 3 million customers across the southern United States. The company’s core strength lies in its stable cash flows, disciplined management, and consistent dividend track record. With a growing industrial base, long-term infrastructure investments, and constructive relationships with regulators, Entergy has positioned itself to deliver reliable returns while adapting to the evolving energy landscape.
Over the past year, the stock has climbed more than 55%, supported by stronger earnings, increased demand, and favorable regulatory outcomes. Backed by experienced leadership and a clear capital plan, Entergy continues to balance growth investments with dependable income for shareholders.
Recent Events
ETR has made quite a move lately, climbing roughly 55% over the past year. That’s a big step up from its 52-week low of $52.06 to a recent close of $83.17. The run-up isn’t purely momentum—it’s backed by improving fundamentals.
Earnings are up dramatically. In fact, the most recent quarter saw a jaw-dropping 379% year-over-year jump in earnings per share. That kind of surge isn’t something you can expect every quarter—it was fueled by one-time factors—but it still reflects real progress in operational efficiency and cost control.
The next dividend payout is already locked in for June 2, 2025, and the ex-dividend date is right around the corner on May 2. So, for investors seeking income, now’s the time to lock in eligibility for that next payment.
Entergy continues to invest heavily in its infrastructure, which means capital spending is high. That’s why we’re seeing negative free cash flow of around $2.24 billion, even though operating cash flow remains solid at $4.5 billion. With over $30 billion in total debt, the company is carrying a heavy load—but for a utility, that’s nothing out of the ordinary.
Key Dividend Metrics
📈 Forward Yield: 2.89%
💵 Annual Dividend (Forward): $2.40
📉 5-Year Average Yield: 3.72%
🎯 Payout Ratio: 75.28%
🧱 Dividend Date: June 2, 2025
🚨 Ex-Dividend Date: May 2, 2025
🔁 Last Split: 2-for-1 on December 13, 2024
Dividend Overview
At today’s price, ETR offers a dividend yield of 2.89%, a touch under the 3% level many dividend investors like to see. It’s also noticeably below its five-year average yield of 3.72%, which tells us that the stock has appreciated more quickly than the dividend has grown. That’s not a bad problem—it often signals renewed investor confidence in the business.
The current annual dividend sits at $2.40 per share, and payments have come like clockwork. There’s been no interruption in the schedule, and the company has made a habit of raising the payout every year. That speaks to a strong dividend culture and disciplined management that knows its investor base values consistency.
The payout ratio is hovering around 75%. That might seem high in a vacuum, but for a regulated utility, it’s quite normal. These businesses typically operate with higher payout ratios because their revenues are predictable, and they aren’t reinvesting earnings in aggressive growth projects like tech companies might. What they’re building—power lines, substations, generation facilities—is long-term, cash-generating infrastructure.
Margins are healthy too, with operating margin at 24.6%. That leaves some breathing room if inflation flares up or if interest rates cause turbulence in the debt markets.
Dividend Growth and Safety
Let’s talk growth first. Entergy doesn’t post headline-grabbing dividend hikes, but it has delivered steady increases in the 3% to 4% range over the past several years. That’s enough to keep pace with inflation and signal confidence in the long-term earnings power of the company.
Cash flow supports the story. Despite the dip into negative free cash flow due to investment spending, Entergy generated $4.5 billion in operating cash flow over the past twelve months. That’s a strong foundation to keep the dividend flowing, even if capex remains elevated for a while.
Now, the debt load. With nearly $31 billion in total debt and a debt-to-equity ratio near 200%, Entergy is certainly leveraged. But that’s part of the business model for utilities. They rely on long-term, low-cost borrowing to fund infrastructure, and their steady revenues help them service that debt without much drama. The company also has strong access to capital markets, which gives them room to maneuver if conditions change.
Its beta of 0.55 tells you a lot. This isn’t a stock that swings with the market. It’s calmer, quieter, and built to provide stability. For dividend investors, especially those looking for income preservation, that matters.
Institutional investors seem to agree. Over 95% of the stock is held by institutions, and insider ownership is minimal. That kind of ownership profile tends to align with a long-term, income-focused investor base—less trading, more holding.
Short interest has ticked up slightly, sitting around 3% of the float. That’s not alarming, but it’s something to keep an eye on as the year unfolds.
In short, Entergy continues to look like what it’s always been: a slow-and-steady utility that respects its dividend, invests for the future, and marches forward regardless of market noise.
Cash Flow Statement
Entergy’s trailing 12-month cash flow profile reflects the heavy capital intensity typical of regulated utilities. Operating cash flow came in strong at $4.49 billion, showing solid cash generation from core operations—an uptick from the previous year’s $4.29 billion. However, capital expenditures exceeded $5.96 billion, pushing free cash flow into negative territory at -$1.48 billion. This isn’t unusual for a utility in the middle of major infrastructure upgrades, but it does highlight the reliance on external financing to bridge the gap.
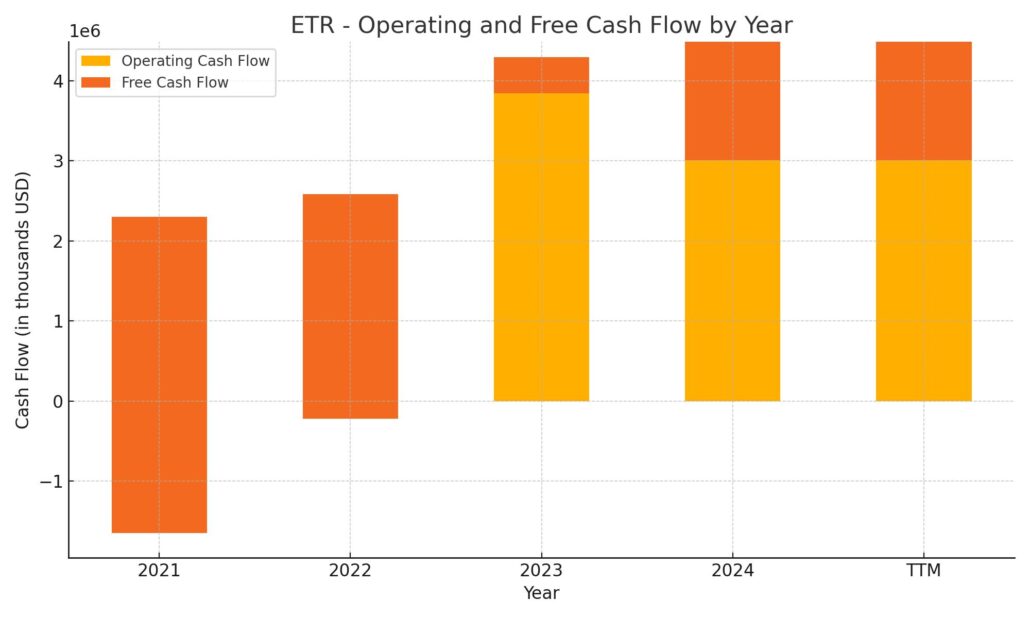
On the financing side, Entergy raised nearly $7.9 billion in new debt while repaying about $5.05 billion, leading to a net inflow from financing activities of just over $2 billion. This helped support both investment spending and dividend payments without eroding the company’s cash position. As a result, ending cash stood at $859 million—significantly higher than in prior years. The cash flow pattern shows a utility leaning into its long-term growth plan while maintaining enough financial flexibility to keep its income commitments intact.
Analyst Ratings
Entergy Corporation has recently seen a wave of analyst updates that suggest growing optimism around its direction and fundamentals. 📈 BMO Capital boosted its price target from $89 to $93 while maintaining an Outperform rating. The upgrade came on the heels of stronger-than-expected Q1 earnings and a clearer outlook on the company’s capital plan and earnings trajectory. The analysts pointed to improved visibility on future cash flows and operational efficiency as key drivers behind their more bullish stance.
🏷️ Barclays followed suit with its own adjustment, nudging the price target up to $91 from $88. Their update was driven by Entergy’s ability to control costs and capitalize on rising electricity demand, especially as industrial activity expands in its core service areas. These tailwinds seem to be feeding directly into the bottom line, giving the market more confidence in Entergy’s ability to maintain and grow its dividend.
🎯 The average 12-month analyst price target now sits around $91.50, with estimates ranging from $82 on the low end to $98 on the high end. That signals moderate upside from where the stock is currently trading. Analysts remain generally constructive, with the consensus rating sitting at a Moderate Buy. The focus now is on how well Entergy executes its infrastructure strategy and manages rising capital expenditures without disrupting its payout rhythm.
Earnings Report Summary
Strong Start to the Year
Entergy came into 2025 with some momentum, and that showed up in their first-quarter numbers. Adjusted earnings per share landed at $0.82, which came in ahead of expectations and showed clear progress compared to the same period last year, when it was $0.54. While revenue for the quarter was around $3.02 billion—just a touch under what analysts were looking for—the real story was in how the company managed to drive earnings higher despite that.
One of the bright spots was the growth in industrial sales, which jumped 9.3%. That kind of increase speaks to the strength in demand from sectors Entergy serves, especially along the Gulf Coast where large-scale industrial projects continue to expand. Retail sales, when adjusted for weather, were up 5.2%, adding another layer of steady volume growth.
What Management Is Saying
CEO Drew Marsh sounded upbeat about how the year is shaping up. He pointed to a combination of operational performance and regulatory progress as reasons to stay optimistic. He also emphasized the company’s focus on delivering value to customers while continuing to invest in long-term growth. CFO Kimberly Fontan reinforced that message by reiterating the full-year earnings guidance of $3.75 to $3.95 per share—showing confidence in the stability of the business.
Looking Ahead
Entergy isn’t just sitting back and riding current demand. The company is making moves that are clearly aimed at the future. A couple of recent regulatory wins have cleared the way for important infrastructure upgrades, particularly around transmission. At the same time, Entergy completed the sale of its gas distribution operations in East Baton Rouge Parish, a move that’s in line with its plan to sharpen focus on core electric operations and free up resources.
There’s also continued emphasis on modernization. Entergy is putting capital to work in ways that are expected to improve reliability and prepare the grid for a more distributed energy future. That’s not just about keeping the lights on—it’s about making sure the company is well-positioned to grow earnings without taking on undue risk.
All in, the first quarter gave a solid foundation for the rest of the year. With steady industrial demand, a clear regulatory path, and leadership staying focused on execution, Entergy looks like it’s running with discipline and a long-term view.
Chart Analysis
Steady Climb with Support from Moving Averages
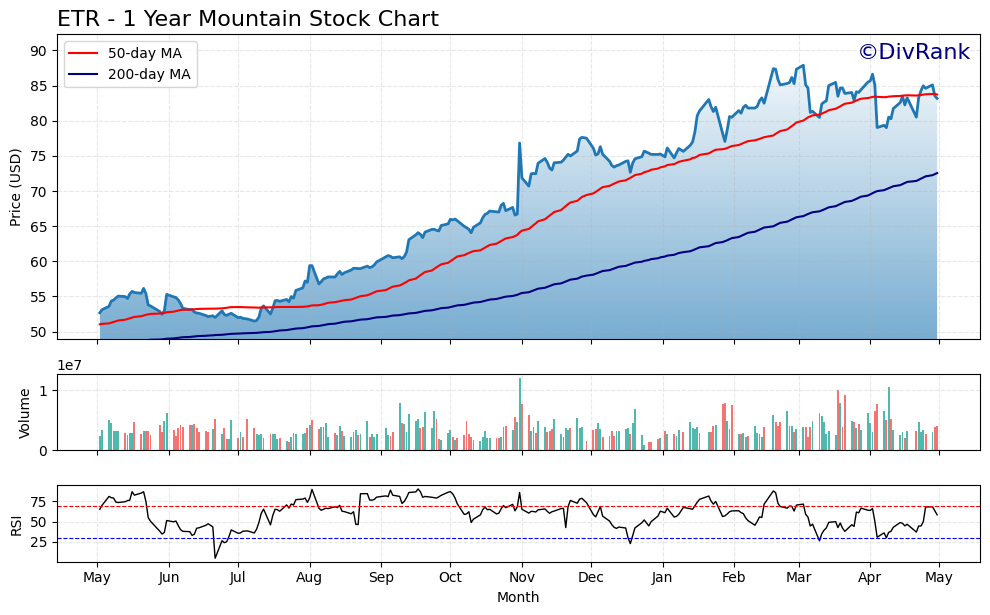
ETR has shown a well-structured climb over the past year, moving from around $52 to recent highs near $88 before a minor pullback. The price has consistently stayed above the 200-day moving average, which has risen smoothly throughout the year—an indication of long-term strength. The 50-day moving average has also tracked closely with the stock, and even during dips, ETR found support near this line before resuming its upward trend.
The recent slip below the 50-day average might raise a few eyebrows, but this kind of consolidation isn’t out of the ordinary after a run of this length. With the 200-day average still pointing upward and far below the current price, the long-term momentum appears intact.
Volume and Market Participation
Looking at volume, there’s no sign of panic selling. Spikes in volume earlier in the climb—particularly around August and again in March—suggest periods of accumulation and possible institutional interest. Even during short-term drops, volume didn’t balloon in a way that signals major distribution. Instead, most red volume bars appear balanced by green ones, which reflects steady interest throughout the rise.
Relative Strength Index (RSI) Perspective
The RSI has hovered near the overbought line several times over the past year, touching above 70 on multiple occasions before retreating slightly. That shows strength, but also some heat. Recently, the RSI dropped toward the mid-50s, indicating the stock has cooled off a bit without entering oversold territory. This gives the chart a bit of breathing room for the next leg, should buyers return.
Overall, ETR’s chart paints the picture of a strong, stable trend with manageable pullbacks, consistent demand, and healthy support from long-term averages. The setup remains constructive as long as price respects the broader trend anchored by the rising 200-day line.
Management Team
Entergy’s leadership team continues to focus on long-term value, grid modernization, and reliability across its service regions. Drew Marsh, who stepped into the CEO role in 2022, has spent over two decades with the company and has brought consistency while advancing strategic investments. His experience within Entergy gives him a strong understanding of operational challenges and regulatory landscapes, and he’s kept the company on a disciplined path through periods of volatility.
Supporting him, CFO Kimberly Fontan has been a key figure in navigating Entergy’s current investment-heavy phase. She’s focused on preserving financial flexibility, even as capital spending and debt levels remain high. Her communication with the market has been clear and measured, especially when reinforcing earnings guidance and balancing investor expectations with the reality of regulated operations. The overall leadership team has shown a practical and methodical approach, keeping pace with industry changes while maintaining Entergy’s identity as a dependable operator.
Valuation and Stock Performance
Entergy’s stock has made a meaningful move over the last year, climbing from the low $50s to recent highs near $88. That’s a gain of more than 55% and reflects both improved earnings performance and a stronger market view of the utility sector overall. Despite the rally, the valuation doesn’t feel stretched. The forward price-to-earnings ratio sits around 21.5 times, which is reasonable for a regulated utility with stable cash flow and a steady dividend. The trailing P/E is higher, around 26.9, due to earlier compressed earnings, but that should ease as earnings continue to normalize.
Looking at other measures, Entergy’s price-to-book is around 2.36 times. That’s slightly higher than its longer-term average, but it reflects the quality of its regulated assets and confidence in future returns. The PEG ratio, which blends valuation with expected growth, is around 1.5—a middle-of-the-road number that suggests fair pricing for the earnings trajectory ahead.
From a technical standpoint, the stock has held up well. The 50- and 200-day moving averages have provided support throughout the year, and even during short-term pullbacks, buying interest returned fairly quickly. Analyst sentiment has gradually turned more favorable, with a consensus 12-month price target around $91.50. That suggests modest upside from here but also signals that the stock is close to fairly valued.
Risks and Considerations
While Entergy’s regulated model offers predictability, it also introduces some unique risks. Rate cases and regulatory approval processes are part of the day-to-day, and any shift in how regulators evaluate cost recovery or allowable returns could pressure earnings. Entergy has generally maintained positive relationships with regulators, but there’s always the potential for less favorable rulings or delays.
The company’s balance sheet carries a heavy load of debt—around $31 billion—resulting in a debt-to-equity ratio that approaches 200 percent. That kind of leverage is normal for a utility, especially one investing in long-term infrastructure, but it does limit financial flexibility and increases sensitivity to interest rate changes. As rates rise, refinancing or new borrowing could become more expensive, putting pressure on margins.
Free cash flow is another area to watch. Entergy has posted negative free cash flow over the trailing twelve months, mainly due to capital expenditures. Operating cash flow remains strong, but if investment needs continue at this pace, the company will have to remain reliant on external financing or dip into reserves. For now, the balance is manageable, but it’s a number that bears monitoring.
Environmental risks are also part of the picture. Entergy operates in the Gulf Coast, a region prone to hurricanes and other severe weather events. Although the company has improved its grid resilience and storm recovery planning, outages and storm-related costs remain unpredictable.
There’s also the evolving energy landscape. Distributed solar, energy storage, and changing consumption patterns all pose potential shifts in demand. If load growth slows unexpectedly or new technologies reshape customer behavior faster than expected, it could change how traditional utilities operate and earn.
Final Thoughts
Entergy has spent the past few years building toward a more modern, resilient utility operation, and that effort is showing up in results. The combination of regulated cash flows, solid operational execution, and a stable dividend policy makes for a dependable holding. It’s not built for rapid gains or speculative upside—but that’s not the goal. Instead, the focus here has been steady execution and balancing future growth with present-day performance.
The dividend continues to be well covered, even if payout ratios are on the higher end for some tastes. But in the context of the utility sector, those levels are right in line with expectations. The company’s investments in grid upgrades and transmission capacity position it well for the next decade, especially as energy demand rises and infrastructure ages across the country.
The stock’s price has moved up, but it still offers a measured opportunity for further growth. The market has taken notice of Entergy’s improved fundamentals, but hasn’t priced in excessive optimism either. It’s a name that trades on reliability and follow-through more than flash, and that’s exactly how the company has performed.
For those looking at consistency, income, and a management team with a clear direction, Entergy continues to stand on solid ground.