

Key Takeaways
📈 EMN offers a forward dividend yield of 4.31% with 14 consecutive years of dividend growth and a conservative payout ratio of 41.78%, signaling both strength and room for continued increases.
💵 The company generated $1.14 billion in operating cash flow over the trailing twelve months, with $575 million in free cash flow—supporting dividend stability and debt reduction efforts.
📊 Analyst sentiment is mixed, with recent downgrades due to near-term demand concerns, but the consensus 12-month price target remains at $99.15, indicating potential upside from current levels.
📉 First quarter earnings showed EPS growth of 19% year-over-year despite a slight dip in revenue, with leadership emphasizing cost control, sustainability investment, and reduced capital expenditures for 2025.
Last Update: 5/1/25
Eastman Chemical Company (EMN), a global leader in specialty materials, has built a strong reputation through its disciplined leadership, steady cash flow, and long-term focus on innovation and sustainability. The company operates across a diversified portfolio, serving industries such as automotive, construction, and consumer goods. Backed by over a century of industrial experience and a CEO who has prioritized operational efficiency and capital discipline, Eastman has remained committed to shareholder value, even amid macroeconomic headwinds and shifting global demand.
Despite recent challenges including supply chain disruptions, softer demand in key segments, and tariff-related pressures, EMN continues to deliver reliable dividends and maintain solid free cash flow. Trading well below its historical valuation metrics, with a forward yield above 4 percent and a payout ratio under 42 percent, the stock has drawn attention from income-focused investors. As Eastman advances its sustainability efforts and cost management strategy, it positions itself for long-term stability and potential upside.
Recent Events
The past year hasn’t been kind to Eastman’s stock. Shares have dropped about 20% over the last 12 months, sliding from a high of $114.50 down to around $77. It’s a move that’s clearly disappointed some investors, but from an income standpoint, it’s made the dividend more attractive. The yield has ticked up as a result, now sitting above 4.3%.
Digging into the latest quarterly update, the numbers were a bit of a mixed bag. Revenue dipped slightly, down 0.9% year-over-year, but earnings managed to rise over 10%. That tells us margins are holding up, even as the top line softens. Operating margin is hovering near 14%, and that’s not bad in a sluggish economic environment.
Net income came in at $922 million over the last twelve months, and earnings per share stood at $7.85. More importantly for dividend investors, cash flow stayed healthy. Eastman pulled in $1.14 billion in operating cash flow, and after all expenses, it still had $532 million in levered free cash flow. That gives the company room to not only pay its dividend, but also reinvest and chip away at its $5.1 billion in debt.
The balance sheet is in decent shape. A current ratio of 1.72 signals that short-term liquidity is not a concern, and while debt levels are on the higher side, that’s fairly typical for the industry. Management has made it clear they’re focused on paying down that debt, which should add a layer of long-term financial strength.
Key Dividend Metrics
📈 Forward Yield: 4.31%
💵 Annual Dividend (Forward): $3.32 per share
🔁 5-Year Average Yield: 3.22%
💰 Payout Ratio: 41.78%
📆 Most Recent Dividend Date: April 7, 2025
🔔 Ex-Dividend Date: March 14, 2025
📊 Dividend Growth Streak: 14 consecutive years
Dividend Overview
Eastman’s dividend story isn’t new, but it remains impressive. The company is currently offering a 4.3% forward yield, which is higher than both its five-year average and the broader market. That alone puts it on the radar for dividend-focused investors. And this isn’t one of those high-yielders with shaky fundamentals—the payout is supported by strong, consistent cash flow.
The dividend now sits at $3.32 per share annually, and even with the recent share price drop, management hasn’t blinked. In fact, Eastman has quietly built a reputation for reliability. They don’t overpromise, and they rarely underdeliver. The 41.78% payout ratio shows there’s still room to grow the dividend without putting stress on the company’s financials.
There’s also the matter of timing. The ex-dividend date was in mid-March, and the most recent payout hit accounts in early April. For those tracking yield opportunities in real-time, Eastman has kept a predictable schedule, which long-term investors tend to appreciate.
Dividend Growth and Safety
Eastman has been raising its dividend for 14 straight years. That kind of consistency is rare in the chemical sector, where earnings can swing with commodity prices and global demand cycles. Over the last five years, the dividend has grown at a pace of just over 6% annually. It’s not rapid, but it’s dependable.
What really stands out is the company’s discipline. Management has kept the payout ratio well below 50% even in tough years, giving them flexibility to deal with downturns. The current 41.78% figure tells us there’s still breathing room if earnings soften temporarily. And with over $1.1 billion in operating cash flow, the dividend looks well-covered from a cash perspective.
The company’s debt load, while significant, isn’t out of hand. Yes, $5.1 billion in total debt is a lot, but Eastman is generating enough free cash flow to keep chipping away at it. The current ratio above 1.7 also suggests there’s no near-term crunch on liquidity. The overall financial picture supports not only maintaining the dividend but potentially continuing the annual increases that have become a pattern.
Eastman doesn’t get much hype, and it’s unlikely to see a sudden surge in popularity. But that’s part of the appeal. It’s the kind of company that quietly does what it says it will—generate steady cash flow, return capital to shareholders, and keep the dividend train rolling. For long-term investors focused on income, that kind of quiet consistency is often the best story of all.
Cash Flow Statement
Over the trailing twelve months, Eastman Chemical generated $1.14 billion in operating cash flow, showing continued strength in its core business despite macro headwinds. While this figure has slightly pulled back from 2022 and 2021 levels, it’s more than enough to cover capital expenditures, which came in at $561 million. That leaves Eastman with $575 million in free cash flow, a solid position that supports ongoing dividend payouts and some balance sheet flexibility.
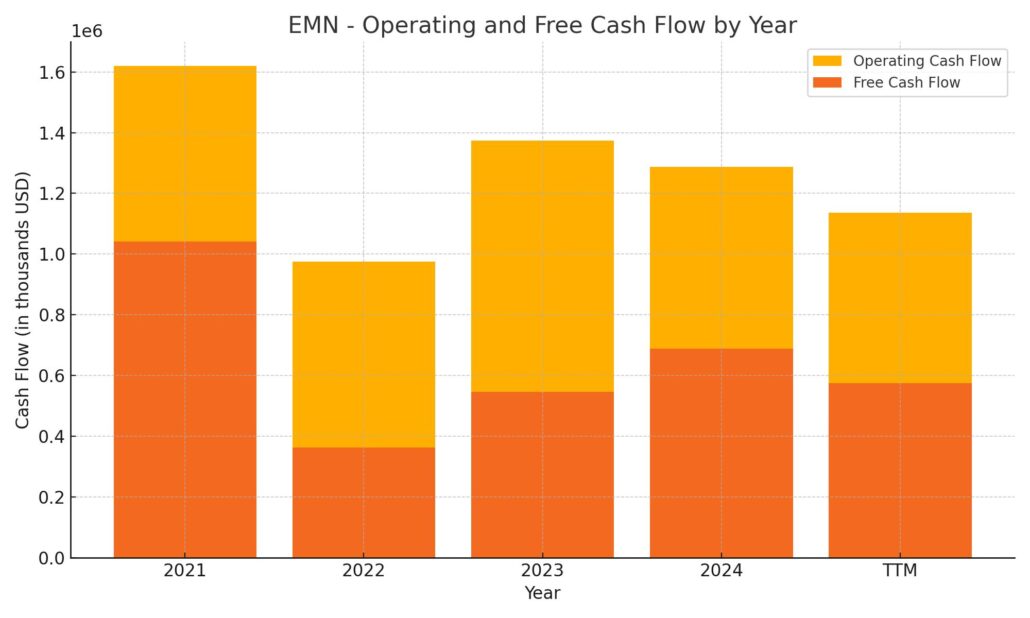
On the financing side, the company maintained a cautious stance. Debt issuance totaled just over $1 billion, but this was offset by $1.09 billion in debt repayments, reflecting a deliberate approach to managing leverage. No stock buybacks were recorded over the last year, signaling a focus on preserving capital. The year ended with $423 million in cash, down from $837 million at the end of 2023, primarily due to net outflows from financing activities. Overall, the cash flow picture reflects a stable, cash-generative business that is prioritizing debt management and sustaining shareholder returns.
Analyst Ratings
Eastman Chemical has seen a few shifts in analyst sentiment recently. 🟡 J.P. Morgan downgraded the stock from “Overweight” to “Neutral,” pointing to concerns about weakening seasonal demand, customer destocking trends, and the potential impact of renewed tariff pressures. 🔻 The firm noted that while Eastman remains fundamentally solid, near-term earnings visibility has become cloudier.
🟠 StockNews.com also revised its outlook, moving from “Buy” to “Hold.” This signals a more cautious approach in light of market headwinds and lackluster revenue growth. It’s not a call for panic, but rather a pause on enthusiasm as the company navigates a challenging macro backdrop.
🔵 On the more optimistic side, Morgan Stanley reiterated its confidence in Eastman’s long-term strategy, maintaining an “Overweight” rating despite trimming the price target from $125 to $115. That adjustment reflects revised growth assumptions rather than a shift in core conviction.
🟣 Piper Sandler also adjusted its numbers, dropping the target price from $105 to $99 while keeping a “Neutral” stance. They acknowledged that while Eastman is well-positioned longer term, it may need a few quarters to regain operational momentum.
🎯 The current consensus among analysts is a “Moderate Buy,” with a 12-month average price target of $99.15. That represents about 28% upside from the recent trading levels—suggesting that while sentiment has cooled, there’s still belief in a recovery path ahead.
Earning Report Summary
Eastman Chemical’s first quarter of 2025 had a few bright spots, even if the overall numbers didn’t blow anyone away. Adjusted earnings per share came in at $1.91, which was a solid improvement—about 19% higher than the same time last year. Revenue was a bit softer, down just under 1% to $2.29 billion. The dip was mostly tied to ongoing inventory reductions in their Fibers business and some currency-related headwinds overseas.
Leadership’s Take
CEO Mark Costa took a positive tone despite the mixed results. He pointed out that their Kingsport methanolysis facility ran at a record level of uptime and production, helping drive profitability. He also leaned into the company’s focus on innovation and operational efficiency as key themes going forward. While Eastman did pull back its full-year earnings guidance—largely because of trade and tariff uncertainty—they’re sticking with an expectation of around $1.2 billion in operating cash flow this year.
One important note from leadership was the decision to trim capital expenditures down to about $550 million. At the same time, they’re ramping up cost-cutting efforts with a target of $75 million in net savings. It’s a clear signal that management is tightening things up while keeping growth areas like sustainability firmly in focus.
Segment Performance
Not all parts of the business moved in the same direction. Additives & Functional Products saw a nice boost in revenue—up 4%—thanks to stronger sales in coatings and specialty fluids. Meanwhile, the Advanced Materials group slipped 4%, hurt by slower demand in automotive and construction markets. The Fibers segment was hit the hardest, with sales falling 13% as customers continued to reduce inventory levels. On the other hand, Chemical Intermediates delivered a 4% bump in revenue, thanks to improved pricing and demand for certain products.
Looking Ahead
Eastman isn’t sugarcoating the environment. The team knows the road ahead might be a bit bumpy, especially with geopolitical uncertainties and macroeconomic headwinds still in play. But they’re focusing on what they can control—generating cash, managing costs, and making smart investments. Their circular economy efforts, especially around plastics recycling at Kingsport, remain a big part of the long-term vision.
The message was clear: it’s not about chasing near-term growth at all costs. It’s about positioning the business for durability, especially in times like these.
Chart Analysis
Price Action and Moving Averages
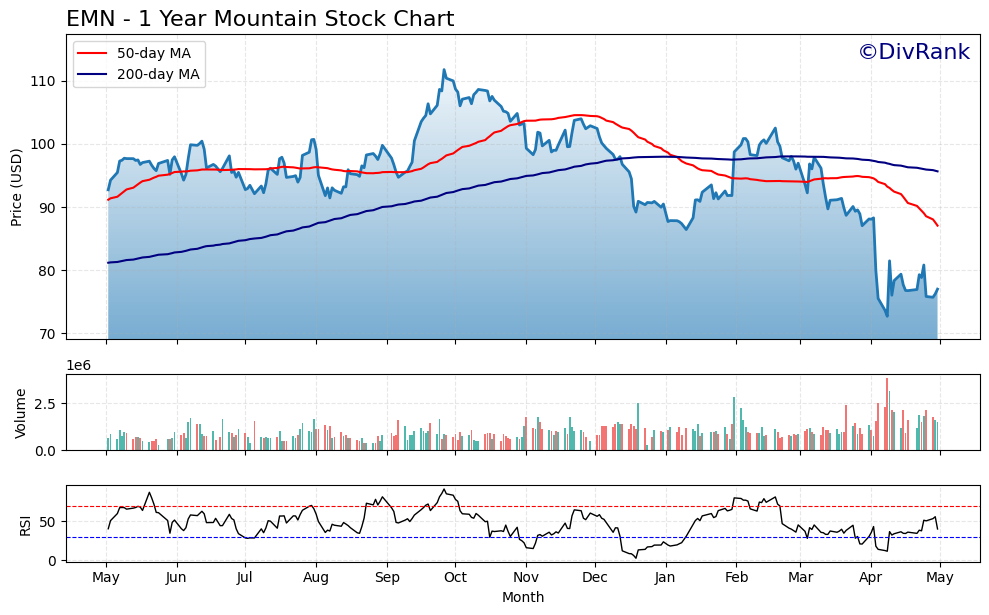
The chart for EMN over the past year shows a gradual shift from strength to sustained weakness. For much of the first half of the year, the stock traded above both its 50-day and 200-day moving averages, with a clear uptrend leading into a peak around late October. From there, the tone shifted. The 50-day moving average began curling downward in December and has remained in decline ever since, eventually crossing below the 200-day average in early February—a classic technical sign of a bearish phase.
This crossover, often referred to as a “death cross,” generally points to sustained downward pressure, and the price action confirmed it. Since then, EMN has struggled to regain footing, falling below both moving averages and trading closer to its 52-week lows through April and into early May. There’s been a slight bounce recently, but the price is still well under both trend lines, suggesting that any reversal will need more time and strength to develop.
Volume Trends
What stands out on the volume chart is the spike in trading activity during periods of sharp decline, especially in late March and early April. These heavy-volume sessions likely reflect institutional selling or broader risk-off sentiment. More recently, volume has remained elevated, even as the price attempted a bottoming pattern. While not necessarily bullish, it does hint at a market trying to find a new equilibrium—potentially a base, but not yet confirmation of one.
RSI Momentum
The Relative Strength Index (RSI) has spent a good amount of time hovering near or below the 30 line since late March, signaling that EMN was in deeply oversold territory. There was a brief attempt to recover in April, but the RSI failed to break meaningfully above neutral levels. Right now, it’s hovering just under the midpoint, implying that there’s no strong momentum either way. The absence of RSI divergence also suggests that a strong reversal is not yet underway.
Final Thoughts on the Setup
EMN’s chart reflects a stock that’s been under heavy pressure for several months. The sustained break below key moving averages, rising volume during sell-offs, and weak RSI momentum are signs of a market still searching for direction. While recent lows might offer some price support, the technical picture remains cautious until the stock can reclaim at least the 50-day average and show signs of consistent strength.
For now, it’s a chart that’s more about stabilization than growth, with signs that the worst of the selling could be behind it—but not enough evidence yet to say a new uptrend is in place.
Management Team
Eastman Chemical’s leadership has maintained a clear sense of strategic direction, even as the company navigates through macroeconomic turbulence. At the helm is Mark Costa, who has served as CEO and Board Chair since 2014. He brings a disciplined, long-term mindset to operations, balancing capital allocation, innovation, and sustainability in a way that feels methodical rather than reactive. Costa’s background in strategy and marketing shows through in how the company approaches its portfolio—continuing to divest non-core assets while reinvesting in high-margin, specialty segments.
The broader leadership bench also reflects experience across both operational execution and global markets. CFO Willie McLain has been consistent in emphasizing capital discipline, particularly in Eastman’s approach to debt management and shareholder returns. The team’s steady hand is evident in how they responded to recent pressures—reducing capex, preserving cash, and maintaining their dividend growth trajectory without overextending themselves financially. It’s not a group chasing headlines; rather, it’s one that prioritizes fundamentals and balance.
Their recent pivot to circular economy initiatives, including the expansion of chemical recycling facilities, highlights how the team is thinking forward. Instead of just riding out market cycles, they’re positioning the business to lead in sustainability over the next decade, which could create lasting value.
Valuation and Stock Performance
From a valuation standpoint, EMN is trading at what many would consider depressed levels. The trailing price-to-earnings ratio sits around 9.8, and even the forward P/E remains modest at just over 10. These are well below the broader market average and under Eastman’s own historical norms. When a company with Eastman’s cash flow and dividend track record starts to look this inexpensive, it often suggests either that the market expects continued pressure or that it’s overlooking the long-term earnings potential.
The stock is down roughly 20 percent over the past year, which stands in contrast to the overall market’s gains during the same period. This underperformance has largely come on the back of concerns over global industrial demand, especially in key end markets like automotive and construction. Add in trade tension fears, particularly around tariffs and geopolitical uncertainty, and it’s clear why sentiment has cooled.
Still, there are a few markers of resilience. Despite the drop, institutional ownership remains high, and the dividend yield has risen to over 4 percent, providing a cushion for investors. Moreover, the stock’s long-term trajectory shows that EMN has rebounded from similar drawdowns before, especially when margins stabilize and revenue begins to recover.
Another angle worth noting is the company’s enterprise value to EBITDA multiple, which currently hovers around 7.3—another indicator of undervaluation relative to peers. For investors with patience, these types of valuation levels don’t come around too often in a company of Eastman’s size and balance sheet strength.
Risks and Considerations
No investment is without its risks, and Eastman is no exception. One of the more pressing concerns is the continued softness in global manufacturing activity. If demand in core segments like transportation, building materials, and consumer durables remains weak, it could weigh on top-line growth well into next year.
There’s also the matter of debt. While the company generates enough cash to manage its obligations comfortably, total debt stands at just over five billion dollars. In a rising rate environment, even well-managed leverage can become a pressure point. The leadership team has been clear about its intent to reduce debt over time, but investors should keep an eye on this metric.
Geopolitical friction, especially trade disputes between major economies, presents another challenge. Tariff-related cost increases or supply chain disruptions could impact margins, particularly in the Chemical Intermediates and Advanced Materials businesses.
Then there’s execution risk with Eastman’s sustainability push. While the company’s circular economy investments are promising, they require capital and carry uncertainties—regulatory shifts, evolving consumer behavior, and adoption rates in global markets. If these initiatives take longer than expected to yield returns, it could affect capital efficiency metrics in the near term.
Lastly, sentiment around the chemical sector can swing based on broader commodity trends. Even though Eastman has pivoted away from commoditized products, it’s not entirely insulated from fluctuations in raw material costs or pricing pressures across its value chain.
Final Thoughts
Eastman Chemical isn’t the kind of stock that gets swept up in speculative moves. It’s a durable, cash-generative business with a track record of rewarding shareholders through consistent dividends and measured capital deployment. The current moment feels like one of those stretches where the market is leaning more into short-term noise than long-term fundamentals.
The management team remains focused, and their willingness to adjust—whether through capex cuts, supply chain optimization, or balance sheet discipline—shows that they’re not just sitting back and waiting for the cycle to turn. They’re proactively steering the ship toward the next phase of growth, even if it’s not immediately visible in the share price.
For investors focused on quality, sustainability, and a dependable income stream, Eastman continues to stand out. The recent drawdown, while uncomfortable, has created a setup where the yield is attractive, valuation is compressed, and the underlying business is still moving forward.
It’s not about chasing returns here. It’s about consistency, adaptability, and staying the course through cycles. And that’s exactly the kind of story Eastman Chemical is telling right now.