

Updated 4/21/25
Clearway Energy, Inc. (CWEN) operates a diverse portfolio of wind, solar, and natural gas assets across the United States, anchored by long-term power purchase agreements that provide steady, predictable cash flow. With a focus on clean energy infrastructure and disciplined capital management, the company offers a strong dividend profile, currently yielding around 5.9%. Leadership, headed by CEO Craig Cornelius, has guided Clearway through strategic growth, including over 1 gigawatt of new capacity added in the past year. Despite some recent earnings volatility, cash generation remains robust, supporting consistent dividend increases and a clear roadmap for long-term shareholder value.
Recent Events
Clearway’s stock has had a bit of a comeback over the past year. From a 52-week low of $22.61, it’s climbed back up toward $31, showing about a 27% gain over that stretch. It hasn’t been a smooth ride, though. In just one recent trading session, CWEN dropped nearly 6%, which hints at some underlying investor nervousness—possibly linked to rate sensitivity or broader concerns about clean energy project funding.
The latest earnings release showed a steep decline in year-over-year net income growth, down nearly 92%. But context matters here. Earnings aren’t the main story for a business like this. Cash flow is what counts, and Clearway continues to deliver on that front. Over the past year, the company brought in $770 million in operating cash flow and $694 million in levered free cash flow. That’s more than enough to comfortably support the dividend.
Debt levels are high, with total debt of $7.76 billion and a debt-to-equity ratio around 139%. It’s a capital-heavy business model, so that level of leverage isn’t out of the ordinary. But it’s still something to keep an eye on, especially if refinancing becomes more expensive. Despite the leverage, Clearway holds a decent liquidity cushion, with $367 million in cash and a current ratio of 1.49—strong enough to meet short-term obligations.
Market perception remains mixed. While CWEN’s stock is still above its 200-day average, the 50-day moving average is a bit higher than where it’s currently trading, suggesting some recent pressure. However, the overall upward trend from last year points to a market that sees value in Clearway’s stable income profile, even if it’s not without risk.
Key Dividend Metrics
📈 Forward Dividend Yield: 5.90%
💰 Forward Annual Dividend Rate: $1.72 per share
🧮 Payout Ratio: 220.61% (earnings-based)
📆 Most Recent Dividend Date: March 17, 2025
⚠️ Ex-Dividend Date: March 3, 2025
📊 5-Year Average Dividend Yield: 4.79%
⏳ Trailing Annual Dividend Yield: 5.66%
Dividend Overview
A yield approaching 6% is hard to ignore—especially when it comes from a company that isn’t trying to reinvent itself every quarter. Clearway’s payout is backed by real cash generation, even if the official earnings-based payout ratio looks high. With $1.72 per share in dividends expected this year and over $770 million in operating cash flow, the dividend is far from stretched.
It’s also worth noting how the market values this income. The average dividend yield over the last five years sits at 4.79%, so today’s yield is coming at a bit of a premium. That can be viewed two ways: the market is demanding a higher return because of perceived risks, or it’s a rare opportunity to lock in a higher-than-usual yield from a company with a history of stable payouts.
Institutional investors seem to be leaning toward the latter. Over 90% of shares are held by institutions, which often signals a certain level of confidence in the dividend’s sustainability. Meanwhile, short interest remains low, under 5% of the float, suggesting there’s not much of a bearish bet building up around this name.
Dividend Growth and Safety
Clearway hasn’t just been paying a dividend—it’s been raising it, slowly and steadily. Over the past year, the payout went from $1.65 to $1.72, a 4.2% increase. That kind of consistency is music to a dividend investor’s ears. It’s not aggressive, but it’s sustainable, and it’s in line with management’s stated goal of mid-single-digit growth each year.
What supports that growth? Long-term contracts and recurring cash flow. Clearway’s business model is built on power purchase agreements that often stretch 10 to 20 years, giving the company clear visibility on future revenue. That kind of predictability allows for disciplined capital allocation and steady dividend increases.
Even with the high payout ratio based on earnings, Clearway’s dividend safety is better judged through cash flows. With levered free cash flow of nearly $700 million and a relatively modest dividend obligation, there’s a comfortable buffer. That’s especially important as Clearway continues to manage its debt load.
Of course, interest rates and refinancing risk are always a factor in the utility space, and Clearway is no exception. But even with these headwinds, the underlying cash generation supports the dividend and leaves room for growth if rates ease up.
For investors looking to add some income stability to their portfolios—especially those who appreciate renewable energy’s long-term promise—Clearway offers a compelling mix. The yield is real, the cash flows are durable, and the company’s dividend strategy is about as straightforward as it gets.
Cash Flow Statement
Clearway Energy reported $770 million in operating cash flow over the trailing twelve months, consistent with the prior year and reflective of its stable, contract-driven revenue base. This reliable stream of operating income has kept the company on solid footing, helping it maintain consistent dividend payments while navigating fluctuations in energy markets and capital costs.
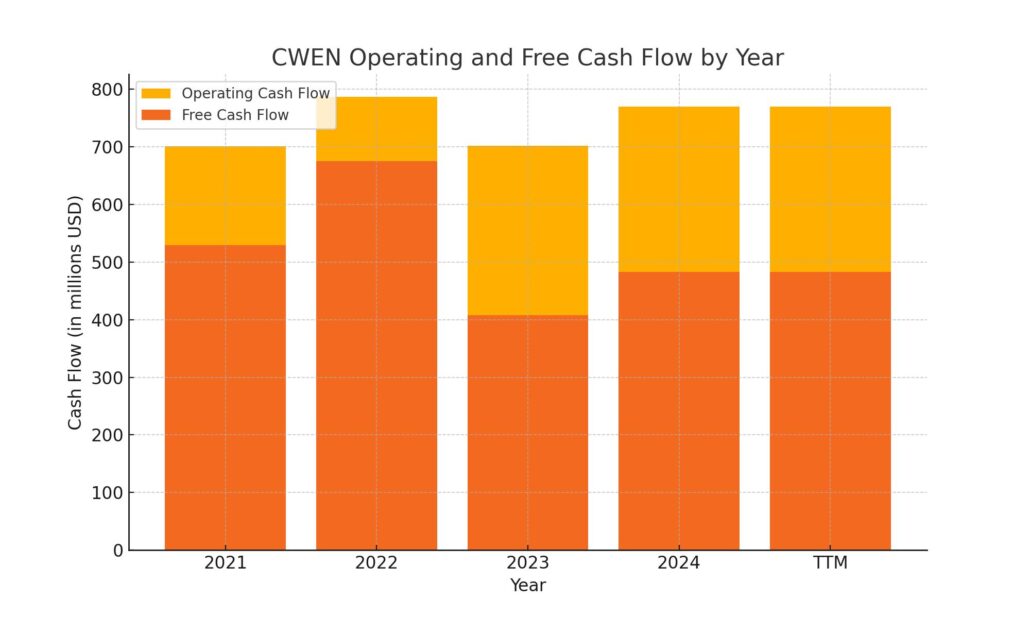
On the investing side, the company used $725 million, largely directed toward ongoing infrastructure and renewable project investments. Financing activities drew down another $363 million, with interest payments totaling $324 million. Despite those outflows, Clearway maintained a strong cash position of $733 million at year-end. Free cash flow stood at $483 million, comfortably covering its dividend and supporting the case for steady income delivery to shareholders.
Analyst Ratings
🟢 Clearway Energy has recently attracted positive attention from analysts, with several firms initiating or reiterating favorable ratings. On March 25, 2025, Deutsche Bank began coverage with a “Buy” rating and set a price target of $38.00, reflecting confidence in the company’s renewable energy assets and stable cash flows. Earlier, on February 25, Roth MKM reaffirmed their “Buy” rating and increased their price target from $33.00 to $34.00, indicating optimism about Clearway’s financial performance and dividend sustainability.
📊 The consensus among analysts is notably positive. All six analysts covering the stock have issued “Buy” ratings, with no “Hold” or “Sell” recommendations. The average price target stands at $34.71, suggesting an approximate 18.89% upside from the current trading price. This consensus reflects a strong belief in Clearway Energy’s growth prospects and financial stability.
💡 Analysts’ optimism is largely driven by Clearway’s consistent operating cash flow, which supports its dividend payouts and potential for growth. The company’s focus on renewable energy projects and long-term power purchase agreements contribute to its predictable revenue streams. Additionally, recent upgrades and increased price targets indicate a growing confidence in Clearway’s strategic direction and financial health.
Earning Report Summary
Clearway Energy’s latest earnings report painted a picture of a company that’s still moving forward, even if not every number landed exactly where the market hoped.
Revenue and Earnings Snapshot
For the final quarter of 2024, Clearway posted earnings per share of just $0.03. That was below what analysts were expecting, which may have raised a few eyebrows. Revenue came in at $256 million for the quarter—up slightly from the $249 million they reported in the same quarter last year, but still under forecasts that were closer to $300 million.
Even with the revenue miss, there were some clear bright spots. For the full year, the company delivered $1.146 billion in adjusted EBITDA and $425 million in cash available for distribution (CAFD). That was actually ahead of their own guidance, which shows they’re managing operations tightly even if top-line growth didn’t quite impress.
Comments from Leadership
CEO Craig Cornelius struck an optimistic tone. He pointed to the company’s operational progress—especially the addition of over 1 gigawatt of renewable and storage projects. That’s not just a flashy number. It’s a meaningful addition that helps push Clearway closer to its long-term goals. He emphasized that with this momentum, the company feels good about hitting the upper end of its 2027 CAFD per share target, which ranges between $2.40 and $2.60.
Looking Ahead
The company reaffirmed its guidance for 2025, projecting between $1.195 billion and $1.235 billion in adjusted EBITDA, along with $400 million to $440 million in CAFD. That’s a stable outlook, suggesting Clearway expects consistency—even in a market where clean energy names have been feeling rate pressure and funding constraints.
Strategically, Clearway is leaning into a mix of storage and repowering. A 320-megawatt storage hybridization portfolio and a 335-megawatt wind repowering project are already in the pipeline. These aren’t just about growth—they’re about keeping the asset base competitive as the industry shifts. They’re also tapping into new demand, especially from sectors like data centers that are hungry for dependable clean power.
While this wasn’t a quarter of headline-grabbing results, it was one that quietly reinforced Clearway’s strategy. And for long-term income-focused investors, the company’s direction remains clear: keep building, stay efficient, and prioritize cash flow that supports a reliable dividend.
Chart Analysis
CWEN has had an interesting journey over the past year, showing a mix of resilience and volatility that’s reflected in both its price movement and underlying technical signals.
Price Trends and Moving Averages
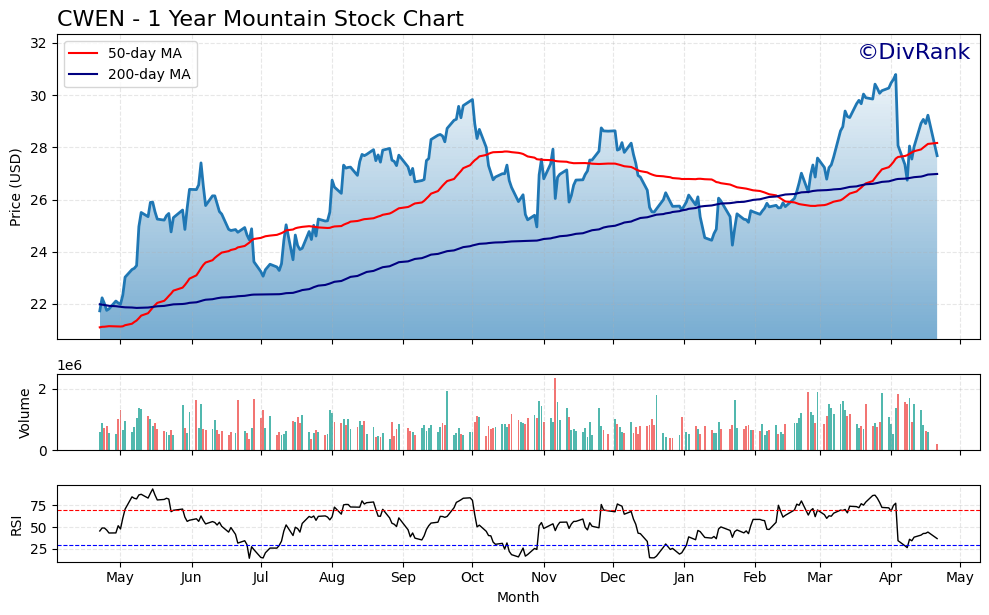
The stock began its run around the $22 mark last May and steadily climbed through the summer months, with the 50-day moving average (in red) sharply trending above the 200-day moving average (in blue). This upward momentum carried into early fall, peaking near $30 before consolidating through winter.
What stands out is the clear crossover of the 50-day moving average below the 200-day around February—traditionally seen as a bearish signal. But CWEN quickly pushed back with a strong rally in March and early April, reclaiming higher ground. As of now, both moving averages are closely intertwined, hinting at indecision and the possibility of consolidation before the next meaningful move.
Volume Activity
Volume spikes occurred in May, September, and again in late March. These periods likely represent strong institutional interest or significant news. Recent trading volumes have remained steady but haven’t reached the peaks of earlier in the year, suggesting less aggressive accumulation at current levels.
RSI and Momentum
The Relative Strength Index (RSI) danced around the 70 level in April, signaling overbought conditions at the time. Since then, it has sharply pulled back, now resting just below the neutral 50 line. This drop in momentum reflects the cooling off we’ve seen in price action through late April. The lack of a breakdown in price alongside a declining RSI can often point to temporary consolidation rather than deeper weakness.
CWEN’s chart shows a stock that’s regained much of its earlier strength but is now pausing to catch its breath. While momentum has cooled, the broader structure remains intact, and key levels like the 200-day moving average continue to hold as support.
Management Team
Clearway Energy is led by Craig Cornelius, who stepped into the CEO role in July 2024. He brings deep experience from his previous leadership roles at NRG and time spent at the U.S. Department of Energy. Under his direction, Clearway has sharpened its focus on expanding renewable energy assets while maintaining a disciplined financial approach. Cornelius has been instrumental in advancing the company’s long-term development pipeline, particularly in utility-scale wind, solar, and storage projects.
Supporting him is CFO Sarah Rubenstein, who joined the executive team in 2023. Her background includes expertise in corporate finance and accounting, which has helped reinforce the company’s financial discipline and support its capital allocation strategy. Together with a leadership bench that includes experienced professionals in legal, compliance, operations, and development, Clearway’s management continues to prioritize steady growth, operational excellence, and a clear commitment to returning capital to shareholders.
Valuation and Stock Performance
At a recent share price of around $27.50, Clearway Energy has posted a gain of nearly 27% over the past twelve months. That strength comes despite some bumps in earnings and ongoing macro pressures, and it’s a reflection of investor confidence in the company’s long-term cash flow model. Still, many analysts see room for more upside, with price targets clustering in the mid-to-high $30s. Based on current market pricing and consensus targets, there’s a general sense that CWEN is trading below its fair value.
Financially, Clearway reported $1.37 billion in revenue over the trailing twelve months and net income of $88 million. While earnings can fluctuate due to non-cash charges and seasonal production, the real story lies in its consistent operating cash flow and strong free cash generation. The dividend remains one of the most attractive features, with a yield close to 5.8% and a history of annual increases. However, the high payout ratio based on earnings—north of 220%—requires a closer look at cash flow, where coverage appears far more comfortable.
The stock’s valuation is further supported by a price-to-book ratio under 1.7 and a price-to-sales multiple in line with infrastructure peers. CWEN’s beta sits below 1, indicating less volatility than the broader market, which may appeal to those looking for stable income with a lower risk profile.
Risks and Considerations
While the long-term outlook is constructive, Clearway isn’t without its risks. The most prominent is its balance sheet—specifically, the $7.76 billion in total debt. For an asset-heavy utility model, leverage is expected, but the scale here means refinancing and interest rate sensitivity are ongoing concerns. Rising rates could squeeze margins and limit flexibility, particularly if access to capital markets becomes more expensive.
There are also operational risks tied to the nature of renewable generation. Solar and wind production can vary year to year, and adverse weather events or equipment outages can lead to lower generation and therefore lower cash flow in certain quarters. Regulatory and policy shifts are another watchpoint. While the broader political momentum has supported clean energy development, changes in tax credits, tariffs, or energy policy could impact future project economics.
That said, management has taken steps to manage and mitigate many of these risks. Long-term contracts reduce exposure to short-term power pricing, and much of the current project pipeline is backed by power purchase agreements with creditworthy counterparties. Operational resilience and financial flexibility remain high on the company’s priority list.
Final Thoughts
Clearway Energy sits in a unique position in the clean energy sector. It combines the predictability of a utility-like business model with the growth potential of a renewables developer. With an experienced management team at the helm, consistent operating performance, and an attractive dividend yield, it continues to appeal to those looking for steady, cash-generating assets in the energy space.
Its valuation still leaves room for growth, particularly if execution remains strong and cash flow continues to trend upward. The risks, while real, appear manageable given the company’s strategy and track record. Ultimately, Clearway represents a story of quiet consistency—focusing on building long-term value through disciplined operations, stable distributions, and a clear vision for the future of energy.