

Updated 4/21/25
Chubb Limited (CB) stands as one of the largest and most respected names in the global insurance space. With operations spanning more than 50 countries, it offers a mix of property and casualty insurance, life insurance, and reinsurance. The company continues to deliver solid financial results, supported by strong underwriting performance, disciplined capital management, and growing investment income.
Over the past year, shares have risen over 13%, backed by consistent earnings and healthy cash flow. With a low payout ratio and steady dividend growth, Chubb remains a model of financial discipline. Its leadership, led by CEO Evan Greenberg, has steered the company with a focus on long-term value. Analysts remain constructive, with a consensus price target of $309.02 and ratings leaning toward outperformance. Supported by stable cash flows, a strong balance sheet, and resilient operations, Chubb remains a reliable player within its sector.
Recent Events
Shares of Chubb are up around 14% over the past year, which tells you something about how the market views its consistent execution. While quarterly earnings took a dip—down 22% from the same quarter last year—this kind of volatility isn’t unusual for insurers. A few large claims or changes in investment performance can swing earnings in the short term.
What matters more is the top line and the cash flow. Revenue rose more than 9% year-over-year, and the company brought in over $16 billion in operating cash flow during the last twelve months. That’s not just healthy—it’s exceptional for this kind of business.
With more than $7 billion in cash and a debt-to-equity ratio of just over 30%, Chubb’s balance sheet looks solid. They’re well-positioned to weather unexpected storms or capitalize on new opportunities without putting their dividend—or anything else—at risk.
Key Dividend Metrics
📈 Forward Dividend Yield: 1.27%
💵 Annual Dividend Rate: $3.64
🧮 Payout Ratio: 15.81%
📊 5-Year Average Yield: 1.69%
🕒 Next Dividend Date: April 4, 2025
🔁 Last Stock Split: 3-for-1 in 1998
Dividend Overview
On paper, Chubb’s yield isn’t going to knock your socks off. At 1.27%, it’s not the highest payer in the market. But that number only tells part of the story. What really matters is how sustainable and consistent that payout is—and Chubb checks both boxes with room to spare.
With a payout ratio below 16%, the dividend is well-covered by earnings. That gives the company flexibility not just to maintain the dividend, but to grow it steadily over time without putting strain on the rest of the business.
The current yield is a little below the five-year average, which is mostly due to the stock’s strong price performance. As the share price rises faster than the dividend increases, the yield gets compressed. But that’s not a bad thing—it’s a sign of investor confidence in the broader story.
Chubb’s approach to dividends is as deliberate as everything else they do. If they see a better way to create long-term value—like buying back shares or investing in underwriting capacity—they’ll take it. But they’ve still managed to increase the dividend every year, showing a clear commitment to rewarding shareholders.
Dividend Growth and Safety
Chubb doesn’t make big, splashy announcements when it raises its dividend, but the raises keep coming. The most recent increase pushed the payout up to $3.64 a share, a small but meaningful bump from $3.59. That’s how Chubb operates—measured, predictable, and sustainable.
What makes their dividend particularly appealing is how safe it is. That low payout ratio means Chubb could withstand a major earnings downturn and still comfortably cover the dividend. And with cash flow rolling in at over $16 billion annually, there’s ample cushion.
That kind of financial strength isn’t just a comfort blanket—it’s a reason why long-term investors keep coming back. The business is resilient, and management has shown time and again that they won’t stretch just to juice the dividend yield.
Looking ahead, there’s every reason to believe the dividend will keep growing, slowly and steadily. It’s not a story of explosive income, but it is one of dependable returns—exactly what many dividend-focused portfolios need.
Cash Flow Statement
Chubb’s trailing twelve-month cash flow performance underscores the financial discipline at the core of its operations. Operating cash flow came in strong at $16.18 billion, marking a significant jump from $12.63 billion the year before. This upward trend in cash generation reflects both solid underwriting results and consistent premium inflows, giving Chubb ample flexibility for strategic investments and shareholder returns.
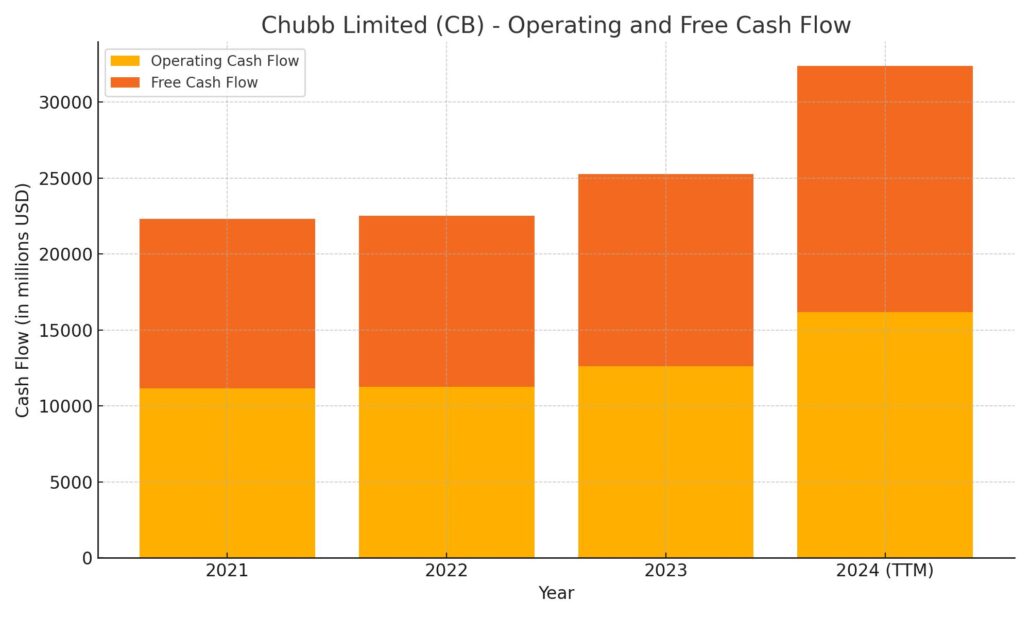
On the investing side, outflows totaled nearly $13.92 billion, which is a sharp increase from prior years. This rise signals an aggressive stance on deploying capital—likely into fixed-income securities and business expansion. Financing cash flow was negative $2.18 billion, a sign of continued capital returns through share repurchases and debt repayments. Even with that, Chubb ended the period with $2.55 billion in cash on hand, maintaining a strong liquidity profile. The numbers tell a story of a company that not only generates robust cash, but allocates it with intention.
Analyst Ratings
📊 Chubb Limited (CB) has recently been the focus of several analyst updates, with sentiment leaning positive. The consensus 12-month price target sits at $309.02, implying about an 8.2% upside from current levels. Most analysts classify the stock as “Outperform,” signaling confidence in its ability to deliver steady results.
📈 Piper Sandler bumped up its price target to $335 and reiterated an “Overweight” rating. Their view centers on Chubb’s strong underwriting discipline and its healthy capital reserves, which continue to set it apart in the insurance space. Barclays, while trimming its target slightly to $321, still holds an “Overweight” outlook, pointing to the company’s pricing strength and international growth potential as key reasons for optimism.
⚖️ Jefferies maintained a “Hold” rating while nudging its target up to $308. Their stance suggests neutrality, recognizing the solid fundamentals but remaining cautious about near-term catalysts. Meanwhile, Wells Fargo dropped its target to $268, holding an “Equal-Weight” rating and citing concerns over margin pressure in certain business lines.
🧭 UBS lifted its price target to $303, keeping a “Neutral” rating. They appear balanced in their expectations, acknowledging Chubb’s consistency while also watching for broader industry shifts.
🎯 Price targets now range from $247.67 on the low end to $346.50 at the high, showing a fairly wide spread in opinion—but a tilt toward continued confidence in Chubb’s long-term execution.
Earning Report Summary
Chubb wrapped up 2024 on a high note, delivering numbers that really reflect the strength of its core business. The fourth quarter showed solid momentum, with net income hitting $2.58 billion, or $6.33 per share. Stripping out some tax-related noise from last year, the company still managed to grow core operating income by nearly 8%, coming in at $6.02 per share. That’s the kind of steady performance investors have come to expect from Chubb.
Strong Underwriting and Premium Growth
The property and casualty division once again led the charge. Net premiums written climbed to $10.5 billion, up 3.5% compared to the prior year. That’s not explosive growth, but it’s reliable and backed by a very healthy combined ratio of 85.7%. For insurers, that’s the kind of number that tells you the underwriting is on point. On top of that, life insurance premiums jumped nearly 16%, with that part of the business bringing in $1.1 billion in income.
Investment Income Adds Fuel
Investment income also played a big role this quarter. Chubb pulled in $6.38 billion in adjusted net investment income over the year, a nearly 20% lift. With interest rates still elevated, the company clearly took advantage of the environment and managed its portfolio well. That’s become a real earnings lever, especially at a time when other sectors are feeling pressure from market volatility.
Leadership’s View
CEO Evan Greenberg didn’t mince words—he called 2024 the best year in the company’s history. He pointed to the company’s ability to stay disciplined while still finding ways to grow. It’s not about chasing risk for short-term gain; it’s about managing risk while still delivering consistent returns. Greenberg also hinted at more room to run, especially in the company’s international P&C and life insurance operations. That’s an encouraging signal, particularly for long-term investors who value consistency over flash.
Overall, this earnings report paints a picture of a company firing on all cylinders—steady underwriting, smart investment management, and leadership that’s focused on building durable value. No major surprises, just solid execution.
Chart Analysis
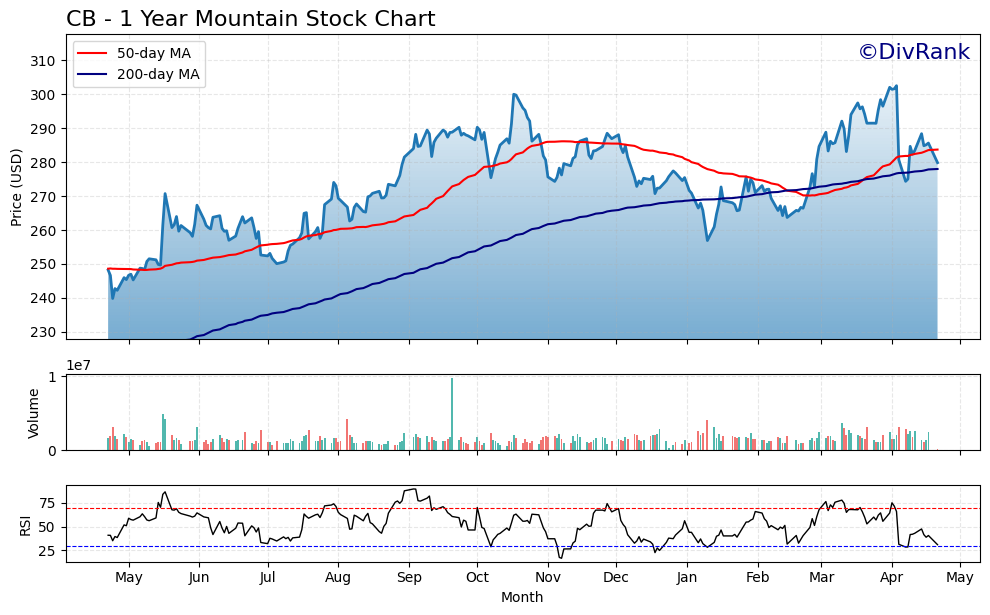
The one-year chart for CB paints a picture of a stock that’s been steadily working its way higher, with some notable pivots along the way. It started the year around the $240 range and pushed up past $310 before pulling back recently, now hovering around $280.
Moving Averages
The 50-day moving average (red line) crossed above the 200-day moving average (blue line) last summer, which often signals strong upward momentum. That trend held up well through the fall, but things started to cool off in January. The 50-day moving average has since flattened and even turned slightly lower, now sitting just above the 200-day line again. This kind of compression between the two lines can often hint at a larger move coming—one way or the other.
Volume Trends
Volume has remained fairly consistent throughout the year, with a few noticeable spikes around early October and late March, coinciding with price surges. These bursts of higher trading volume often confirm investor conviction during upward moves. More recently, volume has stayed steady, with no major drops, suggesting that interest in the stock remains stable.
RSI Momentum
The Relative Strength Index has made a few trips into overbought territory (above 70), especially around September and March. Most recently, it bounced near 70 again in early April before pulling back. It’s now sitting closer to the middle range, around 50, which suggests that the stock isn’t overbought or oversold at the moment. That neutral reading may offer some breathing room for the next directional move.
Price Behavior
Over the past few months, CB has been forming a range between roughly $270 and $310. Each time it approaches the upper boundary, some profit-taking kicks in. On the downside, buyers have consistently stepped in around the $270 level, giving this zone some technical support. The pattern looks like consolidation after a big run, which isn’t unusual for a stock coming off strong gains.
Overall, this chart reflects a stock that has shown strength, pulled back in a healthy way, and is now sitting at a potential turning point. It’s held up well against the broader market and continues to show signs of resilience.
Management Team
Chubb is led by Evan Greenberg, who has been at the helm as Chairman and CEO since 2004. With a long history in the insurance industry, Greenberg is known for his sharp focus on underwriting discipline and long-term value creation. Under his leadership, the company has expanded its global presence and maintained a strong commitment to operational efficiency.
Supporting him is John Keogh, the President and Chief Operating Officer. Keogh has decades of experience and plays a critical role in the company’s day-to-day operations, aligning business performance with broader strategic goals. He’s widely regarded for his leadership within both domestic and international insurance markets.
Other key figures include Peter Enns, who serves as Chief Financial Officer, guiding Chubb’s financial strategy and overseeing capital management. Timothy Boroughs is the Chief Investment Officer, responsible for managing the firm’s investment portfolio, a key contributor to earnings. Frances O’Brien, the Chief Risk Officer, is tasked with safeguarding Chubb’s risk profile, an increasingly vital role in the complex global insurance landscape.
Together, this leadership team brings a blend of vision, financial discipline, and risk awareness that continues to define Chubb’s conservative yet growth-oriented approach.
Valuation and Stock Performance
Chubb’s stock has shown steady strength over the past year, rising around 13.6% and currently trading near $285.59. That kind of move stands out in a sector that tends to be more stable than flashy. Investors appear to be rewarding the company’s consistent execution and reliable financial results.
From a valuation perspective, the numbers make a case for a well-priced, high-quality business. The current price-to-earnings ratio is around 12.67, placing it on the more reasonable end when compared to peers with similar fundamentals. It suggests that the market isn’t overpricing Chubb’s success. In terms of return on assets, the figure stands at a respectable 3.83%, reinforcing how efficiently the company turns assets into profit.
Looking forward, the average analyst price target sits at $309.02. That’s a modest upside, but it’s grounded in expectations of consistent earnings growth and stable returns. The company’s disciplined capital management, combined with its history of solid underwriting results, continues to keep it on solid footing in the eyes of many market watchers.
Risks and Considerations
While Chubb has delivered consistent results, the nature of the insurance industry always carries risk. Catastrophic events, such as natural disasters, can cause significant volatility in claim volumes. The company’s broad geographic exposure also means dealing with a variety of regulatory environments, each with its own complexities and challenges.
Chubb’s investment income is another important revenue source, and it’s subject to market fluctuations. Rising or falling interest rates, economic uncertainty, and asset price movements all play into the bottom line. In a low-growth or high-volatility environment, even a well-managed investment portfolio can face headwinds.
Competition in the insurance space is another pressure point. Pricing discipline is essential, but competitors offering aggressive rates can sometimes put downward pressure on margins. And with the growing digitization of insurance services, cybersecurity threats are a real concern. Maintaining secure systems is critical as more of the company’s infrastructure moves online.
Final Thoughts
Chubb has built its reputation on strong execution, conservative underwriting, and the ability to perform across cycles. The leadership team brings stability and a clear strategy, and the company’s financial strength offers flexibility in how it navigates future risks. While no business is without challenges, Chubb continues to prove that staying disciplined and focused on fundamentals can deliver meaningful results over time.
Whether looking at its risk-adjusted growth, capital strength, or long-term operational track record, the picture that emerges is one of consistency. The company remains well-positioned to manage whatever comes next while continuing to reward shareholders along the way.