

Updated 4/14/25
Calvin B. Taylor Bankshares (TYCB) has steadily built its reputation as a financially sound community bank rooted in the Delmarva Peninsula. With a market cap around $141 million and consistent earnings growth, the company has demonstrated strong fundamentals, including a 28.6% year-over-year earnings increase and a return on equity of 11.87%. Its dividend yield sits at 2.85%, backed by a conservative 23.32% payout ratio, allowing for both stability and growth. Recent leadership changes, including the appointment of M. Dean Lewis as CEO, signal thoughtful succession planning and continuity. The stock has performed well, reaching a high of $60 over the past year and holding above both its 50- and 200-day moving averages. TYCB continues to focus on strategic growth, disciplined lending, and consistent shareholder returns, making it a reliable financial performer with a clear long-term direction.
Recent Events
Over the past few quarters, TYCB has been steadily climbing in market value. From $116 million in September of last year, it’s grown to nearly $142 million as of April 2025. That kind of slow, deliberate growth is often a hallmark of a well-run community bank that’s doing exactly what it’s supposed to—taking deposits, lending prudently, and managing costs.
Earnings have followed the same path. The bank reported a trailing twelve-month net income of $13 million, translating into diluted earnings per share of $4.46. That’s not just consistent—it’s rising. In fact, year-over-year earnings grew by over 28%, and revenue jumped nearly 23%.
Margins tell a similar story. A nearly 40% profit margin and operating margin pushing 49% reflect a business that’s running lean and disciplined. Return on equity sits at 11.87%, a strong number considering the bank doesn’t carry any visible debt. That clean balance sheet is a real asset in a rate-sensitive environment like this.
Valuation-wise, the price-to-earnings ratio has moved from the high 8s to the low 11s over the last few quarters. That’s still reasonable, especially considering the strength of the earnings and the capital position behind them. Investors are slowly starting to notice, but the stock hasn’t run away from its fundamentals.
Key Dividend Metrics
📅 Forward Dividend Yield: 2.85%
💰 Forward Annual Dividend Rate: $1.48
📈 5-Year Average Yield: 3.13%
🧮 Payout Ratio: 23.32%
🔁 Dividend Growth (YoY): Modest and steady
🗓️ Next Ex-Dividend Date: April 21, 2025
🏦 Book Value Per Share: $42.01
📊 Price/Book: 1.23
Dividend Overview
For income-focused investors, the current 2.85% yield might not scream excitement, but it signals something even better—stability. The yield has dipped slightly from its five-year average, but that’s more a result of the stock price moving higher than any change in the dividend itself.
The payout ratio is comfortably low at just over 23%. That tells you the dividend is more than covered by earnings, with plenty of room to grow or hold steady even if the economy throws a few curveballs. There’s a margin of safety built into this payout, and that’s exactly what dividend investors should be looking for.
Management has kept the approach conservative—raising dividends slowly, not erratically, and avoiding overcommitting during good times. That type of measured increase, especially in a bank that doesn’t take on excessive leverage, reflects a strong focus on long-term sustainability over short-term optics.
The cash position backs that up. With nearly $80 million in cash—equal to more than $29 per share—this isn’t a company strapped for liquidity. That cushion provides flexibility to continue rewarding shareholders even if conditions tighten.
Dividend Growth and Safety
TYCB’s dividend growth might not be the kind you brag about at a dinner party, but it’s the kind you can count on. The annual payout has increased from $1.42 to a projected $1.48. That’s the kind of steady hand investors appreciate over time—particularly in sectors like banking, where economic cycles can throw plenty of variables into the mix.
What really stands out is the balance between growth and restraint. The bank’s earnings support much higher dividends, but management has clearly opted to maintain a cushion. That’s smart, and frankly, refreshing. Too many banks chase yield only to end up trimming back when the environment shifts.
The safety is also evident in the fundamentals. A sub-25% payout ratio means the dividend doesn’t require perfect conditions to be maintained. The bank could see a dip in earnings or encounter a more challenging loan environment and still comfortably fund its dividend.
There’s also the low beta to consider—just -0.10. That tells you this stock tends to move independently of the broader market. For dividend investors looking to smooth out portfolio volatility, TYCB adds a stabilizing element.
Ownership remains largely outside of institutions and insiders, which might deter some investors. But for those who know where to look, it’s a signal that this stock hasn’t been picked over by the market yet. There’s still room here for value to be realized quietly, in the background, as the dividend keeps rolling in.
TYCB isn’t flashy. It’s not racing for the top of the leaderboard. But it’s consistent, conservatively managed, and delivering real value to shareholders. For dividend-focused investors, that kind of reliability is more than enough.
Cash Flow Statement
Calvin B. Taylor Bankshares (TYCB) has shown solid consistency in generating positive operating cash flow, reaching $14.2 million over the trailing twelve months. That figure has steadily improved from $7.9 million back in 2020, reflecting healthier core operations and more efficient earnings conversion. Free cash flow follows a similar trend, sitting at $12.8 million most recently, well above its 2020 level of $4.6 million. The gap between operating and free cash flow remains comfortably narrow, which suggests disciplined capital spending—only $1.4 million in capital expenditures this past year.
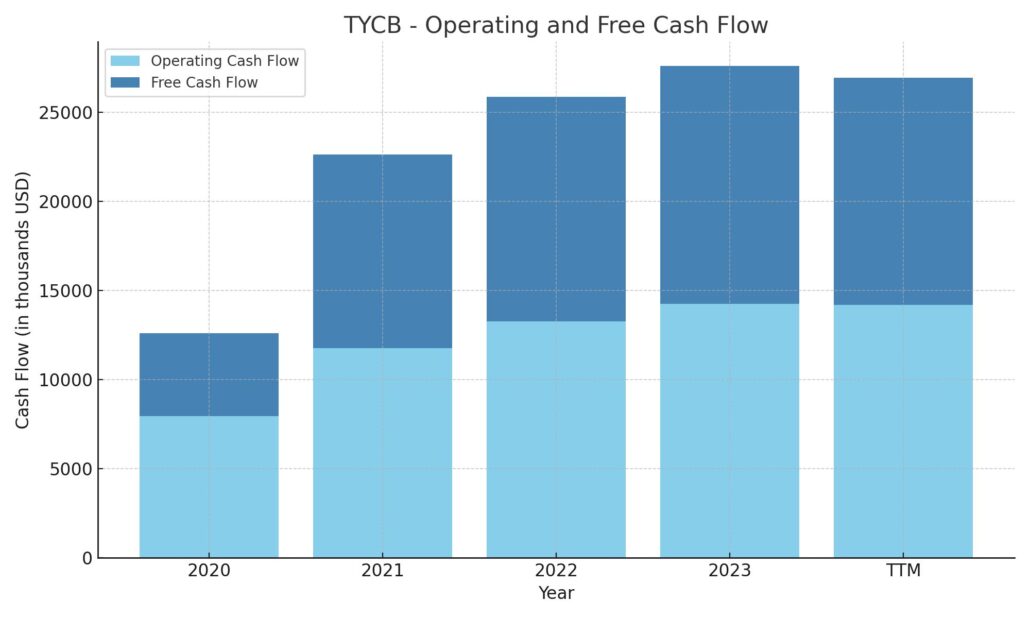
On the investing side, cash flow remains negative, primarily due to aggressive reinvestment in securities or loans typical of bank operations, totaling a $19.5 million outflow TTM. While that’s far less than the $163 million outflow in 2021, it still indicates a focus on asset deployment. The financing side is where things turned sharply—$38 million flowed in, reversing the large $70 million outflow the year prior. This likely reflects a shift in capital allocation or timing of dividend and buyback decisions. The result is a significant rise in year-end cash, climbing to $131 million—more than triple the prior year’s level, signaling a well-capitalized, liquid position.
Analyst Ratings
📉 Calvin B. Taylor Bankshares, Inc. (TYCB) has not been the subject of any recent analyst upgrades or downgrades. This isn’t too surprising, considering TYCB operates in a niche regional market and doesn’t attract a lot of attention from major Wall Street firms. As it stands, there’s currently no active analyst coverage or published consensus price target available for the stock.
🔍 Even without formal ratings, TYCB’s underlying financials tell a compelling story. The company has delivered a trailing twelve-month EPS of $4.46 and maintains a healthy return on equity of 11.87%. These aren’t just nice numbers—they reflect a bank that knows how to generate solid shareholder returns while keeping operations tight and focused.
💸 The dividend payout ratio sits at a conservative 23.32%, which is particularly attractive to income-focused investors looking for consistency. It suggests the company is leaving itself plenty of breathing room to navigate changing market conditions without compromising its commitment to returning capital to shareholders.
📊 While there aren’t price targets or analyst opinions to weigh, the data speaks for itself. TYCB continues to quietly perform, offering a reliable option for those prioritizing dividend stability and sound financial management.
Earnings Report Summary
Strong Quarter with Solid Momentum
Calvin B. Taylor Bankshares (TYCB) closed out 2024 on a strong note, turning in a performance that checked a lot of the right boxes. The fourth quarter saw meaningful growth in the bank’s loan portfolio—up by nearly $37 million, or a little over 6% from the previous quarter. For a community-focused institution like TYCB, that’s a notable move and shows demand is there, and more importantly, that the bank is executing well on its lending strategy.
The deposit base also expanded during the quarter, which added further strength to the balance sheet. That kind of deposit growth doesn’t just support new lending—it also provides liquidity and flexibility, especially important for navigating whatever surprises 2025 might throw at the banking sector.
Leadership Staying Focused
Management’s tone around the results was upbeat but measured. They acknowledged the strong finish to the year but made it clear the goal is to keep building on that foundation. A big part of their focus going forward is to stay steady—continuing to lend responsibly, maintaining a strong balance sheet, and watching expenses.
And for shareholders? There was more good news. The bank bumped its quarterly dividend up to $0.37 per share. That’s a 2.8% increase from the previous quarter and a 5.7% raise compared to the same time last year. It’s not a flashy move, but it’s exactly the kind of steady, dependable growth income investors like to see—especially in a sector where dividend cuts can come without warning.
A Look Ahead
As far as the road ahead, the team at TYCB isn’t promising anything radical. They’re sticking to what’s worked—measured loan growth, customer-focused banking, and disciplined capital management. That strategy has served them well, and it looks like they see no reason to shift gears now.
In short, TYCB wrapped up the year with growing loans, rising deposits, a healthy balance sheet, and a higher dividend. No gimmicks, no drama—just solid banking. And in today’s market, that kind of consistency is something investors can appreciate.
Chart Analysis
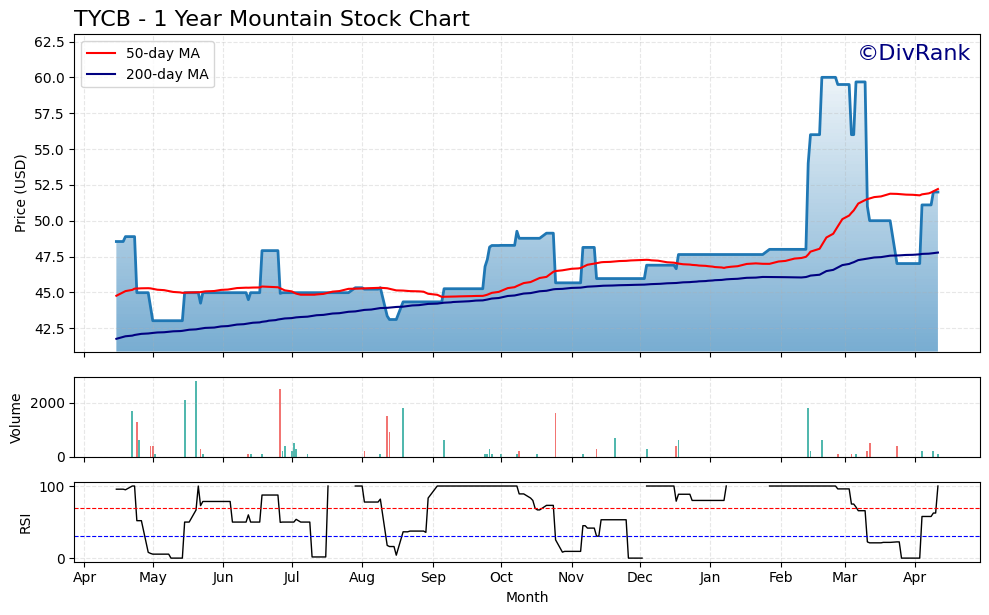
Price Movement and Trend
TYCB has shown a steady climb over the past year, with a noticeable acceleration starting around February. The stock hovered in a relatively narrow range for most of the year, moving between the $43 and $48 levels. It wasn’t until early February that momentum really picked up, driving the price into the low $60s before pulling back slightly. That breakout above prior resistance was significant, and the price appears to be consolidating now just above the $50 mark.
Both the 50-day and 200-day moving averages tell a consistent story. The 50-day moving average (in red) has stayed above the 200-day (in blue) since the start of the year, with a widening gap in February and March, which typically signals strength. The recent price action has stayed above both moving averages, indicating continued positive sentiment, even after a pullback from the highs.
Volume and Momentum
Volume has been relatively light throughout most of the year, which is not unusual for a thinly traded name. That said, the price surge in February and March came with a modest uptick in volume, suggesting some renewed interest. While not explosive, it was enough to support the move higher. Since then, volume has tapered off, and that matches the sideways consolidation we’re now seeing.
Looking at the RSI (Relative Strength Index), the stock touched overbought levels a couple of times earlier in the year, notably during the sharp move into the $60 range. It has since cooled off, dipping below 30 and now recovering again. That drop in RSI came as the stock pulled back, offering a breather from short-term excess. The current RSI is back above 50, a healthy zone that doesn’t suggest any immediate overheating.
Overall Structure
The overall structure of the chart is healthy. The long-term trend remains upward, supported by higher highs and higher lows. There’s also a clear shift from a tight consolidation zone in the first half of the year to a breakout and base-building pattern more recently. That transition often points to a maturing uptrend, with investors stepping in at higher price levels.
The moving average structure, gradual volume increase, and current RSI positioning all support the view that this chart reflects strength and stability. It doesn’t show speculative spikes or erratic trading—just a well-supported advance with normal pullbacks along the way.
Management Team
Calvin B. Taylor Bankshares (TYCB) has long been known for the stability and continuity in its leadership, and that reputation continues with the recent transition in executive roles. After more than 20 years at the helm, Raymond Thompson stepped down as CEO at the close of 2024. His successor, M. Dean Lewis, officially assumed the role on January 1, 2025. Lewis isn’t new to the company—he’s been with Taylor Bank since 2012 and served as Chief Financial Officer before taking on the top job. He brings both financial acumen and institutional knowledge, shaped by a prior career in public accounting and a background that includes advanced degrees in accounting and taxation.
The rest of the executive team reinforces this sense of stability. Tina Kolarik serves as Chief Operating Officer and brings deep operational experience to the table. The board of directors, led by Chairman Thomas Coates, features members with strong local ties and seasoned backgrounds in banking, legal, and financial services. Together, this team has steered the bank with a steady hand, which shows up in its consistent results and conservative approach to growth.
Valuation and Stock Performance
TYCB’s stock has climbed steadily over the past year, moving from the low $40s to as high as $60 before settling around the $52 level. That places the stock comfortably near the upper end of its 52-week range, reflecting confidence in the company’s performance and future direction. With a market cap sitting at around $141 million, it remains a small-cap bank, but its price movement and volume have started to show signs of broader interest.
From a valuation perspective, TYCB trades at a price-to-earnings ratio of 11.66 and a price-to-book ratio of 1.23. These levels suggest the stock isn’t overheated and remains reasonably priced given its earnings strength and capital position. Return on equity is solid at 11.87 percent, pointing to effective management of shareholder capital.
The dividend is another key part of the stock’s appeal. The current yield stands at 2.85 percent, with a forward annual payout of $1.48 per share. The bank keeps its payout ratio conservative, just over 23 percent, which leaves room for flexibility if the earnings environment tightens. For investors who value income along with capital preservation, the structure here is designed to weather a variety of conditions without sacrificing return.
Risks and Considerations
As strong as TYCB’s fundamentals are, no investment is without its risks. The bank operates in a relatively narrow geographic area, which makes it more sensitive to regional economic trends. Should the Delmarva Peninsula face industry-specific or demographic challenges, the bank’s growth could be impacted more than that of a more diversified competitor.
The stock’s thin trading volume is another factor to consider. With relatively few shares changing hands on a daily basis, liquidity can be an issue. This might not be a problem for long-term holders, but it’s worth noting for those who may need to exit a position quickly.
Interest rate risk is always present for banks, and TYCB is no exception. A significant shift in the interest rate environment could squeeze net interest margins and potentially slow earnings growth. That said, the company has historically taken a cautious approach to lending and asset-liability management, which should help mitigate the worst of those impacts.
Final Thoughts
Calvin B. Taylor Bankshares has built its reputation on consistency, sound management, and a disciplined approach to growth. With a new CEO in place who brings both continuity and fresh perspective, the bank is well-positioned to carry on that legacy. Its financials reflect a company that knows its market, serves it well, and manages its capital prudently.
The valuation remains grounded, with a reasonable earnings multiple and a sustainable dividend yield that makes sense for income-focused investors. Risks do exist—primarily around geographic concentration and trading liquidity—but so far, the bank’s conservative style has served it well in navigating those challenges.
Looking ahead, TYCB doesn’t need to chase big trends or make bold moves. What it does best is remain focused, efficient, and reliable—qualities that tend to endure over time, regardless of what the broader market is doing.