

Updated 4/14/25
Cadence Bank (CADE), a regional financial institution headquartered in Mississippi, offers a stable foundation for income-focused investors. Backed by experienced leadership and a clear strategy, the bank has grown through mergers and operational discipline, maintaining solid credit quality and consistent profitability. With a forward dividend yield of 4.04% and a conservative 36% payout ratio, Cadence delivers reliable income while keeping financial flexibility intact. The stock currently trades below book value, offering potential value supported by a strong capital base and healthy cash flow. While recent earnings reflect margin pressure, management remains focused on operational efficiency and long-term shareholder returns.
Recent Events
Cadence’s latest earnings report was a bit of a mixed bag. On one hand, year-over-year quarterly earnings were down nearly 49%. That’s not ideal, but digging a little deeper, the bank is still holding its own operationally. Profit margins are solid, coming in at over 30%, and operating margin sits at a strong 41.7%. So while earnings have pulled back, Cadence hasn’t lost control of the fundamentals.
The return on assets stands at 1.09%, and return on equity at 9.75%—both respectable for a regional bank navigating this current rate environment. They’ve clearly been feeling the pressure of higher funding costs and the tightening credit landscape, but overall, Cadence is managing its balance sheet with discipline.
What’s particularly reassuring is the company’s liquidity position. With $1.7 billion in cash and a relatively small debt load, Cadence isn’t overly leveraged. That kind of balance sheet strength matters when the economy is wobbling or interest rates are in flux.
Key Dividend Metrics
📈 Forward Dividend Yield: 4.04%
💵 Annual Dividend Rate: $1.10
🔁 Trailing Dividend Yield: 3.68%
📊 Payout Ratio: 36.1%
📅 Ex-Dividend Date: March 14, 2025
🗓️ Last Dividend Payment: April 1, 2025
📉 5-Year Average Yield: 3.22%
Dividend Overview
Cadence Bank is offering a forward dividend yield of 4.04%, which is comfortably above the average for regional banks. That number alone puts it on the radar for income investors looking for yield in an environment where many other names are trimming payouts or playing it safe.
The current payout ratio of just over 36% gives Cadence room to maintain and potentially grow its dividend. It’s not distributing an unsustainable chunk of its profits, and that provides a layer of comfort for those relying on income. When companies are paying out too much of their earnings, there’s always a risk of a cut during a downturn. Cadence doesn’t seem anywhere close to that point.
The company also has a history of steady dividend growth. While it’s not making giant leaps in its annual payout, it has been consistent. That predictability is exactly what long-term dividend investors tend to value more than sporadic, flashy hikes.
Dividend Growth and Safety
Looking back over the past few years, Cadence has demonstrated a thoughtful approach to dividend growth. It doesn’t chase yield to attract short-term interest, and it hasn’t had to backtrack on payouts. Instead, the company appears to aim for sustainability—making sure every increase can be supported by cash flow and long-term earnings trends.
With $856 million in operating cash flow over the past twelve months and very little in terms of debt pressure, the bank has plenty of room to support its dividend. The low payout ratio confirms that Cadence is still retaining earnings and preparing for potential challenges ahead. That’s the kind of conservative approach that tends to hold up well during economic hiccups.
Another point that stands out is the relatively low beta (0.89). This means the stock tends to be less volatile than the broader market. For income-focused investors, especially those nearing or in retirement, that lower volatility can be a big plus. It suggests Cadence is a quieter name that does its job without putting you through dramatic price swings.
While earnings have softened recently, the safety of the dividend remains intact. That’s a big part of the story here: Cadence may not be growing earnings at a blistering pace, but it’s delivering the kind of stable income that many investors are looking for—especially in uncertain economic times.
Cash Flow Statement
Over the trailing twelve months, Cadence Bank generated $856.7 million in operating cash flow, showing a solid ability to bring in cash from its core banking operations. While this figure is a step up from the $563.5 million in 2023, it still trails behind 2021 levels when operating cash peaked above $1.1 billion. The bank’s free cash flow for the same period landed at $776.6 million, indicating relatively modest capital expenditures and sound cash efficiency despite the shifting interest rate landscape.
.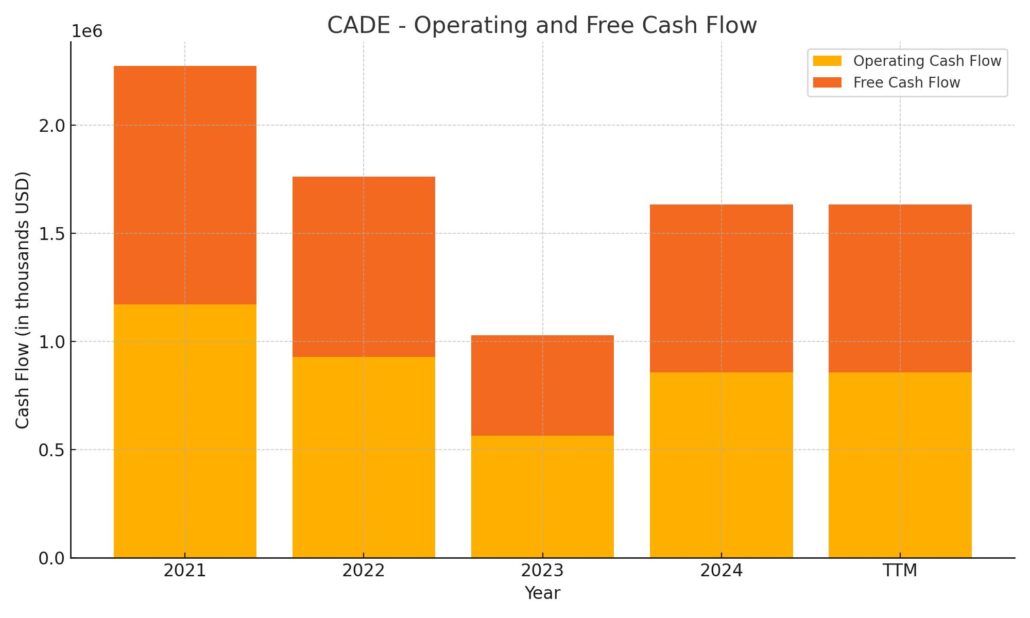
On the investing side, cash flow was significantly negative at -$782.2 million, suggesting a period of reinvestment—possibly in securities or long-term assets, which isn’t uncommon for regional banks adjusting their portfolios. Financing cash flow took a steep dive to -$2.57 billion, reflecting substantial outflows likely tied to debt repayments and capital return activities, including share repurchases and dividends. The end cash position declined sharply year over year to $1.73 billion from over $4.2 billion, a notable change but still a strong cash reserve that provides stability.
Analyst Ratings
Cadence Bank (CADE) has recently experienced a shift in analyst sentiment. One analyst upgraded the stock from ‘Hold’ to ‘Buy,’ citing the bank’s strong financial performance and strategic initiatives aimed at enhancing shareholder value. The analyst emphasized Cadence’s robust capital position and consistent dividend payouts as key factors supporting the upgrade.
Conversely, another analyst downgraded CADE from ‘Buy’ to ‘Hold’ due to concerns over the bank’s exposure to interest rate fluctuations and the potential impact on its net interest margin. The analyst expressed caution regarding the near-term earnings outlook, suggesting that the stock may face headwinds if the interest rate environment becomes more volatile.
The consensus price target among analysts for Cadence Bank currently stands at $30.0. This target reflects a moderate upside from the current trading price, indicating a generally positive outlook among the analyst community. However, the differing ratings underscore the importance of considering various perspectives and the underlying assumptions behind each analyst’s viewpoint.
Earning Report Summary
Cadence Bank closed out the year on a strong note, showing that it’s more than capable of holding steady in a complicated economic environment. For the fourth quarter of 2024, the bank reported $130.3 million in net income, bringing full-year earnings to $514.1 million. That’s a healthy result, and one that reflects how well Cadence has been managing both its lending activity and its expenses.
Solid Profitability and Margin Expansion
One of the bright spots in the quarter was the continued improvement in net interest margin, which landed at 3.38%. That’s an important number for banks, and in Cadence’s case, it’s been trending in the right direction thanks to a more favorable mix of assets and some easing in deposit costs. Even with a slight dip in average earning assets, now at $42.9 billion, Cadence managed to grow average loans while trimming down on excess cash and securities. That kind of shift shows they’re being thoughtful about where they put their capital.
Strong Credit Quality and Cost Control
Credit metrics remained solid. Net charge-offs came in at 26 basis points on an annualized basis, and the bank kept its allowance for credit losses at 1.38% of total loans. That tells us management is staying conservative and keeping a close eye on credit risk, even as they grow.
On the expense side, things are looking lean. The adjusted efficiency ratio clocked in at 57.7%, which reflects strong cost management across the board. In a high-rate world where every dollar counts, keeping costs in check is a big deal—and Cadence seems to be doing just that.
Shareholder returns didn’t get lost in the mix either. Tangible book value per share rose by $1.60 during the year, and the bank also repurchased over 323,000 shares. Capital levels remain robust, with a CET1 ratio of 12.3% and total capital ratio of 14.5%. That gives them plenty of room to keep rewarding shareholders while staying well-positioned for whatever comes next.
Leadership sounded confident about the direction they’re heading. The message was clear: keep growing carefully, stay disciplined, and continue delivering long-term value to shareholders. It’s a tone that matched the numbers—a business that’s not swinging for the fences but consistently hitting solid, reliable returns.
Chart Analysis
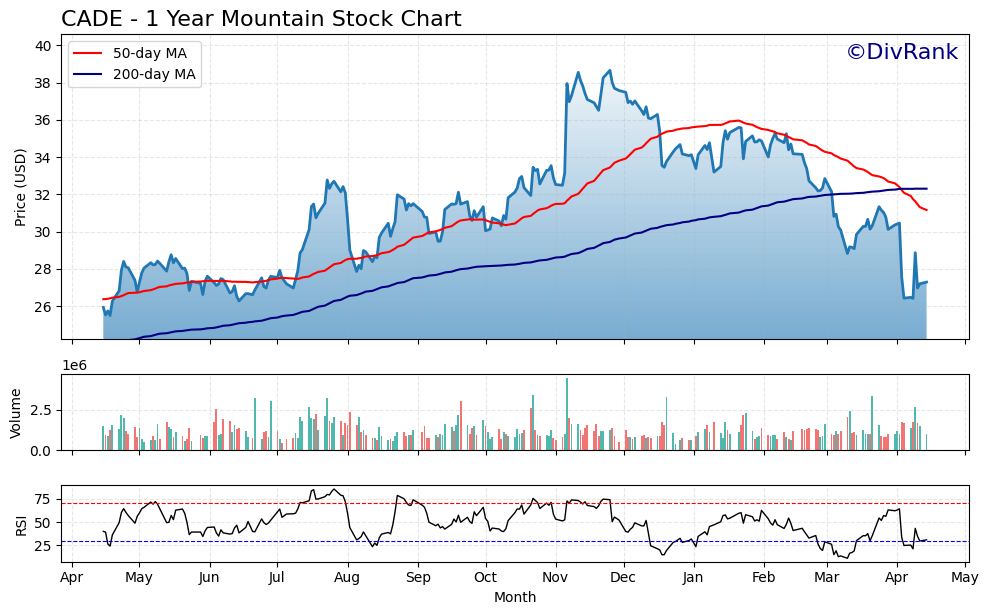
CADE has had a fairly eventful year, with the price making a strong climb in the middle part of the chart before retreating into a clear downtrend over the past few months.
Price Movement and Moving Averages
Through late spring and into early fall, the stock followed a steady upward trajectory, supported by both the 50-day and 200-day moving averages. The 50-day MA (in red) remained above the 200-day MA (in blue) for most of the year, indicating strength in the trend. But things began to shift in early February, when the 50-day started to roll over and eventually crossed below the 200-day. That’s often seen as a bearish crossover, and in this case, it played out with a sharp decline in price through March and into April.
The price is currently well below both moving averages, suggesting that momentum has cooled significantly. This breakdown is also accompanied by a spike in volume during the recent drop, which often confirms stronger conviction behind the move.
Volume and Momentum
Volume has been mixed throughout the year but picked up notably during price declines. That’s not what you want to see during a pullback—it implies there was real selling pressure rather than just a quiet drift lower. The recent attempt to bounce seems weak by comparison, as the volume hasn’t matched the earlier intensity.
Looking at the RSI at the bottom of the chart, there have been multiple dips into oversold territory (below 30), especially during March and early April. The indicator has since moved slightly higher but is still lingering in a cautious zone. This tells us that while the intense selling might have paused, there’s no real buying pressure stepping in yet.
Overall Picture
CADE had a strong middle stretch last year but has given back a lot of those gains recently. The crossover of moving averages, increased volume during the decline, and repeated RSI dips into oversold territory all point to a market that has shifted from confidence to caution. Until the stock can reclaim its moving averages and attract steady buying interest, the chart suggests it’s in a corrective phase rather than setting up for another leg higher.
Management Team
Cadence Bank is guided by a leadership group with deep experience in regional banking and a strong focus on operational efficiency and long-term strategy. Leading the charge is Dan Rollins, who has served as Chairman and CEO since 2012. His background includes a long tenure at Prosperity Bancshares, and he’s been a key figure in shaping Cadence into its current form, especially following the BancorpSouth merger.
Chris Bagley, the President and Chief Credit Officer, brings nearly four decades of banking experience to the table. His oversight of credit management reflects the bank’s conservative lending culture and attention to risk. Valerie Toalson, CFO and President of Banking Services, plays a dual role that includes finance, treasury, and oversight of the mortgage and wealth divisions—linking Cadence’s financial operations closely with its client-facing segments.
Recent organizational shifts have streamlined operations and clarified responsibilities. Billy Braddock now leads as Chief Banking Officer, overseeing core banking services. Cathy Freeman, now Chief Administrative Officer and head of the Experience Office, brings together communications, facilities, audit, and marketing under one umbrella. These changes are designed to speed up decision-making and position the bank for more nimble execution moving forward.
Valuation and Stock Performance
Cadence Bank’s stock (CADE) is currently trading around $27, giving the company a market cap just under $5 billion. The price has pulled back from its highs near $40 over the past year, reflecting broader uncertainty in the banking sector. That said, the current valuation puts CADE in a potentially interesting spot for long-term investors.
Its price-to-earnings ratio is sitting around 9.8, which is on the low side for the industry and could point to a stock that’s being undervalued by the market. Meanwhile, the price-to-book ratio is under 1.0, another signal that the stock is trading below its intrinsic value based on net assets. From a yield perspective, the dividend stands at 4.04%, comfortably covered by a payout ratio of 36.1%.
Analyst opinions are somewhat mixed right now. Some are staying cautious due to potential pressures on margins and earnings, while others see upside in the bank’s strong balance sheet and disciplined strategy. The average price target sits near $30, suggesting some potential for modest gains from current levels.
Risks and Considerations
There are a few key risks that investors should keep in mind. The bank’s earnings are sensitive to changes in interest rates. As those move up or down, Cadence’s net interest margin could face pressure, which would impact overall profitability. Commercial real estate exposure, especially in a slower economy, also presents some risk depending on how those markets evolve.
Organizational changes, while designed to streamline operations, can create temporary disruption. Cadence’s leadership will need to ensure that new roles and responsibilities are aligned and that strategic initiatives aren’t slowed by transition. Competition is also stiff, particularly in the Southeast where regional and national banks are constantly jostling for business. And of course, like any financial institution, regulatory compliance remains a constant consideration.
From a technology standpoint, customer expectations continue to rise. The bank’s ability to modernize its digital offerings while preserving its community banking feel will be important as it tries to retain and grow its customer base.
Final Thoughts
Cadence Bank is clearly in transition—but not the kind that signals trouble. Instead, this feels more like a thoughtful recalibration. Leadership appears aligned on strategy, the capital base is strong, and the dividend continues to reward shareholders even as the business evolves.
The stock isn’t without its risks, especially in a choppy rate environment, but the valuation reflects a fair amount of that uncertainty already. With a conservative payout policy, steady credit quality, and a sharpened focus on operational execution, Cadence continues to look like a well-managed regional bank with a clear sense of who it is and where it’s going.