

Updated 4/11/25
Broadridge sticks to its role as a behind-the-scenes enabler for the financial industry. From proxy voting to wealth management software, it supports the infrastructure that keeps markets functioning. That dependability has quietly built it into a multibillion-dollar fintech force, with plenty to offer income-focused portfolios.
This is the kind of stock that tends to fly under the radar in noisy bull markets, but for those who prioritize consistent dividends and financial resilience, Broadridge deserves a closer look. The company has put up solid growth numbers, it’s maintaining strong profitability, and its dividend track record speaks for itself.
Recent Events
Broadridge has had a strong run lately, gaining nearly 15% over the past 12 months. That handily beats the broader market’s performance during the same time. But it’s not just about price movement—there’s real business strength underneath. Earnings jumped an impressive 102.6% year-over-year, and revenue climbed 13.1%. Those aren’t the kind of numbers you see from a company just coasting along.
Net income came in at $759 million in the most recent quarter, with operating margins at 13.25%. For a company that serves large financial institutions and operates in a compliance-heavy environment, that margin is a solid indication of operational efficiency.
The real story for dividend investors, though, lies in the company’s cash flow. Broadridge posted $1.07 billion in levered free cash flow over the trailing twelve months. That’s well in excess of its dividend obligations, providing more than enough cushion to support—and potentially grow—its payout.
Key Dividend Metrics
📅 Dividend Yield: 1.56%
💵 Annual Dividend: $3.52 per share
📈 5-Year Average Dividend Yield: 1.60%
🧱 Payout Ratio: 52.6%
🚀 Dividend Growth Rate (Trailing Annual): 4.8%
🔁 Dividend Consistency: More than 15 years of uninterrupted increases
💰 Cash Flow Coverage: $1.07B in free cash flow vs. ~$411M in dividend payments
Dividend Overview
The current forward yield of 1.56% isn’t going to dazzle anyone looking for high single-digit payouts. But Broadridge isn’t playing the high-yield game—it’s playing the long one. That yield is supported by rock-solid fundamentals and a disciplined approach to capital allocation.
What stands out here is the stability. The payout ratio of 52.6% shows the company is striking a smart balance between rewarding shareholders and reinvesting in growth. It’s not stretching to pay the dividend, and it’s not hoarding cash unnecessarily either. That kind of discipline is valuable when looking for income that can last through economic cycles.
With a return on equity sitting north of 35%, Broadridge is doing a lot with its capital. The stock has also been steady from a technical standpoint, trading near its 50-day average of $236.36 and well above the 200-day line at $222.47. That suggests the market is supportive without getting overextended.
Dividend Growth and Safety
Broadridge’s dividend safety is one of its strongest features. A business doesn’t keep raising dividends for more than 15 years without being built for the long haul. Free cash flow covers the dividend more than two times over, giving the company plenty of room to continue increasing its payout even if earnings slow down temporarily.
Management’s approach has been steady and conservative. Rather than chase growth at all costs or swing for the fences with acquisitions, they’ve focused on recurring revenue and long-term client relationships. That focus creates predictability—the kind that income investors rely on.
One area worth watching is the company’s debt. Total debt stands at $3.87 billion, and the debt-to-equity ratio is on the higher side at 173.5%. But it’s important to put that in context. The company’s strong cash generation and interest coverage provide a buffer. This isn’t a company loading up on risky leverage. Instead, it’s using its balance sheet strategically to support growth while still preserving the dividend.
Short interest is also low, at under 1% of float. That reflects a general lack of bearish pressure and suggests investors see Broadridge as a stable name.
Cash Flow Statement
Broadridge Financial Solutions continues to demonstrate healthy cash generation, with operating cash flow reaching $1.04 billion over the trailing twelve months. That figure remains steady compared to the previous fiscal year, indicating consistent operational performance. Free cash flow also remained strong at $908 million, comfortably covering dividend payments and supporting ongoing capital needs without financial strain. Capital expenditures increased modestly to $131 million, but that’s in line with a growing tech-oriented business investing in its infrastructure.
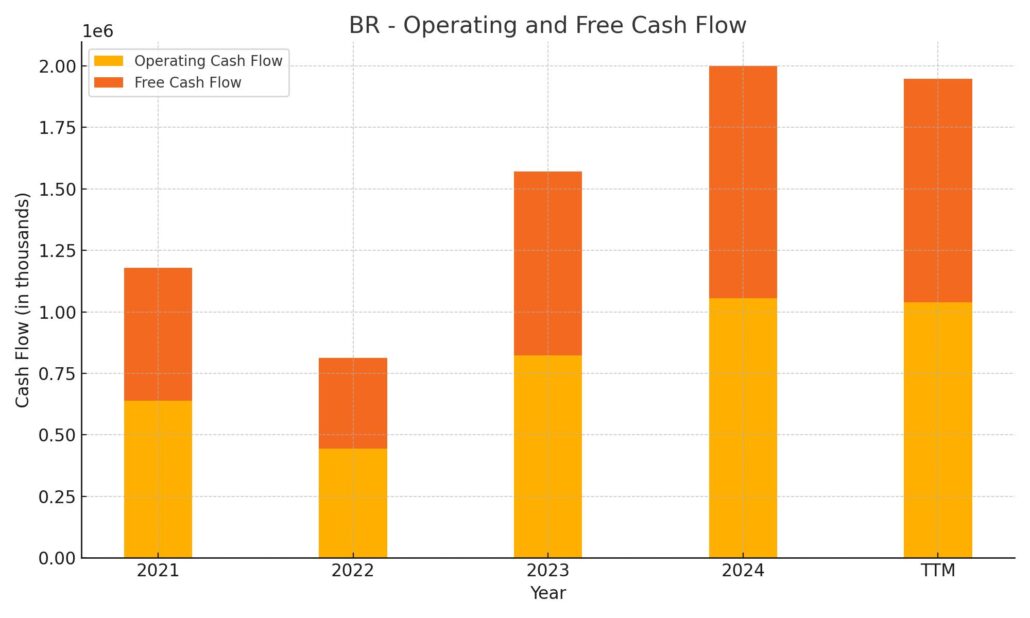
On the financing side, Broadridge maintained an active balance between borrowing and repayment. It issued over $1.14 billion in new debt while repaying $1.14 billion during the same period, suggesting a strategy focused on managing debt maturity rather than adding net leverage. The company also returned over $327 million to shareholders through stock repurchases, a sign of confidence in its long-term valuation. Despite these outflows, its cash position remains stable at $293 million, only slightly below the previous year. Overall, the cash flow profile supports both growth investments and shareholder returns without compromising liquidity.
Analyst Ratings
Broadridge Financial Solutions has recently received a mixed bag of analyst attention. 🧐 The consensus rating currently sits at “Hold,” with five analysts maintaining this neutral outlook while just one leans toward a “Buy” recommendation.
🎯 The average 12-month price target is $241.00, indicating a slight potential upside from current levels. Targets range from a low of $215.00 to a high of $260.00, showing a broad range of expectations depending on the firm’s outlook and valuation models.
One recent move came from StockNews.com, which downgraded the stock from “Buy” to “Hold” due to concerns over its current valuation. On the flip side, Zacks upgraded Broadridge to a Rank #2 (Buy), citing encouraging revisions in earnings estimates and solid overall performance—placing the stock in the upper tier of its tracked universe. 📈
Several institutions have also updated their price targets. UBS raised its target to $260, holding a neutral rating. JPMorgan followed suit, bumping its target up to $249 with a similar stance. Morgan Stanley moved to $222 with an equal weight view. RBC Capital Markets sees value up to $259 and continues to rate the stock as outperform. Raymond James chimed in as well, assigning a $256 target with the same outperform outlook. 🚀
These changes reflect a common theme—Broadridge is performing well and delivering results, but some analysts are tempering their enthusiasm in light of its valuation. Still, steady fundamentals and cash flow strength continue to make it a name worth monitoring.
Earnings Report Summary
Broadridge Financial Solutions recently delivered a strong quarterly update, giving income-focused investors and long-term holders a lot to like. The second fiscal quarter ending December 31, 2024, showed steady momentum, particularly in recurring revenue and a notable uptick in event-driven activity.
Revenue Growth and Segment Highlights
Total revenue for the quarter came in at $1.59 billion, which marks a 13% increase from the same period a year ago. A good chunk of that growth came from recurring revenues, which rose 9%. But what really stood out was the spike in event-driven revenue—up 126%—mainly driven by a heavier flow of mutual fund communications. That sort of bump isn’t always predictable, but it does reflect the kind of role Broadridge plays in handling large-scale financial communications.
On the business side, their Investor Communication Solutions segment brought in $1.15 billion, up from just under a billion the year before. This growth wasn’t just from the regular drip of recurring business, but also from those one-time events that can swing the needle in a quarter. Meanwhile, the Global Technology and Operations side grew to $440 million in revenue, continuing to benefit from a combination of organic expansion and acquisitions.
Earnings and Guidance
Operating income climbed to $210.7 million, significantly higher than last year’s $124.4 million, and margins improved to 13.3%. That translated into net income of $142.4 million for the quarter, with diluted earnings per share landing at $1.20. On an adjusted basis, EPS came in at $1.56—a 70% improvement over the same quarter last year.
What’s reassuring is that Broadridge reaffirmed its full-year guidance. Management is sticking with expectations for recurring revenue growth of 6% to 8%, and adjusted EPS growth in the 8% to 12% range. They also project closed sales to land somewhere between $290 million and $330 million for the year.
Overall, it was a well-rounded quarter. Broadridge isn’t just riding a one-time wave—it’s continuing to deliver on both its recurring model and newer growth initiatives. For investors looking for stable, dividend-friendly companies with consistent execution, this report offers plenty of comfort.
Chart Analysis
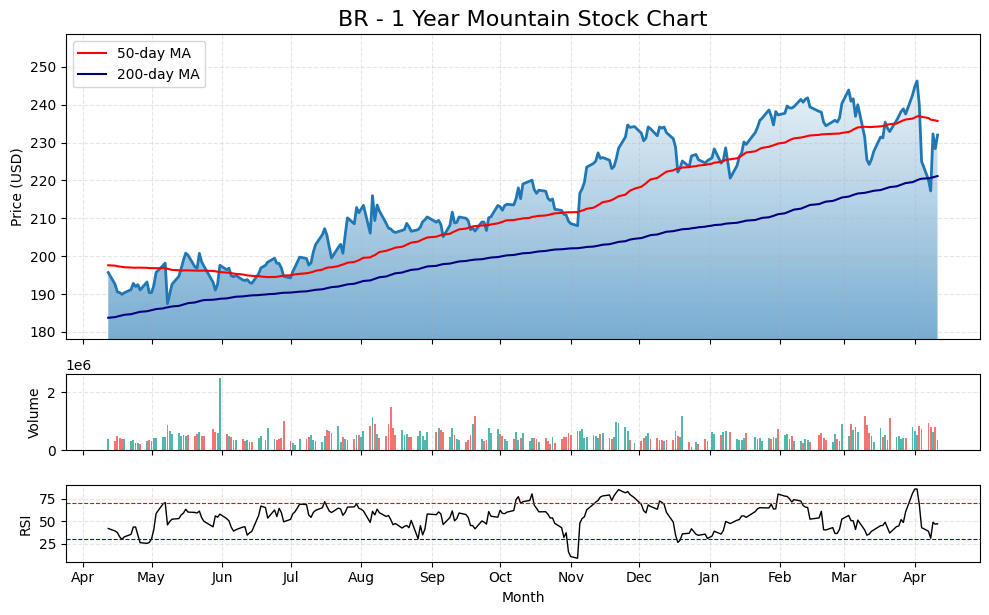
Price Action and Moving Averages
Looking at the one-year chart for BR, the price has shown a consistent upward trend, supported by a gradual rise in both the 50-day and 200-day moving averages. There was a sharp dip recently, but the stock bounced quickly, suggesting strong underlying demand. The 50-day moving average remains above the 200-day, which is typically a positive signal for continued strength. This kind of steady slope in both averages hints at a long-term uptrend rather than a speculative spike.
Volume Behavior
Volume has remained fairly stable throughout the year, with a few notable spikes that likely align with earnings or news events. There was a significant surge in volume during the recent dip, which usually indicates panic selling followed by opportunistic buying. The price recovery after this spike suggests that any short-term fear was quickly absorbed, and buyers stepped back in with confidence.
RSI Indicator
The RSI has mostly hovered in neutral to slightly elevated territory, rarely venturing into overbought or oversold zones for long. Recently, it dipped close to oversold before rebounding, which lines up with the price recovery mentioned earlier. This kind of RSI movement shows a market that’s being driven more by consistent investor interest than speculation or emotional swings.
The combination of a resilient price structure, healthy moving averages, and contained RSI readings paints a picture of a stock with solid footing and balanced momentum.
Management Team
Broadridge Financial Solutions is led by a leadership group that focuses more on execution than showmanship. Tim Gokey, who has been CEO since 2019, has helped shape the company’s steady transition from a traditional back-office processor to a tech-enabled partner for the financial services world. His style is strategic, measured, and grounded in long-term thinking.
The broader management team reflects that same balance of innovation and discipline. They’ve grown the firm’s capabilities into newer areas like wealth management technology and digital communications, while continuing to deliver consistency in their core services. That’s no easy task in an industry where clients demand reliability and precision above all else.
There’s also a strong cultural foundation at Broadridge, with a focus on transparency, accountability, and doing right by clients. You can see it in how the company communicates with investors and in how it reinvests in its own business. They don’t overextend themselves, and they’ve been disciplined in how they allocate capital—whether that’s for tech upgrades, acquisitions, or shareholder returns.
Valuation and Stock Performance
Broadridge has rewarded patient investors over time. The stock is currently trading around $231, a bit below its 52-week high but still showing strong recovery momentum after a brief dip. That kind of bounce-back suggests a degree of investor confidence in the underlying fundamentals.
The current price-to-earnings ratio stands near 36 on a trailing basis, and about 24 on a forward basis. That’s not cheap, but it’s not extreme either, especially considering Broadridge’s high-quality earnings and strong recurring revenue model. It’s the kind of valuation typically reserved for businesses that generate dependable results quarter after quarter.
Price-to-book is around 12, which may seem high at a glance, but is more acceptable when you consider the company’s asset-light model and return on equity north of 35 percent. It also continues to generate strong free cash flow, with more than enough coverage for its dividend and reinvestment needs.
Institutional ownership is another sign of strength. With over 92 percent of shares held by institutions, there’s clear confidence from the investing community. That kind of backing often provides additional price support and stability during periods of broader market volatility.
Risks and Considerations
While Broadridge is a well-run and consistent business, there are still a few risks to keep in mind. Its close ties to financial institutions mean its growth can be affected by the overall health of that sector. If banks, brokers, or asset managers slow their operations or reduce services, it could indirectly impact Broadridge’s revenue.
Debt is another area worth watching. The company holds nearly $3.9 billion in total debt. It has the cash flow to handle it, but as interest rates shift, the cost of managing that debt can creep up. This could affect margins if not managed carefully.
There’s also the competitive landscape to consider. While Broadridge has built strong client relationships and a wide moat, the fintech space is evolving rapidly. New players are emerging with different models, and even existing clients could consider alternatives if something better, faster, or cheaper comes along.
Regulatory change adds one more layer of complexity. The business is deeply embedded in areas like proxy services and compliance-related communications. While these often benefit from stricter rules, sudden changes in legislation or shifts in the pace of enforcement can introduce volatility into event-driven revenue.
Final Thoughts
Broadridge Financial Solutions keeps delivering solid performance without a lot of noise. Its recurring revenue model, rising cash flow, and long history of dividend growth make it a name that offers both income and stability. The company has made smart moves into technology while still maintaining the trust of its core client base, and that’s not easy to do in such a regulated and detail-oriented industry.
Its valuation reflects that consistency. While you’re not getting a deep discount, you’re also not paying a speculative premium. What you get instead is a company that quietly compounds over time. That’s especially valuable for investors who care more about predictable outcomes than market drama.
As with any investment, there are risks—from industry dependencies to competition and debt levels—but none of them seem outsized or unmanaged. Broadridge knows its business, understands its clients, and continues to build on a foundation that has served it well for years. That clarity of focus and steady hand at the wheel is what continues to make it a compelling company to follow.