

Updated 4/11/25
Best Buy has been around long enough that most of us have walked through its aisles at some point—maybe hunting for a new TV, a laptop for school, or just browsing the latest tech. It’s been a staple in the retail world, especially for electronics, and despite the rise of online shopping, it’s still standing. Lately though, it’s been more about adjusting to changing consumer behavior and managing a shifting economic landscape. Shares have taken a hit over the last year, dropping about 23%, but income-focused investors may want to take a closer look under the hood. There’s more to this story than just a lagging stock price.
🧮 Key Dividend Metrics
💸 Forward Dividend Yield: 6.29%
📈 5-Year Average Yield: 3.61%
🏛️ Payout Ratio: 87.85%
🪙 Forward Annual Dividend Rate: $3.80 per share
🗓️ Next Dividend Date: April 15, 2025
Recent Events
Best Buy hasn’t had the easiest run lately. Revenue has slipped by nearly 5% compared to the same period a year ago, and earnings growth fell off a cliff—down over 70%. That’s the kind of decline that raises eyebrows. But interestingly, despite those headline numbers, the company is still generating healthy cash flow. Over the past year, it pulled in $2.1 billion in operating cash flow and managed $1.46 billion in free cash flow after accounting for capital expenditures. That’s the lifeblood of any dividend-paying company.
On the balance sheet, there’s about $1.77 billion in cash sitting on hand, against a total debt load of $4.07 billion. That ratio might feel a bit top-heavy, and it is, with debt-to-equity coming in just under 145%. But it’s not unusual for a mature retailer. Best Buy doesn’t carry heavy fixed assets like industrial or energy names, so it has some room to maneuver.
What’s been interesting is the recent uptick in volume. Over the past 10 days, average trading volume nearly doubled from the 3-month average, suggesting more eyes are turning toward the stock—perhaps sniffing out value or just reacting to earnings noise.
Dividend Overview
This is where Best Buy really starts to stand out for dividend-focused investors.
That 6.29% forward yield jumps off the page. It’s not some short-lived spike either. While it’s well above the company’s 5-year average of 3.61%, this level of yield is a direct result of the stock’s pullback. It’s the kind of yield that turns heads, especially when you’re used to seeing 1–2% from many S&P 500 names.
The payout ratio sits at just under 88%, which might feel high at first glance. But remember, earnings aren’t the only piece of the puzzle. Best Buy has shown that it can cover its dividend through free cash flow, not just net income. As long as that continues, the dividend doesn’t look to be in immediate jeopardy. It may not have a ton of room for growth in the short term, but it’s far from shaky.
Another factor that stands out is how the company handles shareholder capital. Best Buy doesn’t chase buybacks aggressively or make grand moves just for optics. There’s a deliberate, steady-handed approach here. The last time shares were split was all the way back in 2005. That says something about the consistency of its game plan.
Dividend Growth and Safety
Historically, Best Buy has treated its dividend with care. For much of the past decade, the company has steadily increased its payout, even managing to hold the line during the early days of the pandemic. That consistency is a good sign for those relying on dividend income.
Of course, growth in the dividend has slowed recently, and with the high payout ratio, future increases may be more modest. Still, management has repeatedly shown they value the dividend and seem unlikely to walk it back without a major reason.
Digging deeper into the financials, return on equity is up at 31.63%, while return on assets is at 7.29%. Those are healthy numbers that show the company is getting good bang for its buck. It’s not just sitting on assets—it’s putting them to work, and that efficiency supports ongoing cash distributions.
Liquidity is tight, with a current ratio hovering right at 1.03. That’s not uncommon in retail, where inventory turnover helps keep things fluid, but it’s a number worth keeping on the radar. If that starts to slip further, it could be a sign of tightening conditions.
What’s also worth noting is how much of the company is in institutional hands—over 88% of the float. That level of ownership shows confidence from the big players, and insider ownership around 9% isn’t bad either. It’s enough to know there’s some skin in the game among the folks calling the shots.
The next dividend is set for April 15, 2025, with the ex-dividend date already behind us on March 25. That puts this moment more in the realm of long-term positioning rather than short-term dividend capturing.
Cash Flow Statement
Best Buy’s cash flow over the trailing twelve months tells a story of financial discipline in a challenging environment. The company generated $2.1 billion in operating cash flow, a healthy step up from the $1.47 billion posted the year prior. Even with revenue pressures, it’s clear Best Buy has kept its core business cash-generative, and that’s critical for sustaining its sizable dividend. Capital expenditures came in at $706 million, nearly flat from the year before, which left the company with $1.39 billion in free cash flow—a nearly twofold improvement year-over-year.
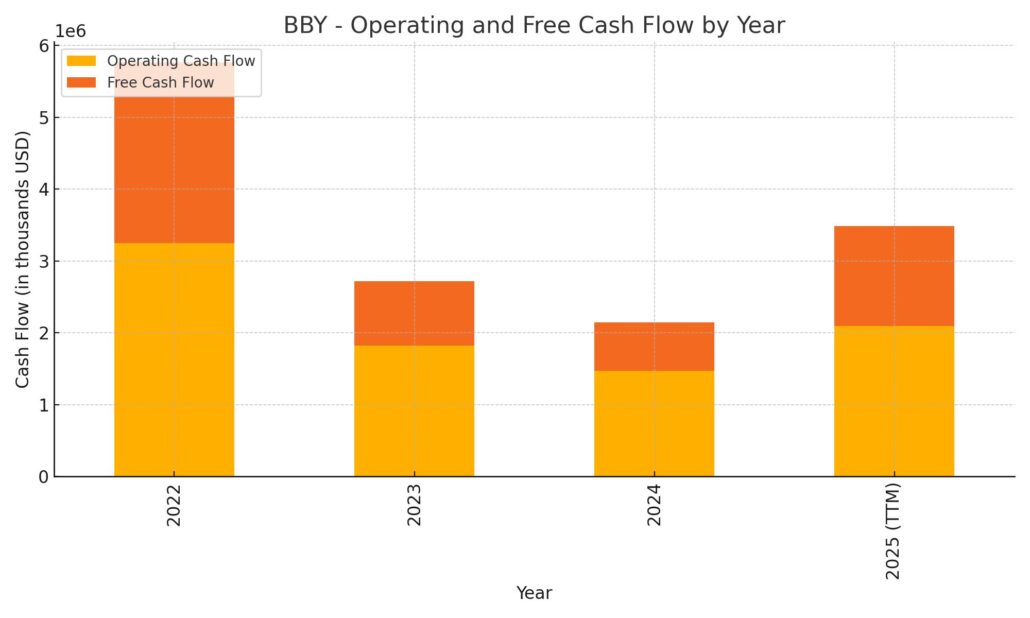
Investing activities remained relatively stable, with cash outflows of $704 million, mostly tied to capital expenditures. On the financing side, Best Buy pulled back again, using $1.3 billion in cash—primarily for dividends and likely some debt reduction or buybacks. That’s in line with its pattern of prioritizing shareholder returns. The company ended the period with $1.87 billion in cash, slightly higher than the year before, showing that despite sending over a billion back to shareholders and investing in the business, it’s still maintaining liquidity. It’s a well-managed balance between reinvestment, capital returns, and stability.
Analyst Ratings
📉 In early April 2025, Citigroup analyst Steven Zaccone shifted his outlook on Best Buy (BBY), moving the stock from a “Buy” to a “Neutral” rating. He also adjusted the price target downward from $93 to $70. The change was tied to concerns over newly introduced tariffs, which are expected to drive up product costs and potentially curb consumer demand. Zaccone also pointed to increased risks of a recession and a possible pullback in discretionary spending—both factors that could weigh heavily on electronics retailers like Best Buy.
🔻 Just days later, on April 8, Truist Securities echoed that cautious tone. While the firm maintained its “Hold” rating, it lowered its price target from $81 to $64. Analysts expressed reservations about the company’s near-term performance, highlighting macroeconomic headwinds and the potential margin pressure from tariff-related pricing shifts.
📊 As of mid-April, the broader analyst consensus pegs Best Buy’s average price target at around $91.28. The current range runs from a low of $64 to a high of $116, suggesting meaningful upside from the current share price. Despite some recent downgrades, there’s still a decent level of optimism embedded in that average target, pointing to expectations of a rebound once short-term pressures ease.
Earnings Report Summary
Best Buy’s most recent earnings report came in with a few surprises and a dose of realism about where things are headed. It’s clear the company is managing through a complicated environment, but it’s also finding ways to stay relevant and profitable—just maybe not at the pace investors had gotten used to.
Solid EPS Beat and Steady Sales
For the fourth quarter of fiscal 2025, adjusted earnings per share landed at $2.58, which was better than expected. Revenue came in at $13.95 billion, which didn’t knock it out of the park but held steady. Comparable sales were up just a touch—around 0.5%—and the strength mostly came from tablets and laptops. The shift to remote and hybrid work is still playing a role in tech spending, and Best Buy seems to be capturing some of that momentum.
Online sales were another bright spot, making up nearly 40% of total domestic revenue. That’s no small feat for a legacy retailer with a big physical footprint. It shows the brand still has digital strength, and customers are sticking with Best Buy for their electronics even when they’re shopping from the couch.
Pressure Points and a Cautious Outlook
That said, it wasn’t all good news. Net income dropped to $117 million in the quarter, with one major reason being a $475 million goodwill impairment tied to the Best Buy Health segment. It’s a hit that reflects some recalibration in long-term expectations for that part of the business.
Looking ahead, the company is taking a conservative stance. They’re guiding fiscal 2026 revenue between $41.4 billion and $42.2 billion and projecting adjusted earnings per share in the range of $6.20 to $6.60. Those numbers show they’re bracing for continued uncertainty, especially with new tariffs coming into play. That added cost pressure could make pricing and margins a little tougher to manage.
Still, Best Buy is sticking to its strategy. They’re rolling out more small-format stores and investing in digital tools to improve the customer experience. It’s not a flashy reinvention, but it looks like a practical move to stay competitive and efficient.
All in all, it was a quarter that showed Best Buy isn’t coasting—it’s adapting. There are some real challenges ahead, but the company still knows how to deliver when it matters.
Chart Analysis
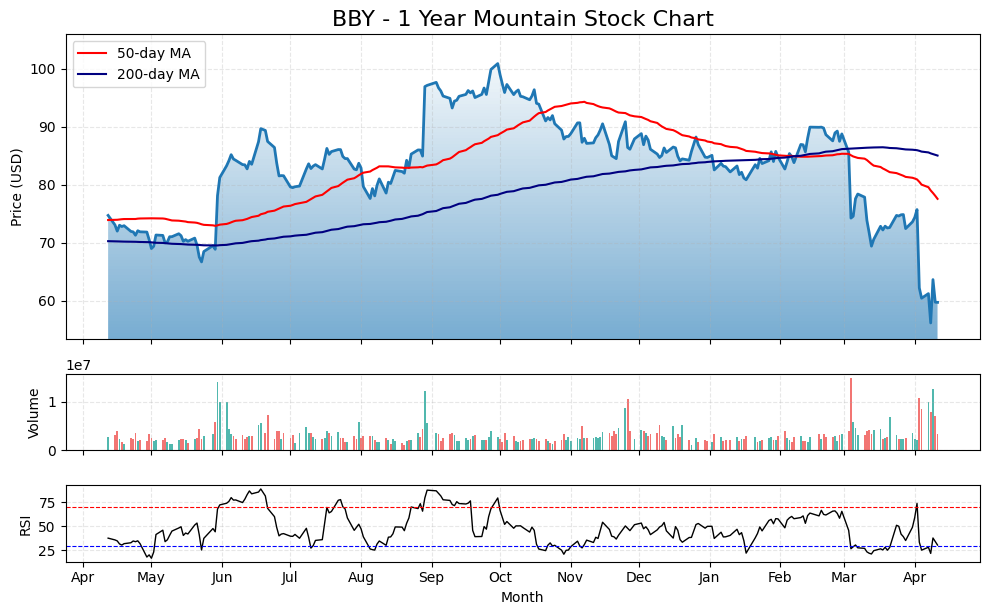
BBY has had a rough stretch over the past year, and the chart makes that pretty clear. What started as a relatively steady climb into the summer and early fall took a hard turn downward once late January rolled around. The decline accelerated sharply in March and into April, signaling a significant shift in sentiment or possibly a reaction to broader market or company-specific events.
Moving Averages and Trend
The 50-day moving average began rolling over several months ago and is now trending steeply downward. It crossed below the 200-day moving average—a bearish crossover known for suggesting deeper weakness ahead. Meanwhile, the 200-day moving average has flattened out and is beginning to tilt down as well. That combination shows there’s been enough sustained downward pressure to reverse the broader trend that had been building for much of last year.
Price Action and Support
From a price standpoint, BBY broke below a key support area around the mid-$70s range and is now trying to hold around the $60 level. There was a brief attempt to bounce, but it looks more like a pause in selling rather than a strong reversal. The overall structure shows a series of lower highs and lower lows, reinforcing the downtrend.
Volume Insight
Volume has been elevated during the sharp drops, especially in late March and early April. That typically indicates strong conviction on the sell side. The high red bars during those sessions point to institutional-sized selling. There’s also a noticeable lack of follow-through on up days, which suggests buying interest remains tentative at best.
RSI Momentum
The RSI (Relative Strength Index) has been parked below the 30 line recently, which signals the stock is in oversold territory. That doesn’t automatically mean a rebound is coming, but it does suggest the recent selling has been aggressive. Earlier in the year, RSI repeatedly tagged the overbought zone before reversing, a pattern often seen ahead of extended pullbacks. Now, with RSI hanging low, it’ll be important to watch if a bullish divergence starts forming or if momentum continues to trail off.
Overall Take
The technical setup reflects a stock under real pressure, breaking down from prior support levels and struggling to find a base. The trend is clearly negative for now, and while oversold conditions could spark a short-term bounce, the broader picture will need time to reset before any real recovery starts to take shape.
Management Team
Best Buy’s leadership is headed by Corie Barry, who stepped into the CEO role in 2019 after spending over 20 years with the company. Her experience spans finance, operations, and strategy, and she’s played a central role in guiding Best Buy through major digital and retail shifts. Before taking on the top job, she served as the company’s CFO and was instrumental in pushing forward its transformation initiatives, including the expansion into health technology and digital services.
Supporting her is Matt Bilunas, the company’s Chief Financial Officer and Executive Vice President of Enterprise Strategy. He’s known for maintaining a conservative financial approach while ensuring the company remains agile in the face of shifting economic conditions. The rest of the executive team includes leaders with deep backgrounds in retail operations, customer experience, and supply chain efficiency, all of which are vital as Best Buy works to stay competitive in a fast-changing retail environment.
Valuation and Stock Performance
As of April 2025, Best Buy’s stock is trading near $59.80, well off its 52-week high of $103.71. The drop of over 40 percent suggests the stock may now be trading below fair value. Analysts currently estimate a consensus price target around $91.28, pointing to a potential upside of over 50 percent from the current level if sentiment and performance stabilize.
Looking at valuation metrics, the trailing price-to-earnings ratio sits at 13.96, while the forward P/E is even more attractive at 9.56. That tells us the market is pricing in modest earnings growth or possibly bracing for further earnings pressure. The price-to-sales ratio is just 0.31, and the price-to-book ratio stands at 4.50, both of which are relatively low for a well-known, profitable brand in the retail space.
Even with recent price weakness, Best Buy has managed to hold strong on profitability metrics. Return on equity is a solid 31.63%, and return on assets comes in at 7.29%. These numbers highlight that the company continues to generate value for shareholders and use capital effectively. On top of that, the 6.29% dividend yield offers ongoing income, which adds a layer of support for the stock, particularly during periods of market volatility.
Risks and Considerations
There are clear risks to consider going forward. The most pressing near-term issue stems from new tariffs on imported electronics from key markets like China and Mexico. These added costs could either squeeze margins or be passed on to customers, neither of which is ideal in a competitive retail space. Consumers already facing inflation fatigue may hesitate to pay more, putting pressure on unit sales.
The business also leans heavily on discretionary spending, which means any significant pullback in consumer confidence or a broader economic slowdown could hurt demand. Best Buy has built up a loyal customer base, but it competes directly with online-first players and discount-focused retailers that can easily steal market share when money gets tight.
From a financial standpoint, the company’s high debt-to-equity ratio—around 144%—stands out. It’s not immediately alarming, but it does indicate that the balance sheet is more leveraged than some investors may like, especially in a rising rate environment. Liquidity also looks tight with a current ratio just slightly above 1.0, meaning there’s not a ton of slack if conditions worsen.
Execution risk is another factor. As the company pushes into new areas like health technology and small-format stores, it’ll need to prove it can maintain margins and scale these initiatives effectively. The pivot could pay off in the long run, but it requires investment and patience, and missteps along the way would likely weigh on results.
Final Thoughts
Best Buy is navigating a tough retail landscape, but it’s doing so with experience and a clear strategy. Leadership appears focused and measured, making smart moves to stay competitive while managing risk. While the stock has taken a hit over the past year, that pressure has pushed valuation to levels that may appeal to patient investors.
The balance of risk and reward is something to watch closely. Tariffs and macroeconomic uncertainty are real headwinds, and the company needs to continue executing well on its shift toward service and subscription-based models. At the same time, the fundamentals aren’t broken. Cash flow is strong, profitability remains intact, and the dividend yield is among the highest in the sector.
Whether the stock rebounds in the near term or not, the foundation is there. It’s a company that’s been through cycles before and still finds ways to deliver. The current moment may be more about surviving the turbulence than sprinting ahead, but there’s still a sense of control in how the business is being run—and that counts for something.