

Updated 4/11/25
Based in Lynchburg, Virginia, this regional bank has carved out a loyal customer base across Central and Western Virginia. It focuses on traditional community banking—lending, deposits, and service—without getting caught up in the noise. Since its start in 1999, the bank has steadily grown both its presence and its bottom line. It’s not trying to be a Wall Street darling, and that’s exactly why it might be appealing. BOTJ is about solid financials, careful risk management, and quietly rewarding shareholders through a reliable dividend.
Recent Events
BOTJ has had a solid stretch over the past year, with shares climbing over 42%. That kind of performance stands out, especially in a year where most bank stocks were fighting to stay afloat. The stock touched a high of $17.05 before settling around the $14.25 mark, still holding onto healthy gains.
Earnings per share came in at $1.75 over the trailing twelve months, giving it a price-to-earnings ratio around 8. That’s on the lower end, especially for a regional bank with a return on equity north of 12%. Sure, earnings took a hit recently—down about 23% year-over-year—but that seems to be more about provisioning and the broader interest rate environment than any red flags in the business itself.
What stands out more is the strength of BOTJ’s balance sheet. With $73 million in cash and just over $23 million in debt, the bank is sitting in a position that most CFOs would envy. Plenty of cushion there, which is always a plus when evaluating dividend safety.
Key Dividend Metrics
📅 Dividend Yield: 2.78%
💰 Annual Dividend: $0.40 per share
📈 5-Year Average Yield: 2.46%
🔄 Payout Ratio: 22.86%
🧱 Dividend Date: March 21, 2025
🔻 Ex-Dividend Date: March 7, 2025
⏳ Last Dividend Increase: Gradual, consistent trend
🧮 Shares Outstanding: 4.54 million
💼 Institutional Ownership: 23.2%
👥 Insider Ownership: 15.4%
Dividend Overview
BOTJ doesn’t pay a flashy dividend, but it’s consistent—and more importantly, well-covered. At $0.40 per share annually, the bank is only distributing about 23% of its earnings. That leaves a lot of breathing room. It’s not uncommon for banks to keep their payout ratios low, especially when they want to preserve capital and reinvest in operations. BOTJ fits that mold.
The current dividend yield of 2.78% edges out the bank’s five-year average of 2.46%, suggesting the stock hasn’t been bid up too far above its income potential. That’s actually a nice sweet spot—investors get a slightly higher yield than usual, but without sacrificing the stability or consistency of the payout.
And for those who appreciate valuation metrics, the stock is trading just below its book value (Price/Book at 0.99). It’s not expensive, and that makes the dividend feel even more rewarding. When you buy something at a discount and it pays you regularly? That’s a classic setup for income-focused investors.
Dividend Growth and Safety
One of the strongest points in BOTJ’s favor is how safe its dividend looks right now. A sub-23% payout ratio tells us the bank could weather some earnings softness and still maintain its dividend without issue.
Dividend growth here isn’t dramatic, but it’s steady. BOTJ doesn’t rush to boost its dividend unless the fundamentals support it. That’s the kind of discipline long-term investors should appreciate. It means management is thinking beyond the next quarter and keeping the balance sheet in good shape.
From a profitability standpoint, things look solid. Operating margins are around 20%, and profit margins come in at about 17.6%—strong numbers for a small regional player. Even though return on assets is under 1%, return on equity above 12% shows that BOTJ knows how to get good results out of its capital base.
The bank also generates real cash. Over $8.5 million in operating cash flow in the last twelve months reinforces the idea that this dividend is built on a strong foundation—not just earnings on paper, but actual cash in the door.
Another reassuring sign is the low beta of 0.43. That tells you the stock isn’t likely to bounce around wildly with every market headline. For income investors who value predictability and lower volatility, that’s a plus.
Cash Flow Statement
Bank of the James Financial Group closed out the trailing twelve months with $8.5 million in operating cash flow, reflecting a steady performance despite a modest decline from the previous two years. The bank’s free cash flow for the same period was $5.96 million, again slightly lower than in prior years but still comfortably positive. This suggests the bank’s core business is generating enough internal capital to support operations and its dividend strategy without needing to tap external financing.
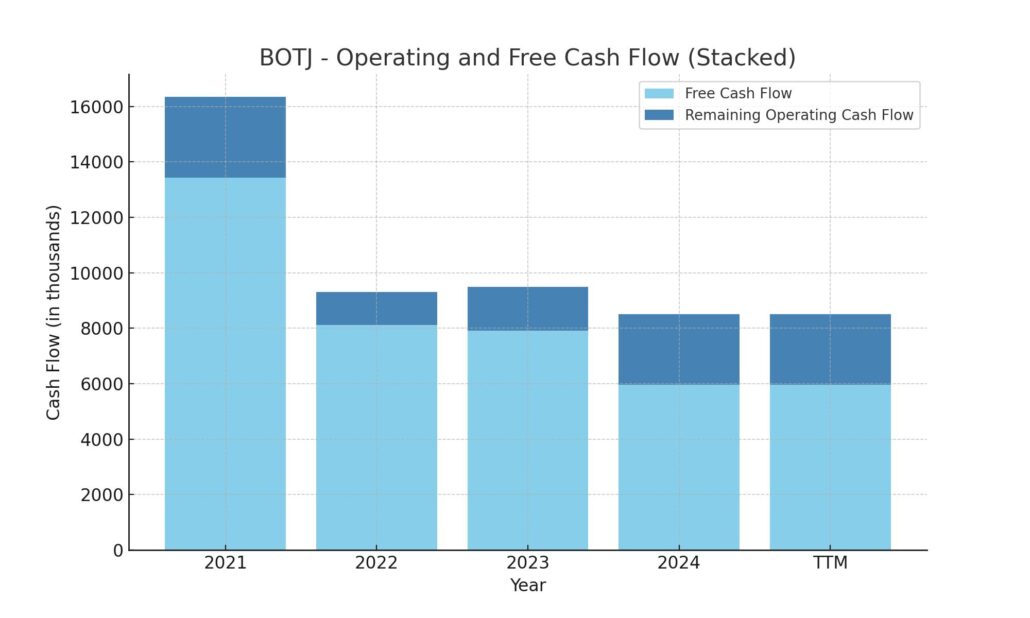
On the investing side, BOTJ reported a cash outflow of $11.17 million, which aligns with its ongoing capital investments—most notably, a $2.55 million spend in capital expenditures. Financing activity added $1.14 million in net cash, a notable shift from the $26.9 million inflow in 2023, largely driven by prior-year balance sheet adjustments. Ending cash stood at $73.3 million, down slightly from last year but still healthy. This liquidity position, combined with modest debt repayments and no share repurchases, reinforces the bank’s conservative financial stance and leaves room for flexibility going forward.
Analyst Ratings
📉 Bank of the James Financial Group (NASDAQ: BOTJ) currently does not have active analyst coverage, meaning there haven’t been any formal upgrades, downgrades, or a published consensus price target from major research firms. 📊 This is fairly common among smaller regional banks, which often fly under the radar of the big institutional analysts despite steady operational performance.
📌 Even without regular analyst input, BOTJ continues to deliver the kind of fundamentals that keep long-term investors interested. With a low dividend payout ratio of just 22.86%, the bank shows a disciplined approach to returning capital while retaining enough to reinvest or navigate bumps in the road. Its return on equity sits at a respectable 12.72%, and an operating margin of 20.06% shows it runs a tight and efficient ship.
💡 The stock’s trailing P/E ratio of 8.06 suggests that it may be undervalued compared to industry peers, particularly considering its reliable cash flow and healthy profit margins. While macroeconomic concerns have put some pressure on regional lenders, BOTJ’s performance remains steady—and for now, investors will need to rely on the numbers rather than Wall Street commentary to assess where it’s headed.
Earning Report Summary
A Softer Quarter, But Still Steady
Bank of the James Financial Group ended 2024 with a fourth-quarter net income of $1.62 million, which came out to $0.36 per share. That’s a step down from the $2.11 million, or $0.45 per share, they reported in the same quarter a year earlier. While the bottom line dipped, the bank did manage to grow its net interest income, which landed at $7.69 million for the quarter. That’s up from $7.39 million last year—a sign that the bank’s lending operations are still generating solid returns, even in a more cautious economic climate.
The fourth quarter was clearly marked by some earnings pressure, which isn’t surprising given the broader rate environment and tighter lending conditions. But the fact that interest income continued to tick up shows resilience in the core business.
Full-Year Picture Still Healthy
Looking at the full year, net income came in at $7.94 million, a notch lower than the $8.7 million they posted in 2023. On a per-share basis, earnings fell slightly from $1.91 to $1.75. Nothing alarming here—more of a modest reset following a few strong years.
Net interest income for the year totaled $29.24 million, just a touch below the $29.74 million from the prior year. It’s a tight range, and one that shows the bank is keeping its margins intact even as cost pressures and loan competition weigh on the industry.
All in all, the year-end numbers suggest BOTJ is still on solid footing. Profitability dipped a bit, but there’s no major red flag. For a community bank focused on long-term growth and stability, a year like this looks more like consolidation than contraction.
Chart Analysis
Strong Momentum, Healthy Reversal
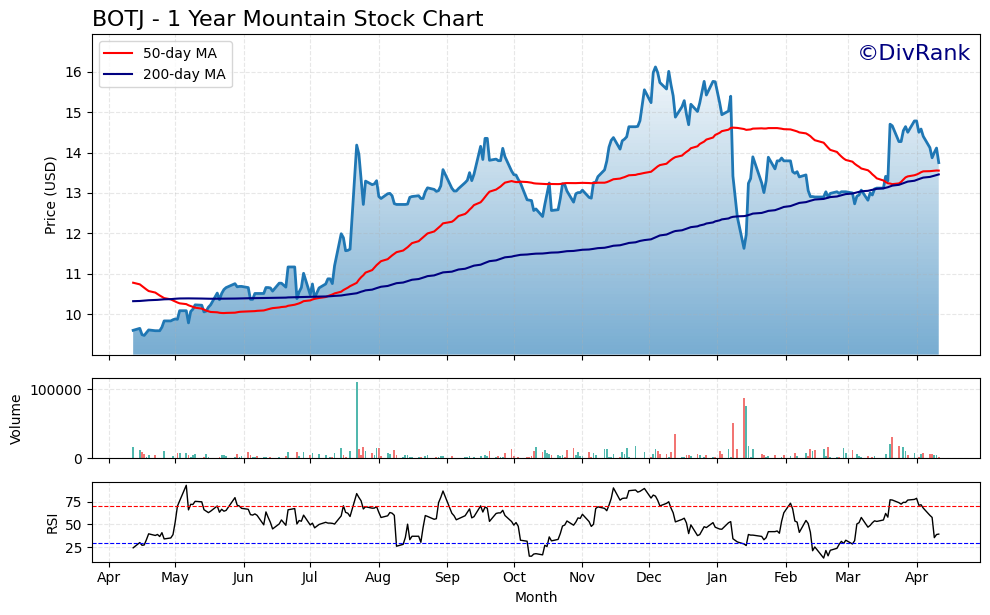
The chart for BOTJ over the past year tells a story of quiet strength, even with a few bumps along the way. Starting from the low $10s in April, the stock picked up noticeable momentum through summer, breaking above both the 50-day and 200-day moving averages. That crossover in early July was an early sign of a strong uptrend forming, and sure enough, the stock pushed past $14 by August.
It wasn’t all smooth sailing. After topping out near $16 late in the year, the stock retraced some gains heading into February. But what stands out is how the price respected the 200-day moving average during this correction. It dipped briefly below it, but quickly reclaimed and held it, which suggests support from longer-term participants who aren’t flinching at short-term volatility.
Volume and RSI Insight
Volume has stayed relatively subdued, except for a few sharp spikes, one of which aligns with the big price surge in late summer. These bursts tend to confirm that the moves weren’t driven purely by low liquidity but had real participation behind them. Since February, volume has been lighter, but the price has managed to climb back toward prior highs, a sign of underlying strength even without much fanfare.
The RSI confirms much of this movement. It crept into overbought territory a couple of times—most notably in December and again in early April—before easing off. These weren’t extreme spikes, just measured moves suggesting interest without the kind of overheating that leads to big corrections. More recently, RSI has pulled back from those elevated levels, which could be viewed as a reset rather than a red flag.
Moving Averages Still Favorable
The 50-day moving average began curling lower at the start of the year as the stock consolidated, but it never broke sharply below the 200-day. In fact, as of now, both moving averages are flattening and converging just under the current price, hinting at a possible new base forming. If the stock can hold above both lines in the coming weeks, that would strengthen the case for continuation.
BOTJ has managed to keep its footing even when broader sentiment was shaky, and the price action here shows a calm, steady progression rather than sudden swings. That kind of behavior often reflects confidence in the fundamentals more than short-term hype.
Management Team
Bank of the James Financial Group is led by a team that has clearly prioritized stability and local expertise. At the top is Robert R. Chapman III, the bank’s founder and CEO, who has been with the organization since its inception in 1999. His long tenure reflects both consistency and a deep understanding of the regional banking landscape. Chapman is supported by President Michael A. Syrek, who brings extensive operational and lending experience, key to navigating the challenges facing community banks today.
Other members of the leadership team include Brandon P. Farmer as Executive Vice President and Chief Operations Officer, Harry P. “Chip” Umberger overseeing credit as Chief Credit Officer, and Brian E. Cash directing the mortgage division. J. Todd Scruggs serves as Chief Financial Officer, a role he’s held since 2003, offering decades of financial oversight. The structure of the executive team emphasizes accountability, continuity, and a grounded approach to managing the bank’s long-term growth.
Valuation and Stock Performance
Bank of the James Financial Group’s stock (NASDAQ: BOTJ) has quietly outperformed much of the market over the past year. It reached a 52-week high of $17.05 and a low of $9.65, recently settling around $14.29. That puts it comfortably in the upper half of its trading range. While it’s still a micro-cap with a market value of around $64 million, BOTJ’s recent price action speaks to underlying strength, especially in a volatile environment for banks.
From a valuation standpoint, the stock trades at a price-to-earnings ratio of 8.06, which suggests it’s modestly priced compared to sector averages. The price-to-book ratio sits right around 0.99, meaning the stock is trading very close to its book value. That kind of alignment between book and market value often points to a well-grounded balance sheet and relatively low investor speculation.
In terms of performance, the stock has climbed more than 40% over the past year, a sharp contrast to the broader financial sector and even the overall market. This gain, despite the absence of significant analyst coverage, shows that investor interest may be rooted in the fundamentals rather than hype. The stock has also maintained this strength without heavy trading volumes, reinforcing its character as a steady performer rather than a speculative play.
Risks and Considerations
While the outlook for Bank of the James is generally positive, there are some meaningful risks to weigh. The most obvious is its geographic concentration. As a regional bank focused primarily in Virginia, it’s tied closely to the health of the local economy. A downturn in the area’s real estate market or job losses could ripple through the loan portfolio more quickly than it would for a nationally diversified bank.
Interest rate volatility also presents a key risk. Banks rely on the spread between what they pay on deposits and what they earn on loans. If rates move sharply or unpredictably, it can compress margins. BOTJ has managed this well so far, but it remains a risk worth watching. In addition, because of its size and market cap, the stock may not offer the same liquidity as larger banks. For investors, this could mean wider bid-ask spreads and slower trade execution.
There’s also the matter of information access. Without consistent analyst coverage, it’s harder for investors to get third-party research or forecasts. This puts more weight on individual due diligence and increases the importance of closely monitoring earnings and regulatory filings. Lastly, while community banks like BOTJ often fly under the radar, they still face stiff competition—from both larger financial institutions and digital-first challengers in the fintech space.
Final Thoughts
Bank of the James Financial Group stands out as a steady, well-managed bank that has stayed true to its roots. It isn’t chasing aggressive expansion or high-risk lending strategies. Instead, it’s delivering consistent results and returning value through dividends and modest stock appreciation. Its leadership team has been in place for years, offering a clear sense of continuity and operational discipline.
Valuation-wise, the stock doesn’t appear overextended. In fact, the market seems to be valuing BOTJ right in line with its fundamentals, which could appeal to investors looking for grounded opportunities in a sometimes unpredictable sector. That said, the risks aren’t negligible. The bank’s size, regional footprint, and lack of broad visibility all mean it requires more active attention from investors.
Still, for those willing to keep an eye on it, BOTJ offers a combination of stability, modest growth, and dividend income that’s hard to ignore. It may not dominate the headlines, but its performance over the past year suggests a business that knows how to operate with focus and long-term discipline.