

Updated 2/25/26
ACNB Corporation (NASDAQ: ACNB) is a regional financial institution serving communities across South Central Pennsylvania and Northern Maryland. Backed by over 160 years of banking experience, the company has built a reputation for steady performance, disciplined capital management, and consistent dividend payouts. With a current market cap of approximately $531 million and a forward dividend yield of 2.79%, ACNB continues to attract income-focused investors looking for reliability and modest growth. Under the leadership of CEO James P. Helt, the bank has maintained strong profitability, a healthy balance sheet, and a low payout ratio near 38%. Earnings per share stand at $3.60, supported by solid loan performance and stable credit quality. With the Traditions Bancorp acquisition now in the rearview mirror and the stock trading near its 52-week high, ACNB enters this phase of its evolution with an expanded regional footprint and a continued commitment to its conservative, performance-driven approach.
Recent Events
ACNB has remained active on the operational and strategic front heading into early 2026. The most significant development over the past year was the successful completion of the Traditions Bancorp acquisition, which CEO James Helt had positioned as a milestone that would help form one of Pennsylvania’s largest community banks under $5 billion in assets. That integration effort has been the dominant story for the company, with management focused on retaining customer relationships and harmonizing operations across the expanded footprint spanning South Central Pennsylvania and Northern Maryland.
On the dividend front, ACNB delivered a notable increase in its most recent quarterly payment, raising the per-share payout to $0.38 from the prior $0.34, a jump that brought the annualized dividend to $1.52. That represents a meaningful step up from the $1.28 annual rate that was in place at the start of 2025, and it signals management’s confidence in the earnings power of the combined organization. The stock has responded accordingly, climbing to $51.17 and trading near the top of its 52-week range of $35.70 to $53.89, reflecting a broader rerating of the company as integration progress has become more visible.
The bank’s return on assets of 1.32% and return on equity of 10.25% remain at healthy levels for a community bank of this size, and profit margins have held firm at roughly 25%. Net income for the trailing twelve months reached $37.05 million on revenue of $146.68 million, reflecting the larger combined entity now generating meaningfully more in top-line income than the standalone ACNB of a year ago.
Key Dividend Metrics
📈 Dividend Yield: 2.79% forward yield
💵 Annual Dividend: $1.52 per share
📊 Payout Ratio: 38.33%
⏳ 5-Year Average Yield: 3.38%
📆 Most Recent Dividend Payment: $0.38 per share (December 2025)
📉 Recent Dividend Increase: Raised from $0.34 to $0.38 per quarter
🧾 Dividend History: Steady with consistent increases across recent quarters
🛡 Dividend Safety: Well-covered by earnings with a conservative payout ratio
Dividend Overview
ACNB’s forward dividend yield of 2.79% is supported by a quarterly payout of $0.38 per share and an annualized total of $1.52. While that yield sits modestly below the five-year average of approximately 3.38%, the compression largely reflects the stock’s strong price appreciation rather than any reduction in income. The absolute dollar amount being paid to shareholders is higher today than at any prior point in the company’s recent history, and that is the more meaningful datapoint for long-term income investors.
The payout ratio of 38.33% against earnings per share of $3.60 leaves plenty of room for the dividend to continue growing without straining the bank’s capital position. Management has shown a clear preference for steady, incremental increases rather than large one-time moves, and the dividend history bears that out. From $0.28 per quarter in early 2023, the payment has climbed through $0.30, $0.32, $0.34, and now $0.38, a pattern of deliberate and disciplined progression.
One of the most reassuring aspects of ACNB’s dividend profile is that it has not relied on special payments or accounting adjustments to prop up the yield. Each quarterly dividend reflects genuine earnings coverage, and the conservative payout philosophy gives the company flexibility to absorb unexpected costs, including integration expenses from the Traditions Bancorp deal, without putting the distribution at risk.
Dividend Growth and Safety
The trajectory of ACNB’s dividend over the past two-plus years tells a clear story of intentional growth. Starting at $0.28 per quarter in early 2023, the company has raised its payout five times to reach the current $0.38, representing a cumulative increase of roughly 36% in just under three years. The most recent increase, from $0.34 to $0.38, was the largest single step-up in that sequence, and it coincides with the expanded earnings base brought in by the Traditions Bancorp acquisition.
Dividend safety remains firmly intact. With EPS at $3.60 and the annual dividend at $1.52, the coverage ratio sits comfortably above 2x. Even under a scenario where earnings softened by 20%, the dividend would remain well-covered with a payout ratio still below 50%. That kind of cushion is precisely what income investors should be looking for in a regional bank operating in a still-uncertain rate environment.
Return on equity at 10.25% and return on assets at 1.32% both reflect a management team that continues to generate sound returns from its capital base. A profit margin of 25.26% is solid for a community bank, and the disciplined approach to expense management that characterized the pre-merger ACNB appears to be carrying forward into the combined organization. Insider and institutional ownership patterns continue to reflect alignment between management incentives and shareholder outcomes, reinforcing the credibility of the dividend commitment.
Chart Analysis
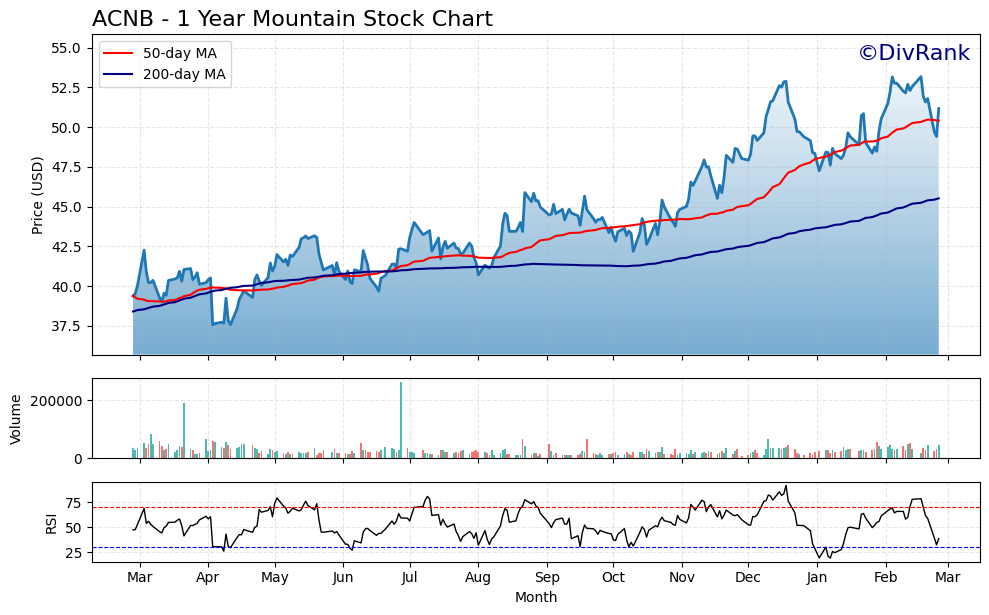
ACNB has staged an impressive recovery over the past twelve months, climbing from a 52-week low of $37.56 to its current price of $51.17, a gain of roughly 36% from the trough. That kind of price appreciation in a community bank stock reflects a meaningful shift in investor sentiment, and the trend has been consistently constructive throughout the period. The shares came within striking distance of their 52-week high of $53.18 earlier this cycle, and at the current price they sit just 3.78% below that peak, suggesting the bulls have maintained control without the stock becoming technically extended.
The moving average picture reinforces the bullish intermediate-term thesis. ACNB is trading above both its 50-day moving average of $50.41 and its 200-day moving average of $45.52, and the 50-day has crossed above the 200-day to form what technicians refer to as a golden cross. That configuration typically signals that shorter-term momentum is accelerating relative to the longer-term trend, and for a dividend stock it often corresponds to a period of relative price stability that income investors tend to appreciate. The $45.52 level on the 200-day average now represents meaningful structural support roughly 11% below the current price, providing a reasonable cushion for long-term holders.
The RSI reading of 38.71 introduces an interesting wrinkle to the otherwise constructive setup. At that level the stock is approaching oversold territory without having crossed the traditional 30 threshold, which implies that the recent consolidation near the highs has worked off some of the prior momentum without triggering panic selling. For a dividend investor, a cooling RSI while price remains above both key moving averages can actually represent an attractive entry condition, as it suggests the stock may be digesting gains rather than rolling over in a meaningful way.
Taken together, the technical picture for ACNB is constructive for income-oriented investors with a patient time horizon. The primary trend is up, the moving average structure is healthy, and the modest pullback in momentum metrics has created a setup that looks more like consolidation than distribution. Dividend investors who prioritize entry price as part of total return management will find the current zone reasonable, particularly given the solid support levels the moving averages have established beneath the current price.
Cash Flow Statement
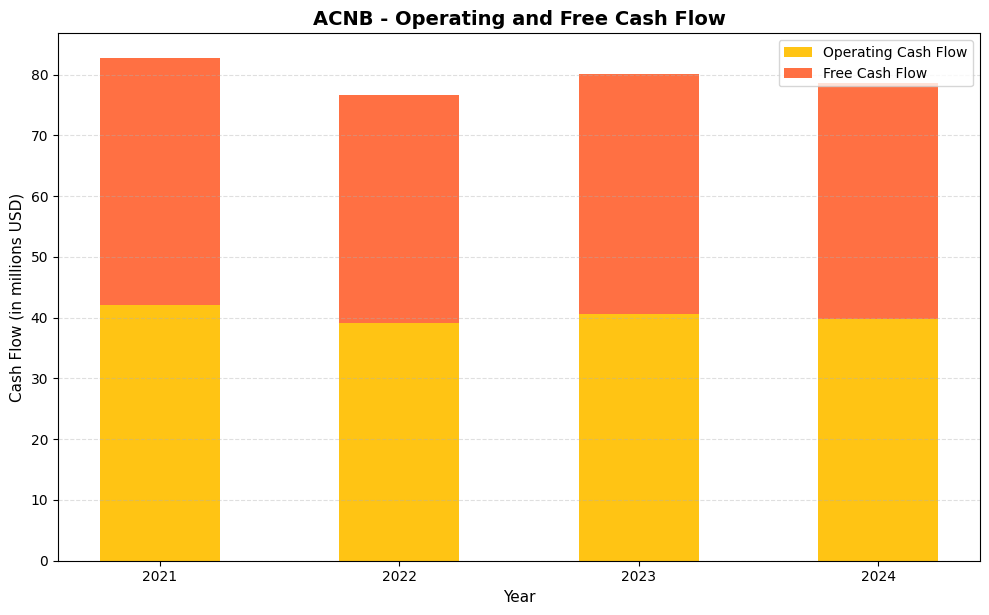
ACNB has generated remarkably consistent cash flows over the four-year period, with operating cash flow holding in a tight range between $39.2 million and $42.1 million annually. Free cash flow has tracked closely alongside, running from $37.4 million to $40.5 million, which reflects the capital-light nature of community banking and ACNB’s disciplined approach to capital expenditures. For 2024, the company produced $39.8 million in operating cash flow and $38.8 million in free cash flow, leaving substantial room above the dividend obligation. That kind of coverage ratio gives income investors a high degree of confidence that the current payout is well-supported by actual cash generation rather than accounting earnings alone.
What stands out across the full trend is the stability rather than any dramatic growth trajectory, and for a dividend growth investor that consistency is genuinely reassuring. The modest dip in 2022 to $39.2 million in operating cash flow recovered promptly in 2023, and the 2024 figure lands squarely in line with the long-run average, suggesting the business is not experiencing any structural deterioration in cash generation. Capital expenditure requirements have remained minimal throughout, as the gap between operating and free cash flow has consistently been less than $1.5 million per year. That capital efficiency means ACNB can sustain its dividend, fund modest loan growth, and maintain regulatory capital buffers without being forced to choose between competing financial priorities, a position that supports the case for continued incremental dividend increases going forward.
Analyst Ratings
Analyst coverage of ACNB remains focused on the bank’s consistent execution and the earnings potential unlocked by the Traditions Bancorp acquisition. The current consensus among the three analysts covering the stock is a buy, with price targets ranging from $56.00 on the low end to $57.00 at the high, and a mean target of $56.67. Against the current price of $51.17, that average target implies upside of approximately 10.8%, a reasonable premium for a conservatively run regional bank trading near the top of its 52-week range.
The tight clustering of price targets between $56 and $57 reflects a high degree of agreement among analysts on the bank’s near-term earnings trajectory, suggesting that the investment case is well-understood and that there are few disputed assumptions about where earnings are headed. Analysts have pointed to ACNB’s reliable profitability, the successful integration of Traditions Bancorp, and the bank’s disciplined capital allocation as the primary drivers of their constructive outlook.
With the stock at $51.17 and book value per share at $40.49, ACNB trades at a price-to-book ratio of 1.26, a modest premium that reflects the market’s acknowledgment of the bank’s above-average returns on equity. The P/E ratio of 14.21 is reasonable for a regional bank generating consistent earnings growth, and the analyst community appears to view the current valuation as still offering a worthwhile entry point relative to the mean price target of $56.67.
Earning Report Summary
ACNB Corporation has delivered full-year results reflecting the combined strength of the post-acquisition organization. Net income reached $37.05 million for the trailing twelve months, with earnings per share of $3.60. Revenue came in at $146.68 million, a substantially larger top-line figure than the pre-merger standalone bank was generating, and one that reflects the meaningful scale added through the Traditions Bancorp transaction. Profit margins settled at 25.26%, a solid result for a community bank managing through an integration process.
Strong Core Metrics
Return on average assets finished at 1.32% and return on equity at 10.25%, both healthy benchmarks for a regional institution of this size. The bank has maintained its reputation for disciplined underwriting and cost control even as it absorbed a new organization, and those core metrics validate the quality of the integration effort. Net interest margin trends and funding cost pressures remain relevant considerations given the broader rate environment, but the overall profitability picture reflects a bank operating with confidence in its expanded footprint.
Credit Quality and Noninterest Activity
Credit quality has remained a consistent strength for ACNB. The bank’s conservative approach to commercial and real estate lending has historically kept net charge-offs and non-performing loan ratios well below peer averages, and that discipline appears to have carried into the integration of the Traditions Bancorp portfolio. Noninterest income streams, including contributions from insurance commissions, wealth management, and mortgage-related activity, continue to provide meaningful diversification alongside the core net interest income base.
Expense Trends and Capital Strength
Integration-related expenses have been a feature of the cost structure over the past year, as is typical following an acquisition of this nature. Management has been transparent about those costs, and the market appears to have looked through them to the underlying earnings power of the combined bank. The tangible common equity position has benefited from the earnings retention enabled by the conservative 38.33% payout ratio, and capital adequacy ratios remain well above regulatory thresholds. Book value per share now stands at $40.49, reflecting the accumulated retained earnings and the balance sheet composition of the merged entity.
Looking Ahead
CEO James Helt and the management team have emphasized that the strategic rationale for the Traditions Bancorp acquisition was always about long-term value creation rather than short-term earnings accretion. With the integration now underway, the focus shifts to extracting the operational benefits of the combined organization, deepening customer relationships in the expanded market area, and maintaining the disciplined capital allocation philosophy that has defined ACNB’s approach for over 160 years. The recent dividend increase to $0.38 per quarter is a concrete signal that management views the earnings outlook with confidence.
Management Team
ACNB Corporation is led by President and CEO James P. Helt, a seasoned executive who has been part of the company for over 30 years. His leadership has been rooted in consistent execution and a strong commitment to community-focused banking. Helt has steered ACNB through different economic environments by sticking to fundamentals and avoiding unnecessary risks, and the successful navigation of the Traditions Bancorp acquisition represents arguably the most consequential strategic move of his tenure. His emphasis on smooth customer and employee transitions during the integration reflects the same long-term orientation that has characterized his leadership throughout.
Working alongside Helt is a group of experienced leaders including Executive Vice President and CFO Jason H. Weber, and Chief Strategy Officer Brett D. Fulk. Together, they have shaped a strategy built around stable growth, risk management, and responsible capital allocation. Weber’s oversight of the financial integration and Fulk’s strategic planning work have both been central to positioning the combined organization for its next chapter. The team’s deep local knowledge and disciplined approach to capital deployment remain evident in the bank’s financial results and the consistency of its dividend growth record.
Valuation and Stock Performance
As of late February 2026, ACNB’s stock is trading at $51.17, giving it a market cap of approximately $531 million. At a trailing price-to-earnings ratio of 14.21, the stock has re-rated meaningfully upward from where it stood a year ago, reflecting both the earnings contribution of the Traditions Bancorp acquisition and a broader improvement in investor sentiment toward well-run regional banks. The valuation is no longer as deeply discounted as it once appeared, but at 14x earnings it still represents a reasonable multiple for a bank generating double-digit returns on equity.
Over the last 12 months, the stock has ranged from $35.70 to $53.89, and the current price of $51.17 places it near the top of that range. The move from the low end reflects the market’s growing recognition of the value created through the acquisition and the bank’s continued earnings consistency. At a price-to-book ratio of 1.26 against book value per share of $40.49, the stock carries a modest premium to tangible net worth, which is justified by the bank’s above-average profitability metrics. With a beta of 0.86, ACNB offers relatively contained volatility compared to the broader market, a characteristic that continues to appeal to income-oriented investors who prioritize capital preservation alongside yield. The mean analyst price target of $56.67 suggests there remains a credible path to further appreciation even from current levels.
Risks and Considerations
Geographic concentration remains a persistent feature of ACNB’s risk profile. The bank’s operations are centered in South Central Pennsylvania and Northern Maryland, meaning that a localized economic downturn, a significant employer departure, or regional real estate stress could have a more direct and immediate impact on loan performance than would be the case for a more geographically diversified institution. The Traditions Bancorp acquisition has expanded the footprint modestly, but the fundamental concentration in a defined regional corridor remains.
Integration risk is a near-term consideration that warrants attention. Merging two community banks involves combining technology platforms, reconciling lending cultures, and retaining key personnel on both sides of the transaction. Any missteps in that process could elevate costs, disrupt customer relationships, or surface credit quality issues in the acquired portfolio that were not fully visible during due diligence. Management’s track record is encouraging, but acquisitions introduce complexity that steady-state operations do not.
Interest rate sensitivity continues to be a structural feature of community banking. ACNB’s net interest margin is subject to pressure when funding costs rise faster than loan yields, a dynamic that has affected the entire regional banking sector over the past several years. The direction of rate policy and the pace of repricing across the balance sheet will remain important variables for margin trajectory and, ultimately, earnings growth. Regulatory requirements and compliance costs, which have expanded broadly across the banking industry, represent an ongoing overhead burden that can be difficult to predict or control with precision.
Final Thoughts
ACNB enters 2026 as a meaningfully larger and more capable institution than it was just a year ago. The Traditions Bancorp acquisition has expanded the bank’s market reach, deepened its customer relationships, and contributed to an earnings base that now supports a quarterly dividend of $0.38 per share, the highest in the company’s recent history. The 36% cumulative dividend increase since early 2023 is not an accident; it is the product of consistent earnings growth, disciplined capital management, and a management team that understands its responsibilities to long-term shareholders.
The stock’s move toward the top of its 52-week range and the re-rating of its price-to-earnings multiple from the deeply discounted levels of a year ago reflect a market that is beginning to properly value the combined organization. With analyst price targets clustered in the $56 to $57 range, there is still a reasonable margin of appreciation available from current levels, though investors coming to the story now should recognize that the most dramatic valuation gap has already narrowed.
For dividend growth investors, ACNB’s combination of a well-covered 2.79% yield, a conservative 38.33% payout ratio, a clear track record of annual increases, and a management team with decades of institutional knowledge represents exactly the kind of steady, compounding income story that rewards patience. The bank is not chasing headlines or making aggressive bets; it is executing on fundamentals and delivering consistent value, year after year.