

Updated 4/13/25
ABM Industries (NYSE: ABM) provides essential facility services across sectors like aviation, education, manufacturing, and commercial real estate. With a history dating back to 1909, the company has built a reputation for consistent operations, steady cash flow, and long-term dividend growth. It’s managed by an experienced executive team led by CEO Scott Salmirs, who has focused on strategic realignment and operational efficiency. The stock currently trades around $46, with a forward dividend yield of 2.3% and a 56-year history of uninterrupted payouts. Recent earnings showed modest top-line growth and stable margins, despite some short-term pressure on cash flow due to system upgrades. Analysts have issued mixed ratings, but the average price target suggests room for upside. For investors who prioritize steady returns and reliable management in essential service industries, ABM offers a business model backed by discipline, adaptability, and a clear commitment to shareholder value.
Recent Events
Lately, ABM’s stock has been making some gentle moves. It recently bounced from a 52-week low of $40.85 up to $46.11 at the close on April 11—a jump of nearly 4% in a single day. That’s not something you usually see in a company like this, which tends to trade in a much more stable pattern. But with market sentiment shifting and investors seeking shelter in value-oriented names, it’s not too surprising.
The company’s latest earnings, covering the quarter ending January 31, 2025, were mixed. Net income saw a slight decline, and earnings per share came in at $1.27 over the trailing twelve months. Margins were a bit thin, with net profit just under 1%. Still, when you zoom out and look at the cash flow picture, the story is much more reassuring. ABM brought in $120.6 million in operating cash flow and nearly matched that in free cash flow—plenty of cushion for a healthy dividend.
Key Dividend Metrics
📈 Forward Yield: 2.30%
💸 Forward Annual Dividend Rate: $1.06
📆 Next Dividend Date: May 5, 2025
📉 Payout Ratio: 74.02%
📊 5-Year Average Yield: 1.83%
🧮 Free Cash Flow Payout Ratio: Solid, supported by $117.6M FCF
📉 Dividend Growth Streak: 56 years
💪 Debt/Equity Ratio: 93.3%
🏦 Cash on Hand: $59 million
Dividend Overview
At a forward yield of 2.30%, ABM isn’t trying to outpace the market with a sky-high payout. But when you compare it to its five-year average of 1.83%, the current yield is definitely on the higher side. That bump comes partly from recent share price softness and partly from a growing dividend that continues to quietly trend upward.
One of the reasons ABM’s dividend feels dependable is the nature of its business. Buildings don’t stop needing to be cleaned and maintained just because the economy slows down. That kind of steady demand creates a recurring revenue base, which in turn supports the consistency of their dividend policy.
Last year, ABM increased its dividend by 13%, a meaningful jump for a company in its sector. The quarterly payout now stands at $0.265 per share. And while the company’s EPS payout ratio is currently at 74%, it’s worth noting that free cash flow paints a stronger picture. The company’s ability to consistently generate cash helps maintain the dividend even in years where margins come under pressure.
Dividend Growth and Safety
If you’re looking for a long-term track record of reliability, ABM checks the boxes. The company has paid a dividend for 56 straight years—through economic downturns, rising rates, pandemics, and everything in between. It’s not flashy, but it’s steady, and that’s often what matters most for income investors.
Dividend growth has been modest historically, averaging around 5–6% over the past five years, but there’s been a noticeable push recently to accelerate that pace. Management seems committed to rewarding shareholders while maintaining flexibility to reinvest where needed.
One area to watch is the company’s balance sheet. With $1.66 billion in debt and a debt-to-equity ratio of around 93%, ABM does carry some leverage. That’s fairly typical for a capital-light service business, but in a rising-rate environment, it’s something to keep an eye on. That said, the company has a solid current ratio of 1.52 and $59 million in cash on the books. There’s no immediate red flag.
Insider ownership remains low, just under 2%, but institutional investors hold close to 97% of the float. That high institutional ownership signals a strong base of long-term holders who likely see ABM as a core part of an income-focused portfolio.
ABM might not be the type of stock that makes headlines, but for investors who value reliability, consistent dividends, and stable cash flows, it earns a place in the conversation. In a world full of market noise, sometimes quiet consistency is the best signal.
Cash Flow Statement
ABM Industries has maintained positive operating cash flow over the trailing twelve months (TTM), bringing in $120.6 million. While that’s a noticeable step down from the $226.7 million posted in the prior fiscal year, it still reflects the company’s ability to generate stable cash from core operations. Capital expenditures were fairly steady at $62.5 million for the TTM, in line with historical norms. As a result, ABM produced $58.1 million in free cash flow—again, lower than the previous year’s $167.3 million, but positive nonetheless, which is key for sustaining dividend payouts.
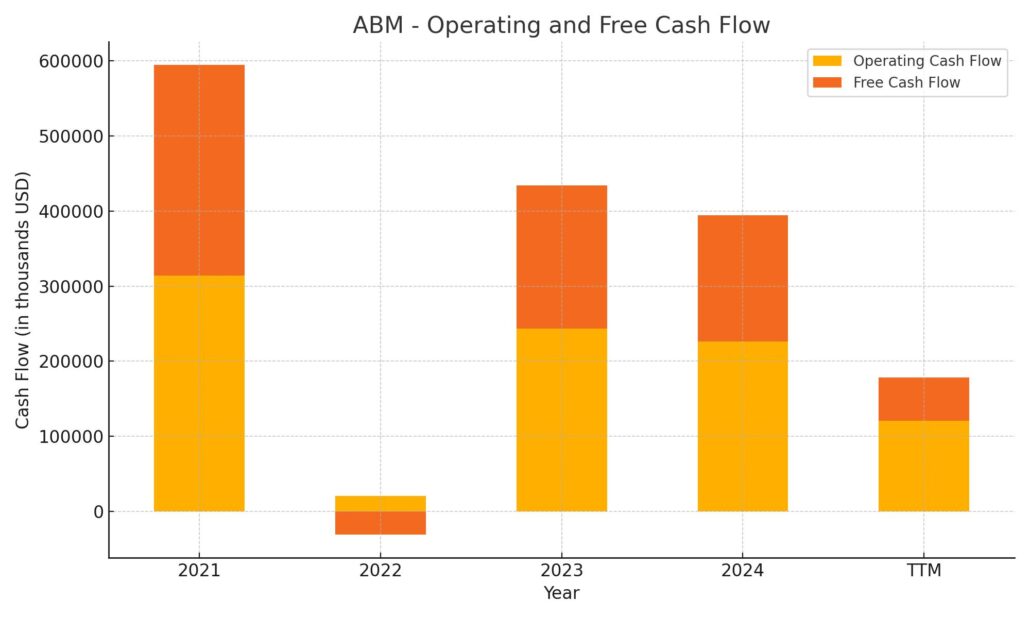
Investing cash flow shows deeper outflows, totaling $173.2 million in the TTM. This figure includes not only capital spending but likely acquisitions or strategic reinvestments, consistent with ABM’s growth-through-acquisition approach. On the financing side, the company brought in $54.9 million, thanks in part to net new debt issuance. It raised over $1.6 billion in new debt while repaying roughly $1.4 billion. Though leverage has increased, the final cash position of $60.2 million keeps liquidity on solid footing. These moves suggest active balance sheet management to support both operations and shareholder returns.
Analyst Ratings
📉 Analysts have been adjusting their outlook on ABM Industries over the past several months. In March 2025, UBS lowered its price target from $56 to $50 while maintaining a neutral stance. This move reflected some caution around recent earnings softness and a general slowdown in margin expansion, which has been a talking point for analysts closely watching operational efficiency.
🔽 Back in September 2024, another shift came when Deutsche Bank downgraded ABM from a buy to a hold rating and cut its price target from $65 to $43. The reasoning behind the downgrade was tied to muted growth momentum and increasing cost pressures, particularly in labor—a significant input for ABM’s service-heavy business model. The bank noted that while the company’s fundamentals remain stable, near-term headwinds could cap performance.
📊 The current analyst consensus sits at a hold, with an average price target of $53.67. That implies about 22% upside from where the stock is trading now. Price targets range from $50 on the low end to $56 on the high end. Overall, analysts appear to appreciate ABM’s dependable dividend and cash flow story, even if they’re holding back enthusiasm due to slower earnings growth and a cautious macro backdrop.
Earning Report Summary
Solid Start to the Year
ABM Industries kicked off fiscal 2025 on a steady note, posting $2.1 billion in revenue for the first quarter. That’s a 2.2% bump from where they were a year ago. Most of the growth came from core operations, with organic revenue up 1.6%, and the rest was helped along by some recent acquisitions. Among the standout performers, the Technical Solutions segment surged by 22%, thanks in large part to rising demand for microgrid and energy-related services. Aviation also had a good showing, growing 8% as airport-related services picked up new contracts and benefited from travel demand.
Some segments didn’t fare quite as well. The Business & Industry and Manufacturing & Distribution units saw minor revenue declines, though nothing that raised major red flags. Education continued to grow modestly, up around 2%, holding its ground as a stable contributor.
Earnings Hold Steady, Cash Flow Takes a Hit
ABM reported net income of $43.6 million for the quarter, working out to $0.69 per share. That’s just a hair below the $44.7 million or $0.70 they reported the same time last year. On an adjusted basis, earnings were actually up a bit—$0.87 per share versus $0.86 last year. Their adjusted EBITDA came in at $120.6 million, and they held a consistent 5.9% margin, which shows they’re still managing costs well even as growth levels out.
What did catch a few eyes was the cash flow situation. With a new enterprise planning system being rolled out, there were some timing issues that led to a temporary dip. Operating activities used $106.2 million in cash this quarter, and free cash flow was negative at $122.9 million. The company chalked it up to one-time impacts and expects these numbers to improve as the system gets up to speed.
Leadership’s Take and the Road Ahead
From the leadership side, there was a clear message: business fundamentals remain strong, and the longer-term outlook hasn’t changed. The team pointed to a healthy pipeline of new business opportunities and said demand across key end markets is still there. In fact, they felt confident enough to raise the lower end of their full-year adjusted EPS guidance. They’re now expecting to earn between $3.65 and $3.80 per share this fiscal year, up from their previous floor.
That kind of measured optimism sums up where ABM is right now. It’s not a blowout quarter, but it’s a solid start to the year—especially considering the operational changes they’re juggling behind the scenes. The consistent margins and growing revenue in higher-value segments show that the company is adapting well, even as it fine-tunes its systems and absorbs recent investments. Leadership seems content with the trajectory, and for a business built on dependable service, that’s often the kind of story investors like to hear.
Chart Analysis
Long-term Price Trend
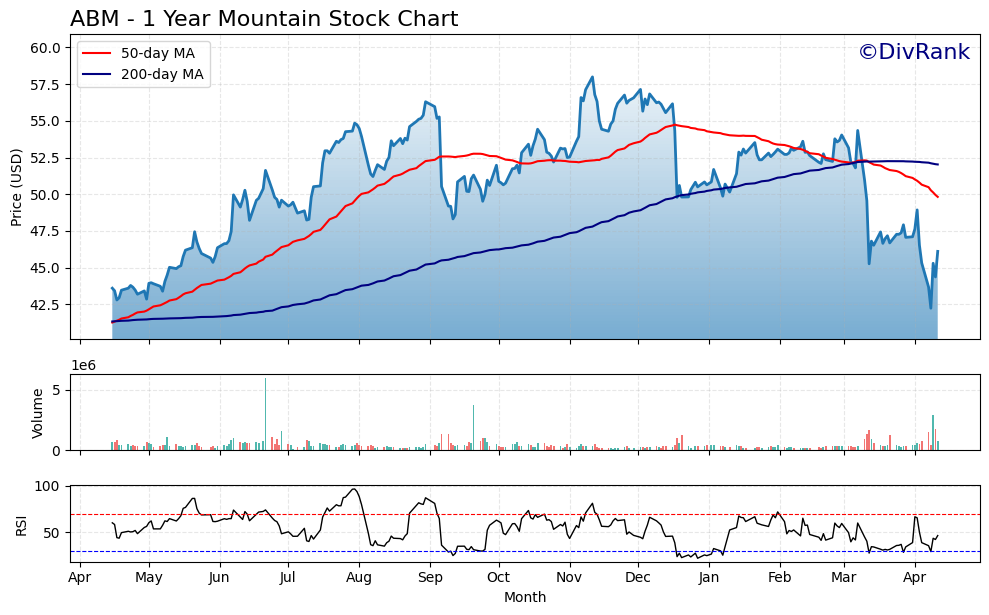
ABM (NYSE: ABM) has spent most of the past year in an upward trend, particularly from April through December, where the price climbed steadily from just under $43 to a peak near $58. That long stretch of gains reflected strength in the broader market and steady investor confidence. The red 50-day moving average moved well above the blue 200-day line for a good portion of the year, which typically signals positive momentum. However, that changed in the first quarter of this year. The 50-day has now dropped below the 200-day, suggesting the uptrend has lost steam and could be shifting into a more cautious phase.
The recent sharp decline in price down to the $42 range marks a significant breakdown in support. That drop pulled shares to a new 12-month low before a quick bounce back in early April. This kind of move often follows unexpected news or earnings softness and can shake out weaker hands. While the recovery is a welcome sign, the stock remains below both moving averages, which adds some technical overhead resistance.
Volume and Momentum
Volume has remained fairly low and steady for much of the year, with a few spikes standing out—especially during selloffs. Notably, the biggest volume bars are tied to the sharp price drops, hinting at institutional selling or broad rebalancing. The recent uptick in volume in April could suggest early interest in a potential bottoming process, but it’s too early to call that confirmed.
The RSI (Relative Strength Index) has been hovering below 50 for several months, suggesting the stock has been stuck in a bearish or neutral zone. It only briefly touched oversold territory recently before bouncing back toward the midline. That slight rebound may signal the start of renewed buying interest, but without stronger price action, it’s more of a wait-and-see signal.
Moving Averages and Future Setup
Right now, both the 50-day and 200-day moving averages are sloping downward or flattening. This doesn’t necessarily mean the stock is in long-term trouble, but it does show that the upward momentum that carried it for much of 2023 has faded. The price needs to reclaim and hold above those moving averages for sentiment to shift meaningfully.
From a technical perspective, this setup often represents a cooling-off period after an extended rally. The drop in price to the lower $40s might also be forming a new base if support holds in that zone. For those watching longer-term patterns, a double bottom or a slow, grinding climb back above the moving averages would be a healthy signal. Until then, the chart suggests consolidation and cautious recovery.
Management Team
ABM Industries is led by Scott Salmirs, who has held the role of President and CEO since 2015. Over the years, Salmirs has overseen a strategic shift in how the company operates, focusing on improving profitability, streamlining operations, and growing through targeted acquisitions. His background, which includes leadership roles at firms like Lehman Brothers and CBRE, has helped shape a more disciplined and forward-looking ABM.
Working alongside him is Rene Jacobsen, the Executive Vice President and Chief Operating Officer. Jacobsen has been instrumental in keeping ABM’s large-scale operations aligned and efficient across its many business lines. Earl Ellis, the company’s CFO, comes with a strong track record from consumer-facing giants such as Best Buy and Kraft Foods. He’s brought a sharper focus to capital allocation, cost control, and long-term financial strategy.
Other key players include Valerie Burd, who leads the Business & Industry division, and Mark Hawkinson, in charge of Technical Solutions. Each brings hands-on leadership and industry-specific know-how, contributing to ABM’s ability to grow while managing complexity. This experienced team has been responsible for executing the company’s long-term strategy, including realigning its business around market sectors and driving digital transformation across its platforms.
Valuation and Stock Performance
ABM’s share price has moved within a fairly wide range over the past year, swinging between just under $41 to nearly $60. As of mid-April 2025, the stock is trading around $46. While that puts it below its 52-week average, it also places it at a level where many investors start looking more closely at valuation.
The company is currently trading at a price-to-earnings ratio of 36.3 on a trailing basis, though its forward P/E is a much more modest 12.2. That gap suggests analysts expect earnings to improve over the coming quarters. With a market cap of roughly $2.87 billion and a strong presence in sectors that don’t tend to disappear overnight—think cleaning, engineering, and maintenance—ABM has the feel of a slow but steady performer.
Looking at enterprise value, ABM’s EV/EBITDA ratio is just under 14, which is reasonable given its stable margins and predictable cash flows. The stock also sports a solid free cash flow yield, giving the company options when it comes to dividends, reinvestment, or even future acquisitions. While the current stock price may reflect some short-term caution, the underlying business still seems built for long-term staying power.
Risks and Considerations
Like any company with large-scale operations and a big workforce, ABM has its share of risks. Labor remains the biggest wildcard. Wages have been rising across the country, and in a service-based business like this one, those costs matter. A tight labor market also means higher turnover, more training costs, and pressure on service delivery. If not managed well, this can quickly eat into margins.
Debt is another thing to watch. ABM has about $1.66 billion in total debt and a debt-to-equity ratio approaching 93 percent. That’s not unusual for a company of its size and capital structure, but it does put a spotlight on interest rates. Any uptick in financing costs could reduce flexibility for both day-to-day operations and longer-term investments.
The company also has some exposure to cyclical industries. Its work in sectors like aviation and commercial real estate can come under pressure when the economy slows. If demand drops in those areas, it may take time to pivot resources or find replacement contracts elsewhere. That said, the diversification across several industries helps balance out the occasional softness in any single vertical.
Final Thoughts
ABM Industries continues to operate in the kind of steady, service-driven business that doesn’t rely on hype to deliver value. Its long-term growth strategy, led by a seasoned management team, focuses on operational excellence and smart expansion into growth areas like technical solutions and energy.
Even though the stock has seen a pullback, the company’s fundamentals—like cash flow, recurring revenue, and a long track record of dividend payments—keep it anchored. The balance sheet has some leverage, but it’s manageable, and the team has shown discipline in how they allocate capital.
While it’s not immune to economic cycles or labor dynamics, ABM offers the kind of durable business model and measured leadership that investors often gravitate toward when looking for consistency. As it continues to execute on its long-term plans, and if cash flow continues to support shareholder returns, ABM could remain a quiet but reliable performer in a portfolio built for the long haul.