

Updated 3/26
Synovus Financial Corp. is a regional bank that has quietly built a solid reputation. With roots going back over a century, Synovus serves customers across Georgia, Florida, Alabama, South Carolina, and Tennessee. It operates with a community-focused banking model, catering to both individuals and businesses.
Despite market swings and rising interest rates in recent years, Synovus has managed to keep its footing and deliver value—especially for investors who focus on dividends. While some banks pulled back or froze payouts during uncertainty, Synovus kept its checks coming, showing the kind of consistency income investors look for.
Recent Events
The last few quarters have brought some noticeable momentum. Synovus ended the year with earnings that more than doubled from the prior year’s quarter. That 170%+ earnings growth came alongside a 23% rise in revenue—both signals that operations are clicking.
With the stock trading just under $49, it’s down slightly from its 50-day average but remains above the 200-day, which tends to suggest the broader trend is still upward. There’s also been a noticeable uptick in trading volume, showing renewed interest. Institutional investors clearly like what they see—over 87% of the float is held by them—while insiders hold less than 1%, which is pretty typical for banks of this size.
Key Dividend Metrics
🪙 Dividend Yield: 3.23%
📈 5-Year Average Yield: 3.89%
💵 Annual Dividend: $1.56 per share
📆 Next Payout Date: April 1, 2025
🧮 Payout Ratio: 50.17%
📊 Dividend Growth Rate (5-Year): Around 7% per year
🔒 Safety Outlook: Reasonably solid based on earnings and balance sheet
Dividend Overview
For dividend-focused investors, Synovus checks several important boxes. The forward yield sits comfortably over 3%, which offers a decent cushion of income without relying on riskier sectors. It’s a level that stands out, especially in today’s market where yields have compressed in many areas.
Over the last five years, the average yield has been a touch higher—closer to 3.9%—suggesting the current price has risen somewhat compared to past valuations. That’s not a negative. It just shows the stock has gained in value while still maintaining a solid yield.
Synovus has a dependable dividend cadence, paying quarterly, and hasn’t made any missteps with the payout through recent economic cycles. This isn’t a high-yield trap—it’s a steady, mid-yield play with just enough growth behind it to keep things interesting.
Dividend Growth and Safety
A payout ratio around 50% is typically a good place to be. It means there’s room to continue growing the dividend without putting too much strain on earnings. It’s also a sign that management is keeping a balance between rewarding shareholders and reinvesting into the business.
Dividend growth has averaged about 7% annually over the last five years, which is a healthy rate for a regional bank. It reflects a deliberate approach—management isn’t just throwing out higher payouts to please investors, but rather building a sustainable path forward.
The recent earnings growth adds another layer of comfort. When a company is growing profits at this rate, the dividend doesn’t just look sustainable—it might have more room to grow if conditions stay supportive.
Chart Analysis
Current Phase in the Market Cycle
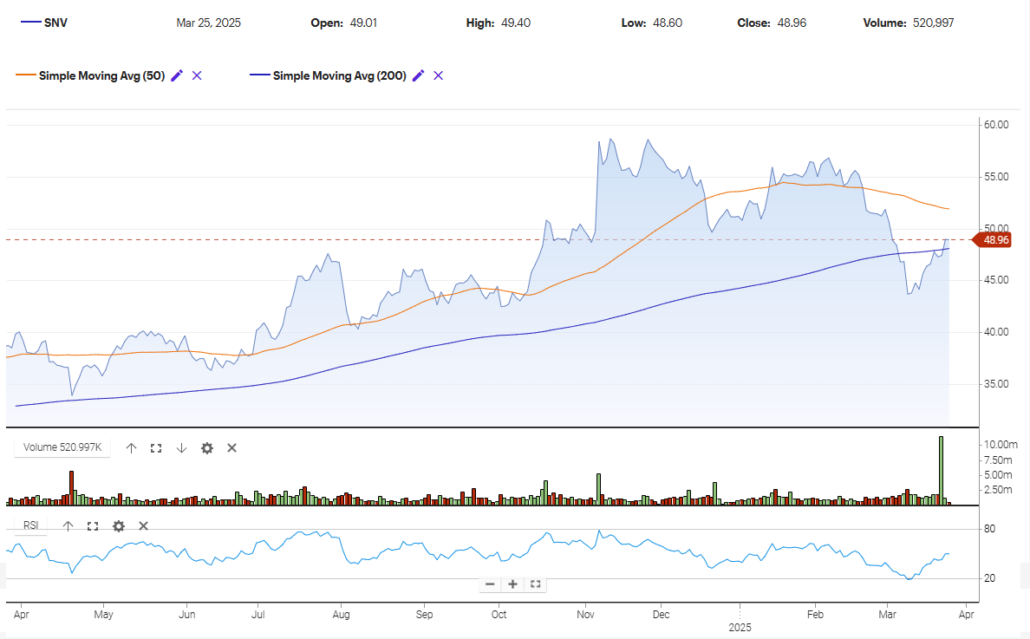
The chart for Synovus Financial (SNV) reflects a clear transition within the Wyckoff cycle framework. After a steady markup phase that stretched from early summer into late November, the stock hit a sharp peak followed by a series of lower highs, suggesting it entered the distribution phase around December. Sellers began stepping in more aggressively as the price lost momentum above the 55 level.
Since February, SNV has shifted into markdown territory, with the price declining below the 50-day moving average and eventually undercutting the 200-day moving average. That drop below both long-term supports in early March came on accelerating volume—hinting at institutional distribution. But the recent bounce back in late March shows a possible test of that markdown, where bargain hunters are stepping in.
The RSI, which dipped deep into oversold territory near 20 in mid-March, has now turned upward, aligning with the price recovery. That bounce suggests the stock may be in an automatic rally phase within the broader markdown context—potentially setting up a trading range if it can hold current levels.
Volume and Price Relationship
Volume has been especially telling here. As SNV broke below the 200-day moving average in March, the spike in volume showed strong selling pressure. But what stands out even more is the large green volume bar accompanying the most recent rebound. That’s a sign of potential short-term accumulation—where the stronger hands are scooping up shares after the markdown flushed out weaker holders.
Still, the preceding weeks showed a string of red volume days, reinforcing that selling was dominant during the markdown. It’s too early to call it a full reversal, but this behavior suggests at least a pause in the downtrend and possibly the beginning of a new range forming.
Moving Averages and Trend Indicators
The 50-day moving average has clearly rolled over and is heading lower, which often confirms short-term bearish momentum. The price currently sits just below this line, and while it’s managed to reclaim the 200-day moving average, it hasn’t yet broken above the 50-day convincingly.
The 200-day moving average is still trending upward, but its slope has begun to flatten. That typically signals a potential longer-term shift unless the price can stabilize and resume climbing soon. Traders often watch for a “death cross” where the 50-day crosses below the 200-day; SNV is inching toward that zone, but hasn’t triggered it yet.
Last Five Candles and Price Behavior
Looking at the most recent five candles, there’s a clear bullish tone developing. Each of the last five sessions has formed higher lows, and the wicks on the lower side have been longer than the upper shadows—suggesting buyers are stepping in during intraday dips. One of those candles came with a strong green body on high volume, which shows conviction.
This type of price action often marks the early signs of accumulation or a short-covering rally. While there’s still resistance around the 49.50 to 50 level—where the 50-day moving average lies—the behavior of these candles reflects reduced selling pressure and growing demand.
The stock is showing resilience just below a key resistance zone, and how it behaves here will offer more insight into whether this is a temporary bounce or the beginning of a new phase.
Analyst Ratings
📈 Recent analyst activity for Synovus Financial Corp. (SNV) reflects a range of sentiment, showing that while some remain confident in the stock’s trajectory, others are adopting a more cautious tone.
🔼 In December, one of the larger investment firms raised its price target on Synovus from $51 to $68, sticking with a buy rating. This move followed stronger-than-expected earnings and improving loan growth across core markets. The revised target suggests rising optimism about the bank’s profitability in a shifting rate environment.
🟢 Around the same time, another major bank initiated coverage with a buy rating and a $64 target. Their rationale centered on Synovus’s solid asset quality and growing fee-based income streams, particularly in wealth management and treasury services.
🔽 On the other hand, not all recent updates have been bullish. In October, a notable downgrade came through, moving the stock from overweight to equal weight and trimming the price target from $48 to $46. That firm cited slower expected loan growth and tightening net interest margins as reasons for taking a more neutral stance.
🎯 As of late March, the average consensus price target among 17 analysts stands at $63.12. The range stretches from a low of $54.00 to a high of $76.00, pointing to potential upside of roughly 11.5% from current levels.
📊 This mix of upgrades and cautious revisions underscores the balancing act analysts see: Synovus has delivered on growth and earnings but faces the same macroeconomic pressures that affect the broader regional banking space. Still, the consensus suggests a generally favorable outlook, even as short-term headwinds are acknowledged.
Earning Report Summary
Strong Finish to the Year
Synovus Financial wrapped up 2024 on a solid note, delivering numbers that show it’s staying focused and resilient even with the broader economic uncertainty. Earnings per share came in at $1.25 for the fourth quarter, which is a big jump from the $0.41 reported in the same quarter last year. That kind of improvement stands out, especially in the regional banking space where volatility has been the norm.
Steady Revenue with Support from Core Business
Revenue for the quarter landed just shy of $567 million, which lined up nicely with what most were expecting. A lot of that came from strength in net interest income, which got a boost from higher rates and disciplined loan growth. Synovus also saw some help from non-interest income, including better performance in areas like wealth management and mortgage banking—services that often fly under the radar but can really move the needle.
Managing Costs and Credit Quality
Expenses were kept in check, which helped support margins. Non-interest expenses didn’t creep up the way they have at some other banks, and that cost control helped preserve profitability. What’s also worth noting is that asset quality held steady. Non-performing loans didn’t spike, and the bank kept a healthy cushion set aside in case of future credit issues. They’re not taking anything for granted, which is smart.
Strong Capital Position
On the balance sheet side, Synovus is sitting in a good spot. The Tier 1 Capital Ratio came in at 11.96%, which is a solid number that gives the bank room to navigate any bumps in the road while still pursuing growth opportunities. It also adds to the sense of overall stability for investors who prioritize risk management as much as returns.
Looking Ahead
The overall tone of the report paints a picture of a company that’s well-run and adapting to the environment without overextending itself. With loan growth, a stable credit profile, and a good grip on expenses, Synovus is positioning itself for consistency rather than trying to swing for the fences. And in today’s banking world, that kind of discipline goes a long way.
Financial Health and Stability
Synovus has more cash on hand than it does debt, which is unusual—and impressive—for a bank of this scale. That signals strong liquidity and a balance sheet that’s well-managed. Having over $3 billion in cash compared to $2.7 billion in debt puts the company in a good position if the economic picture were to get cloudy.
Margins are solid too. Profit margin is just over 26%, and operating margins are above 46%, which is fairly strong for a regional bank. These numbers show that Synovus runs lean and knows how to manage its costs while still generating strong revenue.
Its return on equity comes in at a little over 9%, which is healthy, though not eye-popping. Return on assets is 0.8%—slightly under the 1% benchmark that many analysts like, but not alarming by any stretch. Book value is around $33 per share, and with the stock trading in the high $40s, the price-to-book ratio is about 1.45. That’s not cheap, but also not stretched, especially for a name with improving fundamentals.
Valuation and Stock Performance
Looking at valuation, Synovus seems reasonably priced. The forward price-to-earnings ratio is around 10, which is attractive for a company showing this kind of earnings and revenue growth.
The stock has climbed over 20% in the past year—well ahead of the broader market. Its 52-week range tells the story: it bounced from a low near $33 to a high near $60, so there’s been plenty of movement. At current levels, it’s closer to the middle of that range, which could represent a base-building phase.
Short interest is fairly low, and volume trends point to growing institutional engagement. For long-term investors who don’t mind a bit of price movement in exchange for a consistent dividend stream, Synovus holds up well.
Risks and Considerations
Every investment carries risk, and Synovus is no exception. Regional banks like this are still dealing with the effects of the Federal Reserve’s rate cycle. If rates come down sharply, net interest margins could get squeezed, putting pressure on earnings.
One area to keep an eye on is exposure to commercial real estate. Synovus, like many regional peers, has lending in that space. If office or retail properties start showing weakness—especially in secondary markets—it could create some headwinds.
There’s also the usual risk that comes with holding a regional bank stock: it’s more economically sensitive than some larger institutions, and the stock tends to be more volatile than the average S&P name. The beta is around 1.4, meaning this name can move faster than the market in either direction.
Still, Synovus has weathered storms before. It’s not a new name to regional banking, and that experience counts when markets get choppy.
Final Thoughts
Synovus Financial might not always make the spotlight, but for investors who care about reliable dividends and a business that knows how to manage its capital, it stands out. With a decent yield, consistent dividend growth, and a conservative payout ratio, it offers a well-balanced income profile.
The company’s financials look solid, with a rare cash-to-debt advantage and healthy profit margins. And while it isn’t immune to the usual banking risks, the fundamentals suggest it’s in a good spot right now.
For those building a dividend-focused portfolio, Synovus delivers on stability and income—two things that are always in demand, no matter where we are in the market cycle.