

Updated 3/26
Sun Communities, Inc. (SUI) is one of those companies that quietly goes about its business, building a unique real estate empire focused on manufactured housing, RV resorts, and marinas. It doesn’t chase headlines or trends—instead, it leans into stable, recurring revenue from people who choose lifestyle living over traditional homeownership.
Operating as a real estate investment trust (REIT), Sun has spent decades growing its portfolio, and today it owns more than 600 properties across the U.S., Canada, and the UK. Its model is built on affordability and leisure, two areas that may not sound flashy but tend to be quite dependable when it comes to generating income. For investors hunting for steady dividends in a sea of volatility, Sun Communities offers something worth paying attention to.
Recent Events
In the last year, Sun Communities has been adapting to a tougher macro backdrop. With interest rates climbing and inflation making headlines, many REITs have taken a hit. Sun hasn’t been immune, but it has managed to hold its ground, sticking to its playbook of slow, steady growth.
Revenue rose 2.8% year-over-year in the latest quarter. That’s not the kind of number that will turn heads, but it speaks to consistency. The company has eased off the gas when it comes to acquisitions, choosing instead to focus on cash flow and digest past deals. That includes its foray into the UK market with Park Holidays—a strategic move that brought international exposure, along with some added complexity.
The stock itself has been moving sideways. Over the past 52 weeks, it’s hovered between $111 and $148, never quite breaking out but also never collapsing. This kind of range-bound trading might seem boring, but for income investors, it often provides a healthy environment to collect dividends without big price swings.
Key Dividend Metrics
📅 Dividend Yield: 2.89%
📈 5-Year Dividend CAGR: Around 5.2%
💵 Annual Dividend Rate: $3.76 per share
📆 Ex-Dividend Date: March 31, 2025
📊 Payout Ratio: 529.58% (on EPS, not indicative of cash-based FFO)
📌 Next Dividend Payable: April 15, 2025
🧾 Historical Payout Range (AFFO-based): 60–75%
Dividend Overview
The dividend yield currently sits at 2.89%, just a notch above its five-year average. That’s a subtle but meaningful sign the stock is trading at a slightly more attractive level for income-seekers. The payout of $3.76 per year hasn’t skipped a beat, even as economic conditions have shifted. Stability has become one of Sun’s most appealing features.
If you’re just looking at the headline payout ratio, you might raise an eyebrow at the 529% figure. But that number is based on GAAP earnings, which aren’t the best lens for evaluating REITs. Real estate trusts like SUI rely on cash metrics like Funds from Operations (FFO), which strip out non-cash items like depreciation. On that basis, the dividend is well-covered and aligns with what you’d expect from a mature, income-focused REIT.
Dividend Growth and Safety
There’s something to be said for quiet reliability. Sun has been raising its dividend at a steady clip, with an average annual growth rate just over 5% for the past five years. It hasn’t made any drastic increases, but it hasn’t paused or cut either—a strong signal that management prioritizes the payout.
What makes that even more impressive is how diversified their cash flow is. Manufactured housing communities offer the kind of tenant stability that’s hard to match—residents tend to stay for years, not months. Meanwhile, the RV and marina segments bring in seasonal income and attract a different type of customer, helping smooth things out across the year.
From a safety perspective, the dividend looks solid. The company is not overextending itself. In fact, in response to the rising rate environment, Sun has slowed its pace of growth and focused more on maintaining a strong financial position. That’s exactly the kind of behavior income investors want to see.
Chart Analysis
Wyckoff Cycle Positioning
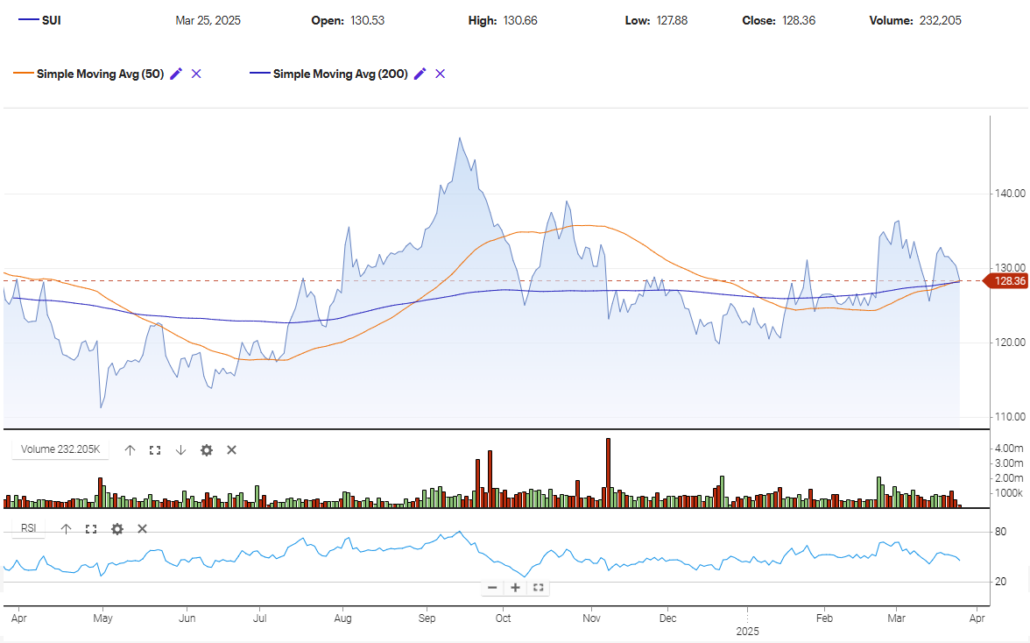
The chart of Sun Communities (SUI) over the past year shows clear structure aligning with stages of the Wyckoff market cycle. Looking at the full timeframe, the cycle appears to have gone through a classic markup followed by distribution and is now sitting in the early-to-mid stages of a new accumulation phase.
The strong move higher from June through September reflects a classic markup phase. Volume picked up and price surged above both the 50-day and 200-day moving averages. By late September into October, the stock topped out, with choppy action and declining RSI indicating loss of upward momentum. That’s where distribution set in.
After that peak, the stock sold off and consolidated in a wide range, drifting between $110 and $130. That stretch—particularly from November to late January—shows characteristics of accumulation. Volume began rising on up-days, and price stopped making lower lows, suggesting the absorption of supply.
More recently, the stock has broken above the 200-day moving average, a subtle but important sign. That crossover from below signals the possible beginning of a new markup, although follow-through is still tentative.
Volume Behavior
Volume tells an interesting story here. There’s a distinct pickup in volume on red days in October, which aligns with distribution. But that flips as we enter 2025—green-volume bars begin outnumbering red ones. It’s not aggressive buying yet, but it’s controlled accumulation. Notably, volume spikes in March were accompanied by upward price movement, confirming demand is returning.
That said, the last few trading days have shown lighter volume, suggesting the recent dip is less about panic selling and more about a pause or pullback.
Moving Averages
The 50-day moving average has now crossed above the 200-day moving average—what’s often referred to as a golden cross. That’s usually a bullish sign, especially when supported by price trading above both lines. Still, the current price action shows a battle around the $128–$130 range. Bulls haven’t seized full control yet, but the moving average crossover supports the idea that the longer-term trend is starting to shift positive again.
Back in late 2023, the 50-day was firmly below the 200-day, which added to bearish pressure. Now, both lines are curling up slightly, suggesting momentum is gradually tilting upward.
RSI Behavior
The relative strength index (RSI) has been moving in a relatively neutral band between 40 and 60 for much of the past several months. It did dip below 30 briefly in October—classic oversold territory—before bouncing hard during the late-year rally.
Since then, RSI has stayed mostly mid-range, indicating there’s still room for a directional push. The recent slide in RSI from near 70 down toward 50 aligns with the current price pullback. Nothing extreme, but it’s a signal that buyers are pausing.
Latest Five Candles
Looking closely at the latest five trading sessions, the candlesticks show hesitation. There’s a mix of small-bodied candles with upper wicks—signs of intraday selling pressure. Price action is hovering just below the recent highs around $131, and the presence of those wicks suggests sellers are defending that level.
One of the candles shows a longer lower wick, which tells us buyers are still present, stepping in on dips. But the overall tone of these recent candles leans neutral to slightly bearish in the short term, indicating a possible need for consolidation before the next move higher.
Analyst Ratings
📈 Sun Communities, Inc. (SUI) recently received an upgrade from Truist Securities, shifting their stance from “Hold” to “Buy.” Alongside the rating change, the firm bumped the price target from $131 to $136. This move was driven by improved expectations for the company’s operating performance, particularly in its manufactured housing and RV resort segments. Analysts noted steady occupancy trends and resilience in rental income, which they believe could lead to better-than-expected cash flows as 2025 progresses.
📉 On the flip side, UBS downgraded SUI a few months earlier, moving it from “Buy” to “Neutral” in late 2024. The revised price target came down from $155 to $134. Their reasoning leaned more cautious, citing tightening conditions in real estate financing and macroeconomic uncertainty. They pointed out that while Sun Communities has strong fundamentals, higher interest costs could put pressure on earnings growth in the near term.
🎯 As of late March 2025, the overall analyst consensus remains a “Hold.” The average price target from analysts currently sits around $136.60, suggesting moderate upside from recent levels. Targets vary widely, ranging from a more conservative $114 to a bullish $155, reflecting a divided view on how quickly Sun can resume stronger growth amid evolving market conditions.
💬 The mix of upgrades and downgrades highlights how Sun Communities sits at a crossroads—valued for its stability, but still needing a few stronger quarters to win back full confidence from the broader analyst community.
Earning Report Summary
Steady Results with a Few Twists
Sun Communities closed out 2024 with a mixed but overall steady set of numbers. Net income for the year came in at $89 million, or about 71 cents per share. That’s a noticeable drop from the $2.01 they posted last year, but most of that dip comes from one-time items and the impact of property sales rather than anything fundamentally broken.
The more telling number for a REIT like Sun is Core Funds from Operations—or Core FFO—and here, they ended the year at $6.81 per share. That shows their core operations are still on solid footing.
Fourth Quarter Showed Some Spark
The fourth quarter had some nice momentum. Core FFO came in at $1.41 per share, which is about 5% better than the same time last year. Same Property Net Operating Income (NOI) in North America rose 5.7% in the quarter, with a 4.1% bump for the full year. On the other side of the Atlantic, their U.K. operations also chipped in with a 12.9% jump in NOI for the quarter. So, both domestic and international segments did their part.
A Big Strategic Move
One of the bigger stories from the year was the sale of their Safe Harbor Marinas business for a hefty $5.65 billion. That deal, which they said valued the business at 21 times annual FFO, gave them a big boost in terms of streamlining operations and freeing up cash. They also sold off about $570 million in other assets that didn’t quite fit the long-term strategy.
Housing Still Strong, RVs Lagging a Bit
On the operations side, the manufactured housing business did well, with a 7.1% gain in Same Property NOI for Q4. Rents were up, and occupancy stayed solid at around 97.6%. The RV segment didn’t have quite the same story—it was up, but just barely, posting a 0.4% NOI increase for the quarter.
Cleaning Up the Balance Sheet
Sun also made headway on the debt front. By the end of the year, their net debt-to-EBITDA ratio had improved to 6x, which is a sign they’re tightening things up financially. They also rolled out a restructuring plan that cut down on overhead costs, saving about $11 million in general expenses, plus another $4 million in operational savings during Q4.
Looking Into 2025
They’re guiding for 2025 Same Property NOI growth in the range of 4.3% to 5.6%. Not flashy, but consistent. The focus seems to be on leaning into their core strengths in manufactured housing and staying selective with growth while keeping an eye on costs.
Financial Health and Stability
Sun Communities carries a fair amount of debt—about $7.9 billion—but that’s par for the course in real estate. The important thing is that its cash flow can comfortably service that debt. The company generated $861 million in operating cash flow over the last year and had nearly as much in free cash flow after debt service.
Cash on the balance sheet stands at just under $54 million, which isn’t huge, but liquidity doesn’t appear to be a concern. The current ratio sits at 1.3, indicating they can meet short-term obligations without scrambling.
Leverage is something to keep an eye on, especially if interest rates remain elevated. But SUI’s approach has been cautious, not aggressive. They’ve held back on big acquisitions recently, focusing instead on making their existing portfolio more efficient. It’s a conservative play that could pay off in the long run.
Valuation and Stock Performance
At its current price near $130, Sun Communities is trading close to its 200-day moving average—a sign the market hasn’t made up its mind yet on where it should go next. Price-to-book comes in around 2.34x, and EV/EBITDA sits just north of 21x. These aren’t bargain-bin valuations, but they’re not extreme either, especially for a REIT with SUI’s track record.
P/E ratios are distorted by accounting quirks in real estate, so it’s better to lean on cash flow metrics. On that front, valuation looks reasonable. The market seems to be in a holding pattern, waiting to see where rates land before re-rating the stock one way or the other.
Over the past year, SUI has eked out a gain of just over 1%, while the broader market moved higher. It’s a reminder that this isn’t a high-flyer—it’s a steady, income-first vehicle designed more for capital preservation than explosive growth.
Risks and Considerations
Interest rates are probably the biggest near-term headwind. Like most REITs, Sun depends on borrowed capital to grow, and higher rates can squeeze margins. If the rate environment stays sticky, it could limit how quickly they can expand.
The RV and marina businesses, while great for diversification, are a bit more sensitive to the economy. During downturns, discretionary spending tends to shrink, which can impact occupancy or pricing in those segments.
There’s also international exposure to consider. The acquisition of Park Holidays brought in a new layer of geographic risk. Currency swings and foreign regulations could impact earnings more than they have in the past.
Lastly, rent control legislation is something to keep an eye on. While manufactured housing is generally seen as affordable and less controversial, regulatory pressures can always crop up, especially in tight housing markets.
Final Thoughts
Sun Communities may not be the most exciting name in the market, but there’s a lot to appreciate here if you value consistency. The dividend is steady, the growth has been measured, and the balance sheet is holding up well despite rising costs.
For income investors looking for something durable in uncertain times, SUI checks many of the right boxes. It won’t light up your portfolio with triple-digit returns, but it can quietly build wealth through a reliable stream of dividends and a well-managed real estate portfolio.
In a market where the only constant seems to be volatility, companies like Sun that simply do what they say, quarter after quarter, are worth holding onto—or at the very least, watching closely.