Updated 3/26
Stepan Company, since its founding back in 1932, Stepan has stayed the course—quietly supplying chemicals that go into everything from shampoo and cleaning products to building insulation and construction materials. While it might seem like a behind-the-scenes player, Stepan plays an important role in industries that touch everyday life.
Over the years, it’s earned a solid reputation for dependability, especially among long-term investors who value dividends and financial discipline. Despite some recent challenges on the earnings front, the company continues to reward shareholders and maintain its impressive dividend track record.
Recent Events
This past year has been rough for the stock. Shares have dropped more than 36% from their 52-week high, currently trading just above $57. The pressure has come largely from weaker demand across its surfactant and polymer businesses, along with a broader slowdown in industrial activity.
Revenue has pulled back slightly, down 1.2% year over year, and profits have followed suit. Margins have narrowed considerably, with net income hovering just above $50 million. Return on equity is now sitting at 4.22%, which is quite a bit lower than what investors have come to expect from Stepan in the past.
Still, despite the dip in performance, the company held steady on its dividend. In fact, it managed to push through another modest increase in 2024, keeping its long-standing streak alive.
Key Dividend Metrics
💰 Forward Dividend Yield: 2.68%
📈 5-Year Average Yield: 1.39%
📅 Consecutive Years of Dividend Increases: 56
📊 Payout Ratio: 68.64%
💵 Forward Annual Dividend: $1.54
🔁 Dividend Growth (5-Year Avg): ~9%
📉 Share Price 52-Week Change: -36.28%
📊 Beta: 0.82
Dividend Overview
Stepan’s dividend story is one of quiet consistency. The current forward yield of 2.68% is higher than it’s been in quite a while, mainly due to the steep drop in share price. But this isn’t just a case of yield rising because the stock fell. Management has continued to grow the payout, even in the face of softer earnings.
The dividend now sits at $1.54 annually, supported by a payout ratio just under 69%. That’s higher than where the company typically operates, but not alarmingly so. For investors focused on income, it’s encouraging to see the dividend fully funded by cash flows, not debt or asset sales.
Dividend Growth and Safety
This is where Stepan really shines. The company has increased its dividend every single year for 56 straight years. That puts it in rare company as a Dividend King, a group of firms that have raised payouts for more than half a century.
Over the past five years, dividend growth has averaged around 9% annually—fairly generous for a company in the chemicals sector. Even with tighter margins, the board continued to approve modest hikes, signaling a strong desire to maintain the streak.
Is the dividend perfectly safe? As with any company facing margin pressure, there’s always a little risk. But with $162 million in operating cash flow over the last twelve months and only moderate capital spending, Stepan has the financial room to keep the checks coming.
Chart Analysis

Market Cycle Context
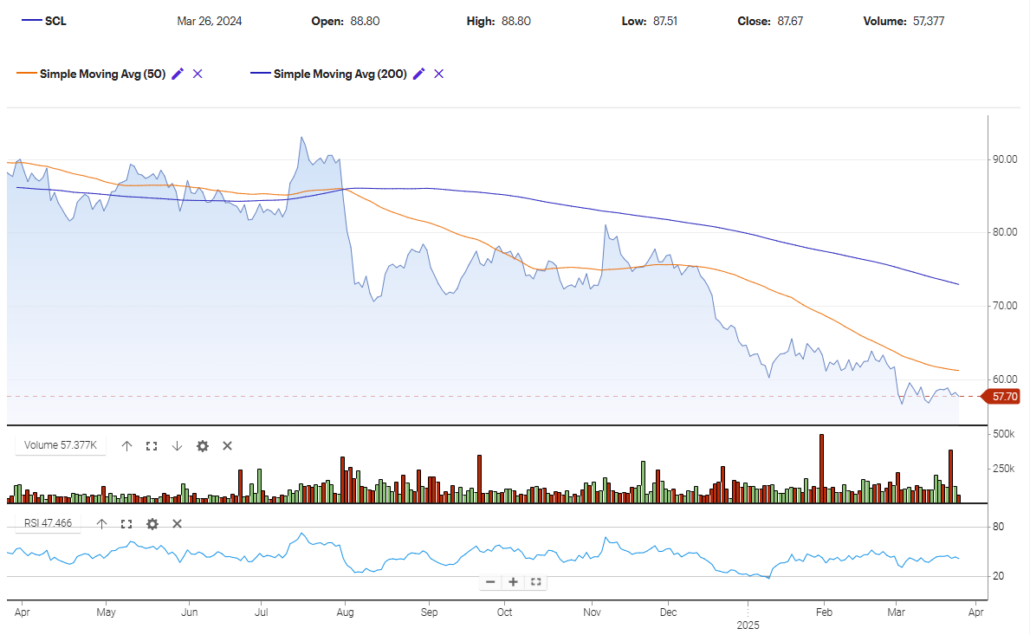
Stepan Company’s chart over the past year clearly shows a transition from distribution into markdown. The long, rounded top seen through the late spring and summer months of 2024 suggests smart money began exiting positions gradually. What followed was a steep decline starting in August, breaking below both the 50-day and 200-day moving averages with conviction. This marks the beginning of the markdown phase, where supply clearly overtakes demand.
The volume profile during the initial decline confirms this – heavy red volume spikes appear consistently from late August through December, a classic sign of distribution unwinding into panic selling.
Moving Averages and Trend Structure
Both the 50-day (orange) and 200-day (blue) moving averages are sloping down steadily, with the 50-day staying well below the 200-day. This wide gap between the two confirms the dominance of the downtrend. There’s no sign yet of a reversal attempt or even a credible test of resistance.
In fact, every rally attempt since the breakdown has failed below a falling 50-day average, which continues to act as dynamic resistance. This tells us sellers are still in control and buyers are either absent or not yet committed.
Volume Behavior
Volume has been telling its own story. Through the decline, spikes in red volume bars are more pronounced than green, showing distribution pressure outweighs accumulation. Notably, some of the highest volume days have coincided with sharp down moves, especially in late 2024 and February 2025.
However, toward the far right of the chart, we can observe a subtle shift – volume has started to decline even though the price is still low. That’s often the first sign of selling exhaustion, a necessary condition before accumulation can begin. It doesn’t confirm anything yet, but it sets the stage for potential base building.
RSI and Momentum
The RSI line, sitting just under 48, is neutral but coming off a long stretch below 40. This recent uptick from oversold territory hints at early attempts to stabilize. Still, RSI hasn’t convincingly broken above 50, and that’s usually needed to signal real momentum returning.
The indicator dipped into oversold zones multiple times between December and February, confirming sustained bearish pressure. Each bounce in price was short-lived, and the RSI never followed through strongly. Momentum remains weak, but not extreme.
Price Action and Candle Behavior
Looking at the most recent five candles, we see a mix of small-bodied candles with wicks on both ends. This often reflects indecision—neither bulls nor bears are committing strongly. Most of these candles are stuck in a tight range between 56.50 and 59. That’s typical of early-stage base building but can also precede another leg lower if support fails.
Notably, the most recent candle has a small body and a slight lower wick, meaning buyers showed up modestly by the close, though volume wasn’t impressive. There’s no aggressive buying here yet, just a potential pause after extended selling.
This sideways grind is worth watching. If volume continues to dry up and price holds above recent lows, it may mark the beginning of a longer accumulation phase. But for now, markdown conditions still dominate.
Analyst Ratings
🔼 In October 2023, Stepan Company received an upgrade from “Hold” to “Strong Buy” by one analyst. The price target was lifted to $89. This more optimistic stance came on the back of expectations for improved earnings visibility and a potential rebound in demand across Stepan’s surfactants segment. The analyst noted signs of stabilization in raw material costs and highlighted the company’s historically conservative balance sheet as a positive in a tightening economic environment.
🔽 However, in January 2024, another analyst issued a downgrade, moving Stepan from “Strong Buy” to “Hold.” The reasoning here focused on continued margin pressure and sluggish volume trends, especially in its polymer business. With customers still working through high inventory levels, the outlook for top-line growth remained muted. There were also concerns about pricing power in certain product lines, which had begun to show signs of erosion.
🎯 As of now, the consensus price target among covering analysts sits at $90, implying a potential upside from current levels. This target reflects a cautious optimism, as analysts are balancing short-term headwinds with the company’s long-term track record of operational consistency and its disciplined approach to capital allocation.
Earning Report Summary
Mixed Quarter with a Few Bright Spots
Stepan’s most recent quarter came in with a bit of a mixed bag. The company posted net income of $3.4 million, which is a nice turnaround from the $1.2 million loss they recorded during the same time last year. That’s always good to see, but when you strip out some of the one-time items, adjusted net income was $2.8 million—still positive, though down 63% from a year ago. A lot of that drop had to do with increased expenses tied to their new alkoxylation plant in Texas, plus a tax reserve set aside for an issue in Latin America.
EBITDA, which is a way of looking at earnings before all the financial noise, landed at $35.8 million, up 39% year-over-year. Adjusted EBITDA, which filters out a few items, was slightly lower at $35 million, down 7%. Global volume dipped just 1%, so it wasn’t a dramatic slowdown. Surfactants held up well, but polymer sales were weaker and dragged the numbers down.
Surfactants Holding Up
Sales in the surfactants segment came in at $378.8 million, which was up 3% from last year. That bump was thanks to a modest increase in volume and slightly higher pricing. The North American agriculture and oilfield markets really helped, posting 14% growth in volume, and Latin America’s consumer market also added to the momentum with a 9% lift.
Operating income for surfactants improved too, reaching $24.6 million, a 9% gain over the prior year. It’s one of the areas that’s still holding its ground despite broader industry headwinds.
Pressure on Polymers
The polymers business didn’t fare as well. Sales dropped 12% to $129.8 million, and operating income took a sharp hit, falling 73% to just $3.4 million. Lower volumes and pricing, largely from raw material pass-throughs and competitive pricing pressure, were the culprits here. It’s been a tough environment for that segment, and the numbers reflect it.
Cash Flow and Cost Savings
On the cash front, things looked solid. Operating cash flow came in at $68.3 million for the quarter, and free cash flow totaled $32.1 million. The company also delivered $13 million in cost savings just in the fourth quarter, which helped offset some unexpected expenses from earlier in the year, including flooding damage at their Millsdale site and fraud-related costs at a subsidiary in Asia.
Looking ahead, the big milestone is the start-up of the new Pasadena facility, expected to go live in the first quarter of 2025. Management believes this will help lift earnings and margins across all segments, with a focus on better product mix and continued cost discipline.
Financial Health and Stability
While profitability has taken a hit, the overall financial position remains solid. Return on assets has dipped to 1.9%, and operating margin is just above 1%. These are not strong numbers by any stretch, but they appear to reflect short-term headwinds more than any long-term structural issue.
Stepan has nearly $100 million in cash on hand and a total debt load of $698 million, giving it a debt-to-equity ratio under 60%. That’s manageable and in line with similar firms. The company’s current ratio of 1.21 also shows it has enough liquidity to cover near-term liabilities.
Book value per share stands at $52, which means the stock is currently trading very close to its tangible value. That’s fairly rare in the specialty chemical space and may interest those looking for deep value with a yield kicker.
Valuation and Stock Performance
The numbers here paint a mixed picture. Trailing P/E is over 26, but that’s inflated due to recent earnings softness. The more reasonable forward P/E sits around 17.5, hinting that the market expects some recovery in 2025.
Enterprise value to EBITDA is under 10, suggesting that despite the profit slump, the business still has a solid cash flow foundation. Price-to-book is now just above 1.1—again, indicating the market is taking a cautious stance.
The stock has clearly been re-rated lower over the past year. While that’s painful in the short run, it may be setting the stage for more attractive entry points for those with a long-term view and an appetite for steady dividends.
Risks and Considerations
There are definitely risks here, and they aren’t just macro-related.
First, margin compression. With input costs still elevated and end-user demand soft, profitability could remain under pressure longer than expected. If that persists, dividend growth may stall or slow even further.
Second, Stepan’s customers are still working through excess inventory. Until that clears, volumes may remain muted. Third, the competitive landscape isn’t getting easier. The company faces pricing pressure in both surfactants and polymers.
Also worth noting is the rising payout ratio. While not alarmingly high yet, it’s creeping up, leaving less buffer if cash flows tighten further.
And lastly, while Stepan isn’t a highly cyclical business, it’s not completely insulated from economic trends either. A prolonged slowdown in construction, personal care, or industrial cleaning could weigh on revenue.
Final Thoughts
Stepan isn’t going to dazzle you with big headlines or explosive earnings growth. That’s not its style. What it does offer is a steady hand, a serious commitment to dividends, and a long history of putting shareholders first.
For investors who prioritize consistent income, conservative management, and resilience through economic cycles, Stepan still holds appeal. The recent pullback has made the stock cheaper and lifted the yield above historical norms.
It may not be the most exciting name on the board, but for those focused on dividend longevity and financial strength, it’s a name worth remembering.

