

Updated 3/26
Steel Dynamics has carved out a solid spot for itself in the American steel landscape. Based in Fort Wayne, Indiana, the company has grown into one of the country’s leading steel producers and metal recyclers. Its operations are broad, spanning steelmaking, fabrication, and recycling — a vertically integrated approach that helps it control costs and weather economic swings.
For those investing with an eye on dividends, STLD offers more than just cyclical exposure. The company’s financial discipline and consistent capital returns give it a certain appeal in the income investing world, especially when compared to other names in heavy industry.
Recent Events
It’s been a bit of a bumpy road lately for Steel Dynamics. Steel prices have cooled off after surging in recent years, and that’s put pressure on the company’s revenue and profit margins. For the full year, revenue dropped by 8.5% compared to the previous year, and earnings saw an even steeper decline of over 50%. That’s not surprising in an industry that’s always been tied closely to economic cycles.
But here’s where STLD stands out: instead of pulling back, the company stayed the course with its dividend. Management announced its next payout for April 11, 2025, sticking to their pattern of rewarding shareholders even during slower periods. That’s a sign of confidence — not just in their balance sheet, but in their long-term outlook as well.
Key Dividend Metrics 🧮💰📈📊
- 💸 Forward Annual Dividend: $2.00
- 📈 Forward Yield: 1.56%
- 📉 Trailing Yield: 1.44%
- 🔄 Five-Year Average Yield: 1.84%
- 💼 Payout Ratio: 18.7%
- 📆 Next Dividend Date: April 11, 2025
- 🚫 Dividend Cuts: None in recent history
Dividend Overview
Steel Dynamics doesn’t lead with yield — and that’s okay. At around 1.56%, the payout won’t jump off the page for traditional income seekers. But what it lacks in yield, it makes up for in consistency and long-term growth.
The payout is backed by a solid earnings base. With nearly $10 in earnings per share over the trailing twelve months, and only $2 per share going out in dividends, there’s a lot of room to breathe. Even in tougher years, this kind of cushion lets the company keep paying — and growing — the dividend.
Dividend Growth and Safety
STLD’s dividend track record is refreshingly steady. The company has increased its dividend year after year for over a decade, including during rocky stretches for the steel industry. The raises aren’t just symbolic either — they’re meaningful enough to catch the attention of dividend-focused investors looking for both income and growth.
As for safety, this one checks all the boxes. With a payout ratio under 20%, there’s no sense of strain. Cash flow remains strong, and the company doesn’t rely on debt to fund distributions. Even if earnings dip again, there’s enough room for STLD to continue honoring and increasing its dividend.
Chart Analysis
Price Action and Market Structure
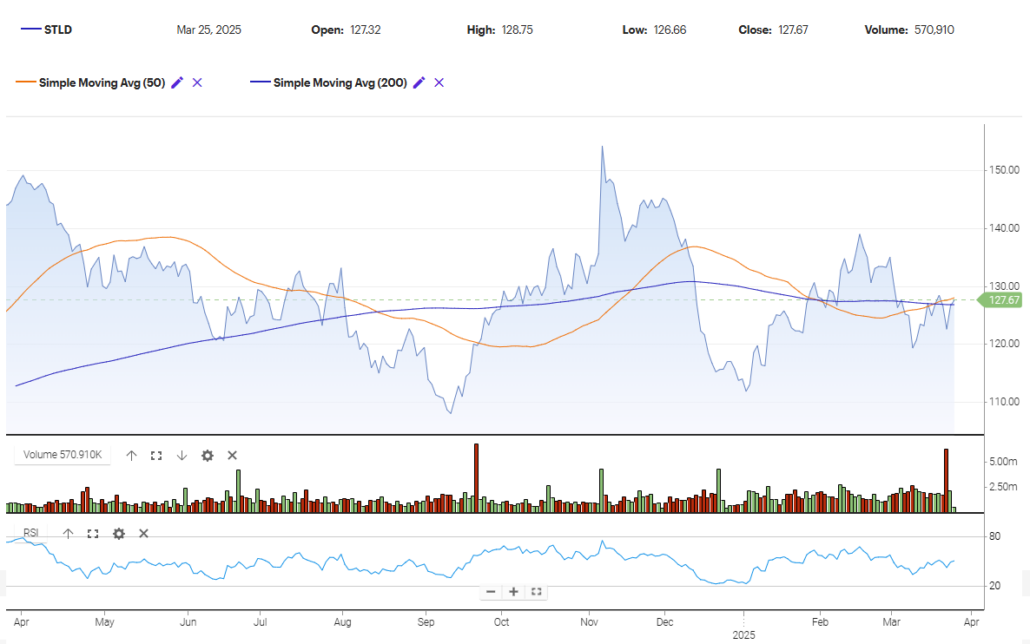
Looking at the price action for Steel Dynamics (STLD), the stock has spent the past year oscillating within a broad range, marked by a high near 155 and a low around 105. After reaching a peak in December, price pulled back sharply through January and early February. That correction reset some of the overbought conditions and brought the stock down toward the lower end of the 120s.
The recent few weeks show some signs of stability, with the price hovering just below and now slightly above the 50-day moving average. On March 25, the stock closed at 127.67, just above the 50-day line, and right around the 200-day moving average. This type of convergence between the two moving averages often acts as a battleground zone — a place where short-term traders and long-term investors assess momentum direction.
The structure appears to be transitioning. After the steep pullback and some consolidation in February, we’re now seeing what could be the early stages of a base being built — the type of slow recovery that can lead to accumulation phases if supported by volume.
Moving Averages
The 50-day moving average has been trending downward since early January, a reflection of the weaker short-term momentum that followed the post-October surge. However, over the last several sessions, price has started to climb back toward this moving average and is now attempting to hold above it. The 200-day moving average is relatively flat, suggesting longer-term trend indecision, but the recent crossover attempt could be an early sign of strength if it holds.
The last meaningful move above both moving averages was followed by a rally into late December. Since then, this zone has been resistance. A sustained hold above the 200-day would shift the tone more bullish from a trend perspective.
Volume Behavior
Volume over the past few sessions has shown some spikes, especially with the most recent bar on the chart revealing a noticeable surge. This jump in volume came alongside a price that closed near the highs of the day, suggesting buyers were active into the close. That’s worth watching — heavier volume on green days points to accumulation rather than distribution.
Zooming out, the heaviest volume in the past year occurred in early October. That spike aligned with a strong price reversal from the lows, which kicked off a sharp rally through November and into the year-end. While current volume isn’t near those levels, the recent increase does stand out after several quiet weeks.
RSI and Momentum
The Relative Strength Index (RSI) spent much of January and February sitting below the midpoint, showing a lack of momentum and confirming the corrective phase. But since early March, the RSI has been creeping higher and is now closing in on the neutral 50 level. This is a subtle shift, but it reflects a transition from bearish to more neutral momentum.
We’re not yet in overbought territory — not even close — so there’s still plenty of room for further upside before any technical resistance from momentum indicators comes into play.
Latest 5 Candles and Wick Behavior
Looking at the most recent five candles, there’s a clear tug-of-war between buyers and sellers:
- The first few show long lower wicks, hinting at buying pressure stepping in intraday. These are the kinds of candles that often show support forming.
- The March 25 candle closed near its high with only a minor upper wick, which leans bullish. Buyers held control from open to close.
- Volatility has narrowed a bit, and bodies are getting tighter. That’s usually a sign of consolidation, potentially setting up for a move.
So far, the presence of demand at the lower end of the recent range — paired with rising volume and improving momentum — paints a picture of a stock that may be moving out of a short-term corrective phase and into early-stage recovery. Still, it sits at a crossroads, with moving averages and historical resistance levels just above.
Analyst Ratings
📈 In recent weeks, Steel Dynamics (STLD) has seen notable shifts in analyst sentiment. On March 24, 2025, UBS upgraded the stock from “Neutral” to “Buy,” maintaining a price target of $149. This move reflects optimism around the company’s near-term prospects, especially following the reintroduction of 25% tariffs on steel and aluminum imports. Analysts expect these tariffs to give domestic producers like STLD a stronger pricing environment, even as new production capacity enters the market.
📊 Earlier this month, Morgan Stanley also revised its stance on STLD, raising its rating from “Hold” to “Buy” and boosting the price target from $145 to $158. The firm cited confidence in Steel Dynamics’ ability to maintain healthy margins and capture market share, particularly if steel prices remain elevated longer than expected.
💬 As of March 26, 2025, the analyst consensus for Steel Dynamics stands at “Moderate Buy” based on input from 11 analysts. The average price target is $148.56, implying a potential upside of about 15.75% from the current price near $128.34. The price targets range from a low of $135 to a high of $158, showing a positive but cautious range of expectations depending on how market conditions evolve.
📌 Overall, these updates highlight a trend of increasing bullishness among analysts. The common thread across the upgrades is a more constructive view of the steel market’s supply-demand balance and the belief that STLD is well-positioned to benefit from it, thanks to its efficient operations and strategic market exposure.
Earning Report Summary
Slower Quarter, But Still Holding Ground
Steel Dynamics wrapped up the fourth quarter of 2024 with $3.9 billion in revenue and $207 million in net income. That came out to $1.36 per diluted share, which was a step down from both the previous quarter and the same time last year. It’s not unexpected, given the broader slowdown in steel demand and some seasonal headwinds that usually hit this time of year.
On the full-year front, revenue came in at $17.5 billion with net income totaling $1.5 billion, or $9.84 per share. EBITDA for the year was just shy of $2.5 billion. Cash flow from operations stayed healthy at $1.8 billion, and the company ended the year with $2.2 billion in liquidity. They also returned a good chunk of capital to shareholders, buying back around $1.2 billion of their own shares—roughly 6% of the float.
Steel Operations Took a Hit
One of the weaker spots was in core steel operations, where operating income for the quarter was $165 million—a 46% drop from Q3. A few factors played into that. For one, there was an unplanned outage at the Butler Flat Roll Division, which cut into production by about 50,000 tons. On top of that, average selling prices slipped by $48 per ton, while scrap input costs nudged higher to $370 per ton.
The Sinton, Texas facility showed improvement and ran at over 80% capacity late in the quarter. Even so, it ended up with a loss of $58 million for the quarter. Management expects Sinton to turn profitable in the first half of 2025 as efficiencies continue to improve.
Recycling and Fabrication Provided Support
On the brighter side, the metals recycling segment turned in a better quarter. Operating income rose to $23 million, thanks to wider metal spreads and cost controls. Shipments were down, which is typical for Q4, but improved margins helped offset that.
Steel fabrication also held up reasonably well, with $142 million in operating income. That was a bit below the previous quarter, mainly due to softer shipments and some mild compression in spreads. Still, the backlog going into 2025 is strong, and demand looks solid thanks to infrastructure activity and manufacturing trends pushing more business back to the U.S.
A Year of Adjustment
Compared to 2023, this past year was clearly a reset. Full-year net income fell from $2.5 billion to $1.5 billion. Revenue was down 7%, and operating income dropped 38%. Those declines were mostly tied to softer pricing and compressed metal spreads across both steel and fabrication segments.
Even with those headwinds, Steel Dynamics stayed profitable, generated strong cash flow, and continued investing in its business and shareholders. That kind of balance is what tends to stand out in cyclical industries like this one.
Financial Health and Stability
Looking under the hood, Steel Dynamics keeps its balance sheet in very good shape. Debt levels are reasonable, with a total debt-to-equity ratio of just 37.4%. They’ve got a current ratio of 2.53, which shows they can handle short-term obligations comfortably.
The company has about $737 million in cash, and its operations are still generating solid cash flow — around $1.84 billion over the last year. While their levered free cash flow turned negative recently, that’s tied more to reinvestment in growth projects than any kind of distress. These are long-term bets, not red flags.
With a return on equity above 17% and returns on assets just over 8%, Steel Dynamics continues to deploy capital effectively. Margins have taken a hit due to pricing pressure, but even so, the company remains profitable — not something every cyclical player can say in a downturn.
Valuation and Stock Performance
Right now, STLD trades at a forward P/E just under 13, which is fair for a company of this quality. The EV/EBITDA multiple is hovering near 8.6, still within reason, especially if margins begin to firm up.
Its price-to-book sits at 2.15, while price-to-sales is 1.14 — again, not deep value, but reflective of a company that’s maintained strong returns on capital.
The stock is down about 13% over the past year, which contrasts sharply with broader market gains. It’s currently sitting near both its 50- and 200-day moving averages, around $128, suggesting that it’s found some technical footing in recent weeks.
Risks and Considerations
Of course, no discussion of a steel stock would be complete without talking about cyclicality. Steel Dynamics is highly exposed to swings in construction, manufacturing, and broader economic growth. If those sectors stay soft, the pressure on earnings could persist.
Another point to watch is their capital spending. The recent dip into negative free cash flow isn’t cause for panic, but it does mean they’re investing heavily. Those projects need to produce results in the coming years to keep the financial engine humming.
And while the business fundamentals are solid, the stock can still move sharply with market sentiment. With a beta of 1.35, it tends to swing more than the average stock — something income investors need to consider if they’re planning to hold through the full cycle.
Final Thoughts
Steel Dynamics might not be offering the flashiest dividend out there, but what it does bring to the table is discipline. The company has been through this rodeo before. It knows when to lean in, when to pull back, and how to keep returning cash to shareholders even in leaner times.
For dividend investors looking for a steady name in a sometimes-unstable sector, STLD delivers consistency and strong financial stewardship. The dividend is modest but well-supported, the payout ratio is conservative, and the balance sheet is built to weather volatility.
It’s a stock that may not always be in the spotlight, but for long-term investors who value stable income and thoughtful capital allocation, Steel Dynamics offers a lot to appreciate.