

Updated 2/23/26
OpenText Corporation (NASDAQ: OTEX, TSX: OTEX) is a major player in enterprise information management, helping businesses store, analyze, and secure their data. While it may not be the first name that comes to mind for dividend investors, the company has quietly built a reputation for steady payouts.
OpenText’s business revolves around cloud-based solutions that improve workflow automation, cybersecurity, and digital transformation. With a strong track record of acquiring companies to expand its capabilities, OpenText has grown into a software powerhouse. The big question for dividend investors: Is this stock a reliable income source for the long term?
📊 Key Dividend Metrics
💰 Dividend Yield: 4.34% (Well above historical average)
📈 Dividend Growth: Moderate with incremental increases maintained
🛡️ Payout Ratio: 62.87% (Manageable but higher than prior periods)
📅 Last Dividend Payment: $0.275 per share (December 5, 2025)
📆 Most Recent Ex-Dividend Date: December 5, 2025
🏛 Dividend History: 10+ years of consistent payments
📊 5-Year Average Dividend Yield: 2.35% (Currently well above trend)
Dividend Overview
At a 4.34% yield, OpenText continues to offer a meaningful income stream for a technology stock. The company is paying out $1.09 per share annually, with the most recent quarterly payment of $0.275 per share delivered on December 5, 2025. Compared to its five-year average yield of 2.35%, the stock is offering a substantially higher return right now, a gap that reflects the significant price compression OTEX has experienced over the past year rather than any acceleration in the dividend itself.
The stock currently trades at $23.72, near the bottom of its 52-week range of $22.44 to $39.90. That steep discount from the year’s high is what is driving the elevated yield, and income investors considering a position should weigh whether that discount represents an opportunity or a warning signal about the company’s near-term fundamentals.
Dividend Growth and Safety
Dividend safety is always a top concern, and OpenText presents a more nuanced picture today than it did a year ago. The payout ratio has risen to 62.87%, up from approximately 42% in early 2025, reflecting both a modestly higher dividend and a lower earnings base as the company works through a period of revenue transition. That ratio is not alarming for a cash-generative software business, but it does leave less margin for error than before.
On the growth side, OpenText has continued to increase its dividend incrementally. The quarterly payment moved from $0.263 to $0.275 with the September 2025 payment, representing a roughly 4.6% step-up. Looking back through the recent dividend history, the company has raised the quarterly payout from $0.243 in early 2023 to the current $0.275, a cumulative increase of about 13% over that span. That pace is modest but consistent, and the company has not cut the dividend at any point during this period of operational stress.
What provides the real comfort for dividend investors is the free cash flow picture. Operating cash flow came in at approximately $1.03 billion for the trailing period, with free cash flow of roughly $1.05 billion. Against an annual dividend obligation that is a fraction of that figure, the payout is well covered at the cash level even if the GAAP earnings-based payout ratio looks less comfortable than it once did.
Chart Analysis
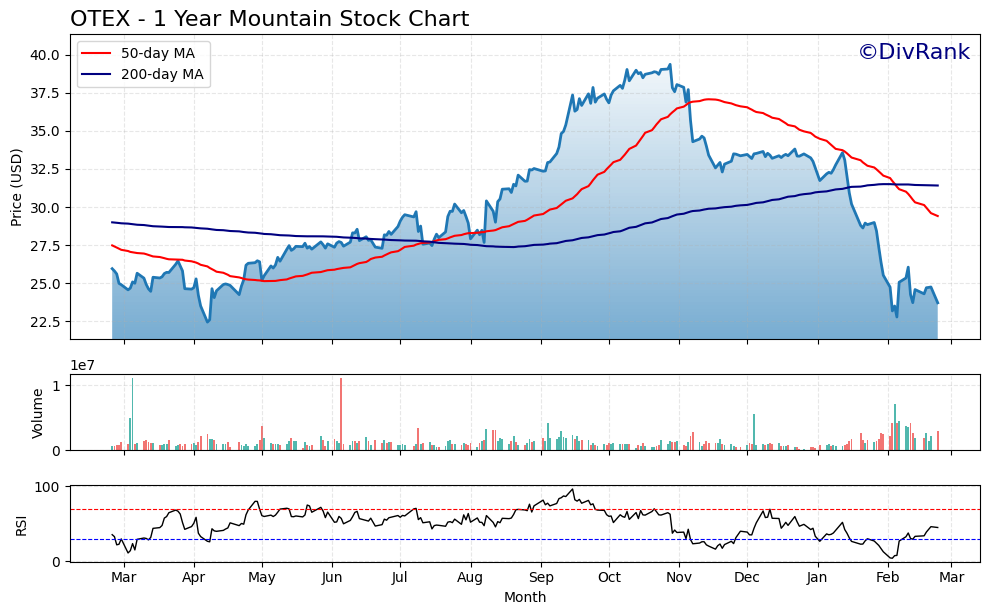
Open Text has endured a punishing twelve months on the price chart, shedding nearly 40% from its 52-week high of $39.37 to its current level of $23.72. The stock found a floor close to its 52-week low of $22.45, which means buyers have stepped in just barely above that support level, but the broader trend remains decisively negative. There has been no meaningful technical recovery to speak of, and the price action reflects a market that continues to reprice the business following its large-scale portfolio restructuring and the divestiture of its AMC business to Micro Focus parent Opentext’s own balance sheet adjustment cycle. For dividend investors watching entry points, the proximity to the 52-week low is a double-edged reality: it signals potential value, but also signals that sellers have remained in control for the better part of a year.
The moving average picture confirms the bearish intermediate trend without ambiguity. OTEX is trading well below both its 50-day moving average of $29.41 and its 200-day moving average of $31.42, sitting roughly 19% and 24% beneath those respective levels. More concerning for technically oriented investors is the presence of a death cross, a formation where the 50-day moving average crosses below the 200-day moving average. This pattern typically signals that short-term selling pressure has become entrenched enough to drag the longer-term trend lower alongside it. Until the stock can reclaim at minimum the 50-day moving average, the chart offers little technical justification for expecting a near-term price recovery.
The RSI reading of 45.24 places OTEX in neutral to slightly weak territory, below the midpoint of 50 but not yet at the oversold threshold of 30 that sometimes attracts contrarian buying interest. This reading suggests the stock is not in a panicked selling phase, but momentum is clearly not building in a constructive direction either. Buyers have not shown enough conviction to push the RSI back toward the 50-to-60 range where improving trends typically become visible. The lack of a meaningful oversold condition also means dividend investors cannot rely on a technical bounce catalyst in the near term without a fundamental catalyst to accompany it.
Taken together, the chart presents a cautionary picture for income investors considering a new position. The deep discount from the 52-week high and the proximity to long-term support near $22 may appeal to patient, valuation-focused buyers, but the death cross, the sustained distance below both moving averages, and the flat RSI all suggest this stock needs time to base before any durable recovery takes shape. Dividend investors who prioritize capital preservation alongside yield should treat the current technicals as a reason for patience rather than urgency, watching for a reclaim of the 50-day moving average as the first credible sign that sentiment is beginning to shift.
Analyst Ratings
The current analyst consensus on OpenText sits at hold, based on ratings from 11 analysts covering the stock. The mean 12-month price target is $33.09, with a low of $26.00 and a high of $50.00. At a current price of $23.72, the mean target implies upside of approximately 39%, which is a notable gap between where analysts think fair value sits and where the stock is actually trading.
The wide range between the low target of $26.00 and the high of $50.00 reflects genuine disagreement on the street about how quickly OpenText can stabilize its revenue base and demonstrate sustained cloud growth. Bears are focused on the revenue decline and elevated debt load, while bulls point to the company’s strong free cash flow generation, the ongoing shift toward higher-margin cloud subscriptions, and what they see as an overly depressed valuation at current prices.
The hold consensus is not unusual for a company in the middle of a strategic transition. Analysts broadly acknowledge that OTEX is not a broken business, but they want to see clearer evidence of revenue stabilization before recommending more aggressive positioning. For dividend investors, the key takeaway is that even the most conservative analyst price target of $26.00 sits above the current price, suggesting limited additional downside is expected from this level.
Earning Report Summary
OpenText’s most recent reported financials show a business that is generating strong cash flow even as it navigates a period of top-line pressure. Full-year revenue came in at approximately $5.18 billion, and while that reflects the impact of divestitures including the AMC business, the underlying cloud segment has been a relative bright spot. Net income for the period reached $436 million, translating to earnings per share of $1.71 on a GAAP basis.
Operating cash flow of approximately $1.03 billion and free cash flow of roughly $1.05 billion are the headline numbers that matter most for dividend investors, as they confirm the company’s ability to fund its dividend, service its debt, and pursue strategic investments simultaneously. A profit margin of 8.42% is modest by software industry standards but is consistent with a company that carries a significant acquisition-related amortization burden.
Return on equity of 10.55% and return on assets of 4.86% reflect a business that is generating acceptable but not exceptional returns on its capital base. Management has continued to emphasize margin expansion and operational efficiency as priorities, and the free cash flow results suggest those efforts are gaining traction even if they are not yet fully visible in the GAAP income statement. The company has also maintained its shareholder return program, combining dividends with share repurchases, which demonstrates confidence in the durability of the cash flow profile.
Valuation and Stock Performance
Current Stock Price: $23.72
52-Week Range: $22.44 – $39.90
P/E Ratio: 13.87
Price/Book Ratio: 1.46 (Below industry average)
Book Value Per Share: $16.23
Market Cap: approximately $6.03 billion
Beta: 1.09
OpenText’s stock is trading near the bottom of its 52-week range, sitting just above the $22.44 low and a long way from the $39.90 high reached earlier in the period. That represents a decline of more than 40% from the peak, a compression that has pushed the dividend yield to a decade-plus high and created what some value-oriented investors are beginning to view as a potentially attractive entry point.
The P/E ratio of 13.87 is not demanding for a profitable enterprise software company with a recurring revenue base, and the price-to-book ratio of 1.46 sits below typical software sector averages. At a market cap of roughly $6.03 billion, the stock is trading at less than one times trailing revenue, which is a low multiple for a business generating over $1 billion in annual free cash flow. The beta of 1.09 suggests only marginally more volatility than the broader market, which is relatively modest given the stock’s recent price history.
The disconnect between the mean analyst price target of $33.09 and the current price of $23.72 is meaningful, representing implied upside of roughly 39% before dividends. Whether that gap closes depends heavily on the company’s ability to stabilize revenue and demonstrate that its cloud transition is gaining momentum. For now, the market is applying a skeptical discount to the story.
Risks and Considerations
OpenText carries a substantial debt load that warrants attention from income investors. The company funded its ambitious acquisition strategy, including the large Micro Focus deal, with significant borrowed capital. While the free cash flow generation is strong enough to service that debt, elevated leverage limits financial flexibility and could become a more pressing concern if interest rates remain high or if operating results disappoint over an extended period.
Revenue trajectory is the most visible near-term concern. The company has been dealing with top-line declines that stem partly from divestitures and partly from softness in its legacy software maintenance business. If the cloud segment cannot accelerate quickly enough to offset those headwinds, revenue pressure could persist longer than management currently projects, which would put additional stress on the payout ratio.
The stock’s sharp decline from its 52-week high of $39.90 to the current $23.72 reflects genuine investor concern, not just temporary market noise. While the valuation looks attractive on several metrics, markets are rarely this wrong for long without some fundamental basis. Investors should consider that the price weakness may be anticipating further earnings pressure or strategic missteps that are not yet fully visible in the reported numbers.
OpenText’s acquisition-heavy growth model introduces integration risk on an ongoing basis. The company has a history of absorbing large, complex businesses, and while management has generally executed those integrations, each deal brings the possibility of unforeseen costs, customer attrition, or cultural friction. A major acquisition that underperforms could strain both the balance sheet and the dividend growth trajectory at the same time.
Final Thoughts
OpenText offers a compelling dividend yield of 4.34%, supported by more than $1 billion in annual free cash flow and a track record of incremental dividend increases that has remained intact through a challenging stretch for the business. The most recent raise, from $0.263 to $0.275 per quarter in September 2025, signals that management continues to prioritize the dividend even as it manages debt and navigates revenue headwinds.
The stock’s proximity to its 52-week low, a P/E of 13.87, and a mean analyst price target roughly 39% above the current price together suggest the market may be overpricing the downside risks. For income investors with patience and a tolerance for near-term volatility, OTEX at $23.72 offers a yield that is nearly double what it has historically provided, backed by cash flows that comfortably cover the payout. The key variables to monitor are revenue stabilization in the cloud segment and the pace of debt reduction, both of which will determine whether this discount eventually closes or proves justified.