

Updated 5/28/25
Lennox International Inc. is a major player in the HVAC industry, offering climate control solutions for both residential and commercial markets. Based in Texas, the company continues to show consistent operational strength, generating nearly \$933 million in operating cash flow over the last year with strong margins and disciplined cost control.
Backed by a seasoned leadership team, Lennox maintains a forward dividend yield of 0.90% with a low payout ratio of 15.37%, supported by healthy free cash flow. Analysts maintain a hold consensus with a price target near \$584, while management remains focused on product innovation and steady capital returns.
Recent Events
The first quarter of 2025 came in with a few signals worth noting. Revenue was up just slightly—around 2.4% year over year—but Lennox continues to make money with admirable efficiency. They’re not just growing; they’re growing smart. Margins are tight in this sector, but Lennox managed to deliver a profit margin just under 15%, and their operating margin sat above 14%. These are solid numbers that reflect tight cost control and pricing discipline.
EPS landed at $22.42 on a trailing twelve-month basis, a touch lower than the previous year. But that dip—3.2% year over year—isn’t ringing any alarms. A bit of normalization after strong performance in 2023 is expected, especially given the cyclical nature of the market.
One standout from the quarter: free cash flow. Lennox turned in nearly $590 million in levered free cash flow. That’s a big deal. Even with $1.49 billion in debt, the company’s cash flow easily covers its obligations and still leaves plenty for dividends and share repurchases. On top of that, the dividend was raised again. They’ll now pay $5.20 per share annually. It’s not flashy, but it’s reliable.
Key Dividend Metrics
📈 Forward Yield: 0.90%
💸 Payout Ratio: 15.37%
🚀 5-Year Dividend Growth Rate: Consistent and steady
📅 Ex-Dividend Date: June 30, 2025
💵 Next Payment: July 15, 2025
📊 Free Cash Flow Coverage: Very strong
📚 5-Year Average Yield: 1.17%
Dividend Overview
When you first glance at Lennox’s dividend yield, it might not grab you. Less than 1% in forward yield isn’t exactly high-octane for income seekers. But dig a little deeper, and you’ll see this is a slow burner—designed for the patient investor.
What stands out is the discipline. Lennox has a payout ratio of just over 15%, which leaves plenty of room for reinvestment, debt management, and future hikes. There’s no pressure to overextend just to keep yield-hunters happy. This is a measured approach to shareholder returns.
Then there’s the performance. The company’s return on equity clocks in at over 130%. While part of that is influenced by a lower book value due to share repurchases, it still shows how well Lennox is putting shareholder capital to work. Cash flow paints the real picture—strong, consistent, and well-aligned with shareholder rewards.
This is a dividend that doesn’t just show up every quarter—it grows. And it grows without drama. That’s not always exciting, but for long-term investors, it’s often the better road.
Dividend Growth and Safety
Lennox may not get lumped in with the Dividend Aristocrats just yet, but their pattern is clear. They increase payouts thoughtfully, consistently, and based on real earnings power—not financial engineering. The 5-year average yield sits at 1.17%, just above the current yield, suggesting some appreciation in the share price over time.
What makes this dividend reliable is the business behind it. Lennox doesn’t chase growth at any cost. Instead, it operates with a lean, cash-focused model that generates steady free cash flow. They put that cash to use—some of it in dividends, some in buybacks, and the rest into keeping operations strong.
Even with some debt on the books, the balance sheet holds steady. They’ve got $223 million in cash, a current ratio of 1.43, and the ability to cover obligations without blinking. If they wanted to double the dividend tomorrow, they probably could. But they won’t. They’ll take their time, just like they always have.
And that’s what makes it safe. The dividend is rooted in earnings, backed by cash, and managed by a company that’s more interested in doing things right than doing them fast. For dividend-focused investors, Lennox isn’t about big yield—it’s about dependable growth with a foundation that’s as solid as the systems they build.
Cash Flow Statement
Lennox International reported $932.7 million in operating cash flow over the trailing twelve months, a healthy figure that reflects strong underlying profitability and consistent demand in its HVAC business. This performance speaks to management’s discipline in converting earnings into actual cash—an essential metric for any dividend-focused investor. The company continues to maintain solid margins while controlling costs, which supports the durability of its cash generation.
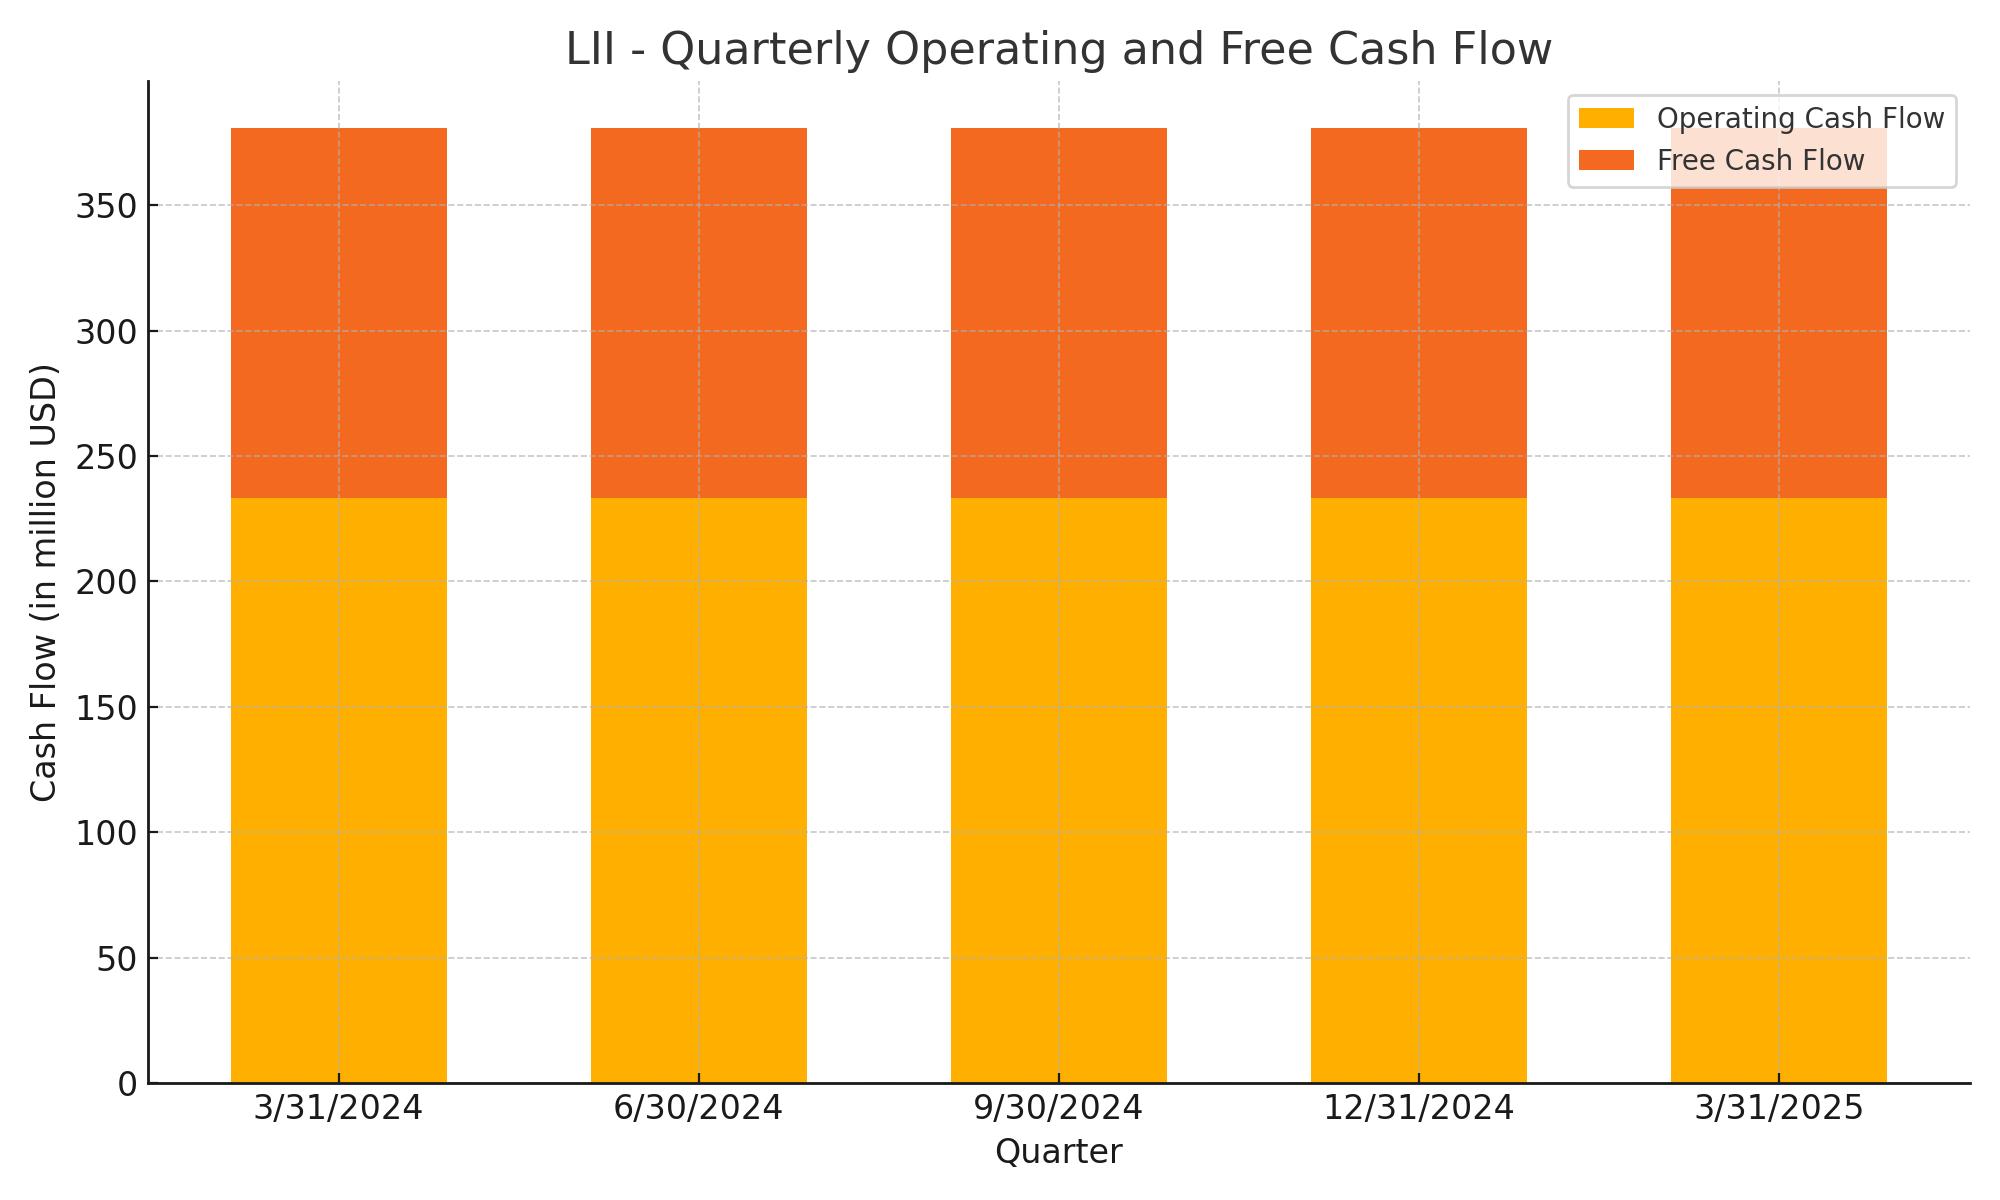
On the capital spending front, Lennox delivered $589.8 million in levered free cash flow during the same period. This suggests that after accounting for capital expenditures and interest payments, the company still retains substantial flexibility to fund dividends, pursue buybacks, or reinvest in the business. With this kind of cash flow cushion, Lennox isn’t relying on debt to meet its capital return commitments, which further reinforces the strength and safety of its dividend.
Analyst Ratings
📈 Lennox International has seen a variety of analyst updates recently, reflecting both confidence in its strong fundamentals and some caution around valuation levels.
✅ Barclays maintained its overweight rating in April 2025, trimming its price target slightly from $702 to $696. The move shows they still see Lennox as a leader in the HVAC space with a resilient business model. 🔄 RBC Capital echoed this view, holding a sector perform rating and bumping its target from $580 to $582, pointing to steady expectations. 🌟 Oppenheimer took a more bullish stance, upgrading the stock to outperform with a $600 target, signaling optimism around growth potential.
⚠️ On the other hand, not all the outlooks were rosy. 📉 Morgan Stanley downgraded Lennox to underweight and slashed its target from $585 to $450, citing valuation concerns and uncertainty in broader market dynamics. 🔻 Wells Fargo also trimmed its view, reducing the target from $550 to $500 while keeping an underweight rating, suggesting they see limited near-term upside. UBS took a more reserved tone too, adjusting its price target down from $625 to $570 while keeping a neutral stance.
📊 The current analyst consensus is a hold, with an average 12-month price target hovering around $583.71. That implies modest upside from current trading levels, highlighting a mixed but stable sentiment across the board.
Earning Report Summary
Solid Start to 2025
Lennox International opened the year with a strong first quarter, showing that even in a tricky economic environment, their foundation holds up well. Revenue hit $1.07 billion, a small but steady increase of 2.4% from the same time last year. Earnings per share came in at $3.37, just edging out expectations. It wasn’t a blowout quarter, but it showed stability and control—two things investors love to see, especially in an industrial business like this.
Leadership pointed to continued focus on execution and cost discipline as key drivers. They’ve had to deal with the same inflationary pressures and supply chain snags that have hit many in the sector, but the way they’ve managed around those obstacles has kept their financials on track. The company remains focused on long-term priorities rather than short-term flash, which was a theme repeated in their comments.
A Look Ahead
There’s a cautiously upbeat tone about the rest of the year. Management narrowed their full-year earnings guidance, which felt more like a reflection of measured confidence than any major shift in direction. They’re not overpromising, but they clearly feel good about the pipeline.
What’s interesting is their continued investment in product development and customer-facing technologies. They’re putting money into innovation and improving the user experience, whether that’s through smarter HVAC systems or service enhancements. It’s a reminder that Lennox is thinking about where the market is going—not just where it’s been.
Overall, this wasn’t a flashy quarter, but it was a reassuring one. The business continues to hum along, and leadership’s steady hand was evident in both the results and the outlook.
Management Team
Lennox International’s leadership is made up of experienced professionals who are guiding the company through the changing landscape of the HVAC industry.
At the center is CEO Alok Maskara, who took the reins in 2022. With a background in chemical engineering and an MBA from Northwestern, Maskara brings a practical yet strategic perspective. His leadership experience at Luxfer Holdings and Pentair gives him a strong footing in running industrial businesses on a global scale.
Michael Quenzer, named CFO in 2024, has been with Lennox for over two decades. He knows the company inside and out, having held various financial leadership roles, and plays a key role in maintaining strong fiscal management.
Prakash Bedapudi serves as Chief Technology Officer, drawing on years of experience from his time at Trane. Monica Brown, who has been with Lennox since 2012, is the Chief Legal Officer and a respected leader in the legal side of operations. Sarah Martin, who joined in 2025 to head up the Home Comfort Solutions segment, brings deep experience from her years at Honeywell.
Together, this team blends technical knowledge, financial discipline, and forward-looking strategy, giving Lennox a stable leadership foundation to navigate challenges and chase new opportunities.
Valuation and Stock Performance
As of late May 2025, Lennox International trades near $570 a share, giving it a market cap of around $20 billion. The stock has moved within a 52-week range of $483 to $682, showing both upside and downside volatility over the past year.
The average analyst price target is $591.33, pointing to some modest upside. With a forward price-to-earnings ratio of 25.45 and a price-to-sales ratio of 3.86, Lennox isn’t exactly cheap. These valuation multiples suggest that investors expect consistent growth and steady margins.
Some valuation models peg the stock’s fair value lower, between $465 and $520, which implies it might be priced at a premium. This gap shows the tension between what the market is willing to pay today versus what long-term models suggest it’s worth. For investors, it’s a reminder to weigh near-term sentiment against fundamentals.
Risks and Considerations
There are a few important risks to keep in mind with Lennox. First, the HVAC industry tends to follow broader economic trends. When construction slows or consumer spending tightens, demand for Lennox products can slip.
The company is also exposed to swings in raw material costs, especially metals, which can eat into margins. Competition is strong too, with a mix of long-time players and newer tech-driven entrants in the space. That puts pressure on Lennox to keep innovating while staying cost-competitive.
Environmental regulations are another factor. As standards change, Lennox may need to invest heavily in updating products and processes to remain compliant. And like many global companies, they face challenges related to supply chains, tariffs, and geopolitical tensions, which can all disrupt operations.
Final Thoughts
Lennox International continues to hold a leading position in the HVAC market, supported by a capable executive team and strong operational discipline. The company’s focus on product innovation, efficiency, and customer satisfaction has helped build a solid foundation.
Even though the stock may be trading at a premium, its consistent performance and clear strategic direction offer a compelling story. The steady cash flows and conservative balance sheet add to its appeal, particularly for investors looking for durability in a cyclical industry.
Ultimately, Lennox brings together the qualities of a well-run industrial firm with the potential for long-term value creation. For those keeping an eye on the HVAC space, it’s a name worth following closely.