

Updated 5/28/25
LCNB Corp. (LCNB) is a regional bank based in Lebanon, Ohio, with over a century of community banking experience and a focused footprint across the state. Known for consistent execution and stable operations, the bank delivers services through more than 30 branches, offering commercial lending, personal banking, and trust services. Its conservative approach and strong local presence have helped maintain reliable financial performance through changing economic conditions.
The company has demonstrated solid earnings growth, steady asset expansion, and a well-supported dividend. With a current yield over 6%, manageable payout ratio, and a shareholder-focused leadership team, LCNB continues to offer dependable income supported by disciplined banking fundamentals.
Recent Events
LCNB’s latest earnings update showed a strong rebound. Net income surged 140.7% year over year, thanks to a healthy jump in interest income and a focus on cost control. With a net profit margin nearing 20% and an operating margin close to 30%, the company is running a pretty tight ship.
Revenue saw a year-over-year increase of more than 20%, which is impressive given the broader challenges banks face in the current interest rate landscape. The bank also holds over $37 million in cash, with $111 million in debt—not excessive, especially when you consider their size and regional footprint.
The stock itself has traded between $12.42 and $17.92 over the past year. Lately, it’s been hanging around the $14.50 mark, which puts it below the 200-day moving average and just a touch under its 50-day line. For income-focused investors, this sets up a window to lock in a dividend yield that’s currently sitting at the higher end of its historical range.
Key Dividend Metrics 📈
💰 Forward Dividend Yield: 6.03%
📆 Next Dividend Date: June 16, 2025
📉 Payout Ratio: 76.5%
🔄 5-Year Average Yield: 5.09%
💵 Annual Dividend Rate: $0.88
📉 Trailing Yield: 6.03%
Right now, LCNB’s dividend yield is comfortably above its 5-year average. It’s delivering over 6%, which is compelling for income seekers who value predictable cash flow.
Dividend Overview
LCNB has made a name for itself not by growing fast, but by sticking to what works. That same mindset applies to its dividend. The bank has a long history of paying out regular dividends and hasn’t skipped a beat, even when times have been tough for the broader sector.
At today’s share price, the annual dividend payout of $0.88 per share yields just over 6%. That’s rare for a company this stable. You’re looking at a return that doesn’t rely on stock appreciation—just good old-fashioned income.
The payout ratio is a bit on the higher end at 76.5%, but this isn’t a red flag here. LCNB runs a straightforward business model, and with consistent cash generation, the dividend looks well-covered for now. Management seems committed to keeping that flow going, and there haven’t been any public signs that would suggest a reduction is on the table.
Dividend Growth and Safety
When it comes to dividend growth, LCNB doesn’t set a blistering pace. Think of it more as a gentle incline. Over time, shareholders have seen small, steady increases, but this isn’t a company where you’ll see annual double-digit bumps in the payout.
What makes LCNB’s dividend attractive is how safe it feels. The bank operates with a conservative philosophy. They’re not overleveraged. They don’t swing for the fences. And with returns on equity at 6.57% and returns on assets at 0.71%, the profitability metrics, while not eye-popping, reflect discipline and consistency.
The low beta of 0.62 also adds a layer of comfort for dividend-focused investors. This isn’t a stock that’s going to lurch wildly with the market. Instead, it tends to ride out volatility with minimal drama. That’s important for anyone relying on dividends for income—peace of mind is worth more than a few extra basis points.
For long-term dividend investors, LCNB offers a rare blend of simplicity, stability, and yield. It’s not trying to be anything it’s not—and in today’s market, that might be one of its biggest strengths.
Cash Flow Statement
LCNB Corp.’s trailing 12-month operating cash flow stands at $107.39 million, which is a notably solid figure for a bank of its size. This strong operating cash flow signals that the bank is generating reliable income from its core lending and deposit-taking activities. With interest rates still playing a critical role in bank earnings, this level of operational cash strength shows LCNB has managed to maintain margin discipline and asset quality through a changing rate environment.
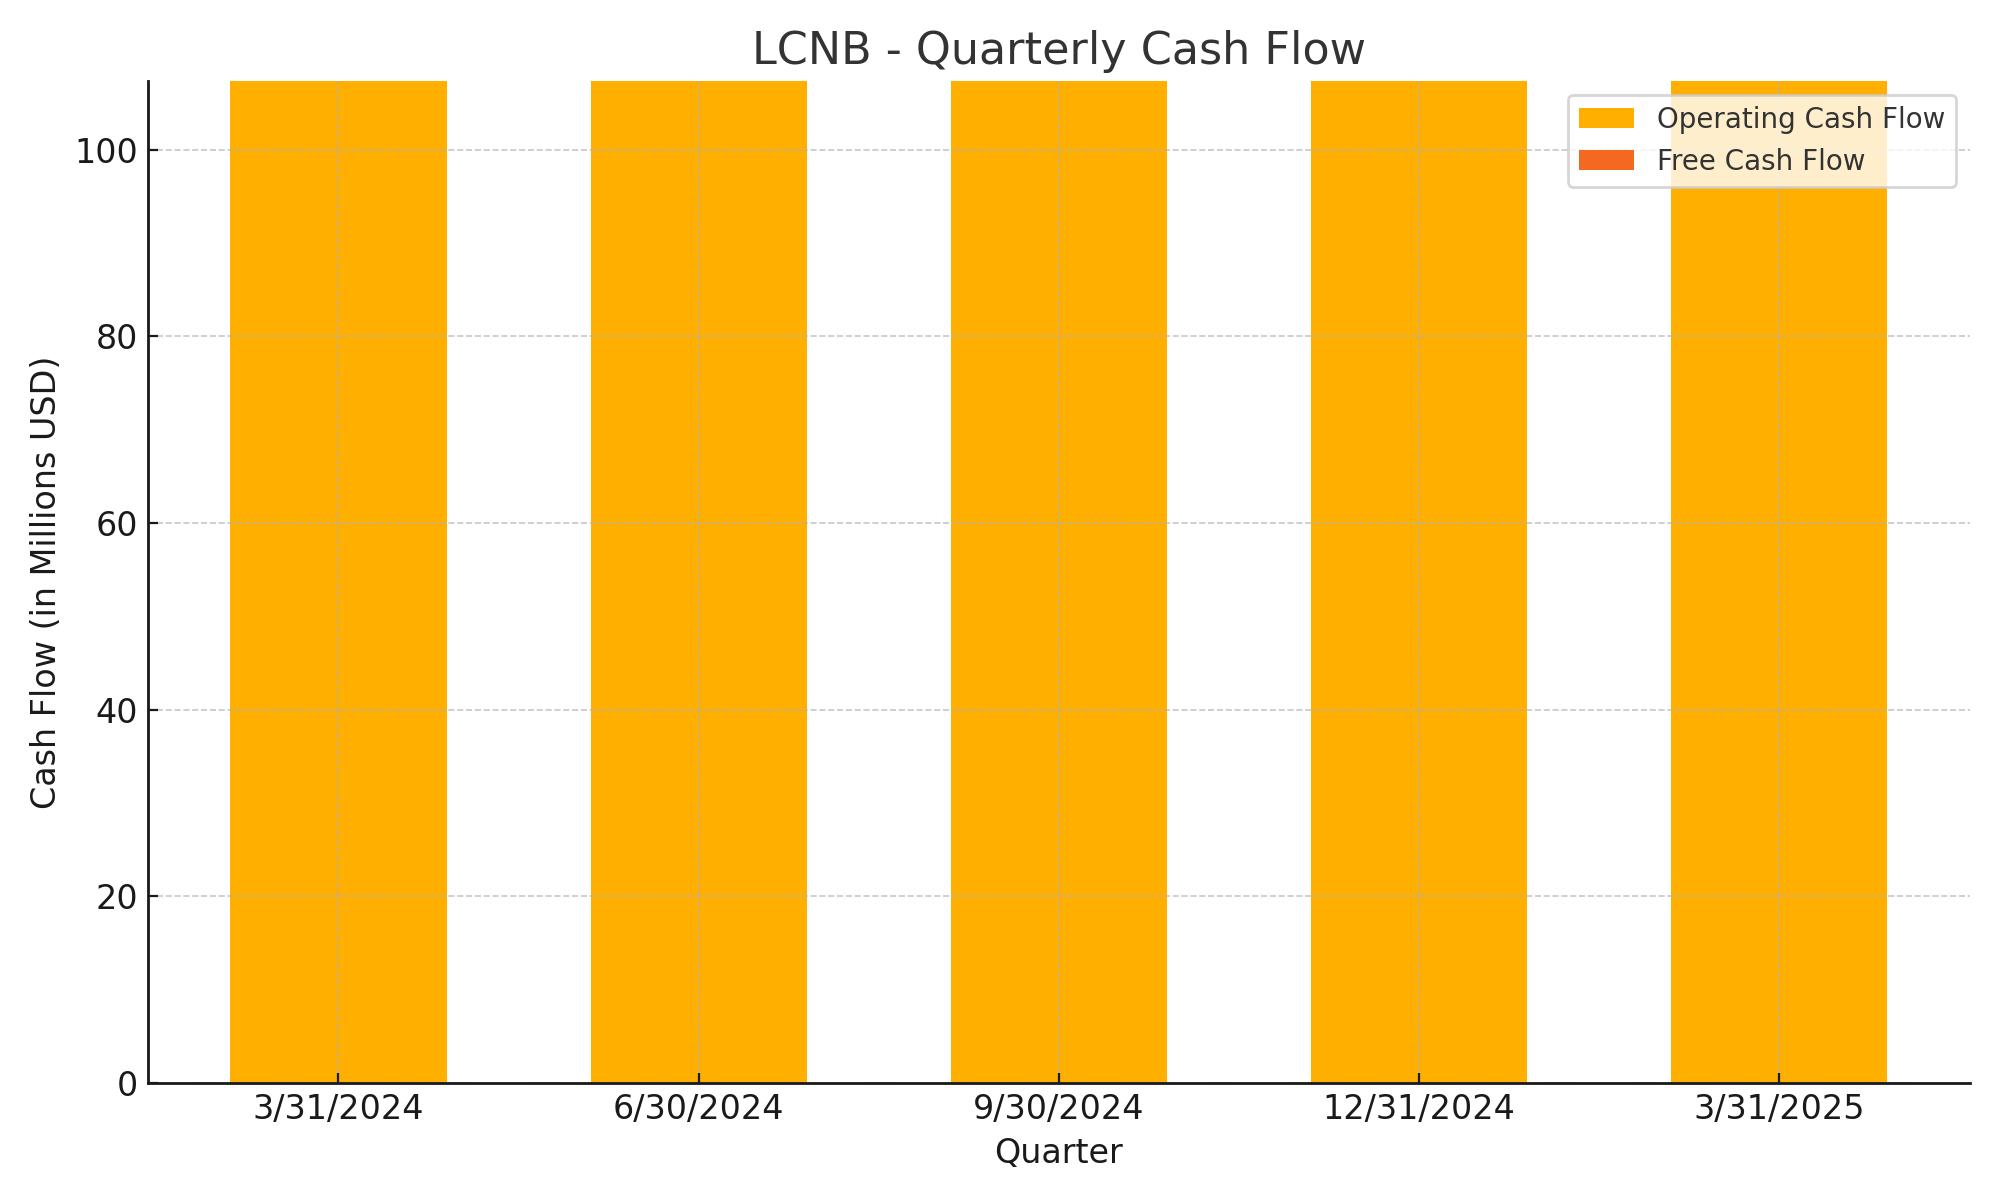
While detailed figures for investing and financing cash flows aren’t broken out here, the cash on hand as of the most recent quarter was $37.92 million. This gives the bank a meaningful cushion and flexibility to maintain its dividend, fund loans, or manage liquidity pressures without needing to aggressively raise external capital. The absence of levered free cash flow data isn’t unusual for banks, but the available numbers suggest a business that’s comfortably self-funding and managing its financial obligations without overextension.
Analyst Ratings
LCNB Corp. has recently seen a shift in analyst sentiment. 📉 In early April, the stock was downgraded from “buy” to “hold” following the release of its quarterly earnings. The bank reported earnings per share of $0.33, which came in below expectations of $0.39. The downgrade was largely driven by this earnings miss, raising some questions about near-term earnings momentum and lending activity in a still-evolving rate environment.
🧭 Analysts currently maintain a “hold” consensus rating on LCNB. The average 12-month price target is $15.81, with estimates ranging from $15.15 on the low end to $16.80 at the high. That places the stock’s upside potential in a modest range—decent but not dramatic—suggesting analysts see the bank’s fundamentals as sound but not overly compelling in the short term.
🧐 The sentiment from analysts seems to be one of cautious stability. While LCNB remains a reliable player in its regional market, the earnings miss and mixed financial indicators have prompted a more measured outlook. The view is that while LCNB is not in distress, it also isn’t expected to break out from its current trajectory without a clear catalyst.
Earning Report Summary
LCNB Corp. kicked off 2025 with a solid earnings report that reflected the kind of quiet strength long-time investors appreciate. First-quarter net income landed at $4.6 million, more than doubling the $1.9 million from the same time last year. Earnings per share moved up to $0.33, which marks a noticeable improvement and shows the bank is heading in a good direction.
Loan Growth and Margin Improvement
A big part of that performance came from higher net interest income, which climbed to $16.3 million compared to $13.9 million a year ago. That’s not surprising given the steady increase in the loan book and better loan pricing. The bank’s net interest margin expanded to 3.25%, which is actually the best it’s been in nearly two years. That kind of margin improvement tells you they’re managing the balance sheet with care, taking advantage of higher rates without overextending risk.
Non-Interest Income and Expenses
Non-interest income also played a role this quarter, coming in at $5.2 million. That’s a jump from $3.9 million last year and reflects growth in several fee-based areas, especially trust services and gains from loan sales. On the flip side, operating expenses edged up slightly to $15.8 million, mostly due to integration costs from the Eagle acquisition and stepped-up marketing efforts. Still, those costs seem manageable and part of a broader plan to expand reach in the Ohio market.
Leadership Commentary and Strategy
CEO Eric Meilstrup commented on the quarter with optimism. He pointed to the successful integration of acquisitions and reiterated the bank’s focus on expanding its presence while staying grounded in strong customer relationships. There’s a clear sense that LCNB isn’t chasing growth for growth’s sake—they’re taking a thoughtful, long-term approach that aligns well with their community banking roots.
Financial Position and Outlook
From a balance sheet perspective, things look healthy. Total assets grew to $2.30 billion, and net loans were up 3.6%, reaching $1.71 billion. Deposits moved higher as well, increasing 3.4% to $1.92 billion. That’s a good sign in today’s competitive deposit environment. Shareholder equity also saw a meaningful lift, now sitting at $258.7 million, up from $233.7 million last year.
LCNB isn’t trying to be flashy, and that’s just fine. This quarter shows a bank steadily moving forward, keeping expenses in check, growing organically, and remaining focused on the fundamentals that matter most to long-term investors.
Management Team
LCNB’s leadership brings together long-standing banking experience with a steady approach to growth. At the top is President and CEO Eric Meilstrup, who has led the bank through various shifts in the financial landscape while maintaining a clear focus on relationship banking. His comments around recent earnings reflect a tone of measured optimism. The company isn’t trying to make bold leaps—it’s moving steadily forward, keeping its base strong.
Meilstrup’s background with LCNB and within Ohio’s banking scene gives him a deep understanding of both the local economy and broader financial trends. The rest of the executive team mirrors this practical, regionally grounded perspective. They’ve shown consistency in execution, whether it’s managing credit risk, guiding strategic acquisitions, or balancing costs. There’s a sense of trust in how the bank communicates—no overstatements, just straightforward goals and results. That kind of clarity often resonates well with long-term income investors.
Valuation and Stock Performance
At its current price around $14.50, LCNB looks undervalued based on several common metrics. It’s trading at a forward price-to-earnings ratio of about 13 and a price-to-book ratio near 0.80. Those figures suggest the market is discounting the bank’s future growth prospects, but also that investors might be overlooking the reliability built into the business model.
The price-to-sales ratio of 2.41, alongside a return on equity just above 6.5 percent, gives the impression of a bank that’s efficient but cautious. Add in a five-year beta of 0.62, and it’s clear the stock doesn’t move with the broader market’s mood swings. That can be a strength for dividend-focused investors looking for more predictable behavior in turbulent markets.
Over the past year, the stock has managed a quiet gain of around five percent. That may not turn heads, but it’s in line with what you might expect from a name that’s built around consistency rather than flash. The consensus price target from analysts sits at $15.81, offering a bit of upside from here, though the real story remains the dividend and the dependable nature of the returns.
Risks and Considerations
There are several risks to weigh when looking at LCNB. The first is growth potential. This isn’t a bank chasing new markets or big transformations. It’s a focused, regional operator, and while that can be a strength, it also means the business is heavily tied to economic trends in Ohio. If the local economy weakens, there’s not much geographic diversification to soften the blow.
Another key factor is the interest rate environment. Community banks like LCNB are especially sensitive to changes in the yield curve. If deposit costs rise faster than loan yields, margins can come under pressure. So far, LCNB has managed this balance well, but rates remain a moving target, and the landscape could shift quickly.
Technology presents another challenge. Larger banks and fintech companies are investing heavily in mobile platforms and digital banking experiences. LCNB has made progress in this area, but competing on that front while keeping costs low is always a balancing act for a smaller player.
Finally, there’s valuation. While the stock appears cheap, some of that discount reflects investor skepticism around the bank’s growth runway. It’s not a negative if you’re focused on income, but it’s worth noting that multiple expansion may be limited without a clear earnings catalyst.
Final Thoughts
LCNB Corp. is a name that fits neatly into a dividend-focused portfolio, especially for those who value consistency and lower volatility. The bank’s operations are tightly managed, with a leadership team that understands its strengths and doesn’t stray far from its core mission.
With a dividend yield currently north of 6 percent and a strong history of paying out to shareholders, it’s easy to see the appeal. Add in a modest valuation and a track record of financial stability, and LCNB stands out as a dependable income generator rather than a high-risk, high-reward bet.
This is the type of stock that plays the long game. It may not dominate headlines or attract speculative interest, but it continues to deliver on what matters most to long-term investors: reliable cash flow, stable management, and a business model that holds up when others waver. For portfolios built around those principles, LCNB earns its place.