

Updated 2/24/26
ITT Inc. (NYSE: ITT) is a diversified industrial manufacturer with a strong footprint in motion technologies, industrial processes, and connective solutions. With a disciplined leadership team and a focus on innovation, ITT has built a consistent track record of operational execution and financial performance. Its product lines serve essential sectors including transportation, defense, energy, and industrial automation.
Through 2025 and into 2026, ITT has continued to demonstrate revenue growth, disciplined margin management, and healthy free cash flow generation. Supported by a conservative payout ratio and ongoing share repurchases, the company remains committed to returning capital to shareholders. With shares approaching their 52-week high and analyst consensus firmly in buy territory, ITT’s long-term positioning looks as compelling as ever.
Recent Events
ITT has been active on multiple fronts heading into early 2026. The company’s Connect & Control Technologies segment continued to benefit from sustained defense procurement cycles, while the broader industrial automation market supported demand across its process-oriented businesses. ITT also carried forward momentum from its mid-2025 capital allocation announcements, which included an expanded share repurchase authorization and a dividend increase that took the quarterly payment to $0.351, up from $0.319 in 2024.
On the operational side, ITT has been investing in manufacturing efficiency and digital process improvements across its global facilities, targeting further margin expansion into fiscal 2026. The company has also continued to explore bolt-on acquisition opportunities consistent with its historical approach of acquiring businesses that complement existing segment capabilities without dramatically stretching the balance sheet. Management struck a confident tone in recent communications, pointing to healthy backlog levels and resilient demand in defense and industrial end markets as reasons for measured optimism heading into the new fiscal year.
The stock has responded accordingly, with shares climbing from the low end of their 52-week range near $105.64 to a current price of $206.95, just shy of the 52-week high of $208.06. That kind of move reflects genuine investor confidence in ITT’s execution, not just sector-level tailwinds.
Key Dividend Metrics
🟢 Forward Dividend Yield: 0.69%
🟢 Annual Dividend Rate: $1.54
🟢 Last Quarterly Dividend: $0.351
🟢 Payout Ratio: 22.98%
🟢 5-Year Average Dividend Yield: 1.03%
🟢 Most Recent Ex-Dividend Date: December 1, 2025
🟢 Dividend Growth (2024 to 2025): ~10.0% increase
ITT’s payout ratio remains comfortably below 25%, preserving ample room to continue growing the dividend even if earnings face near-term pressure. The combination of a clean balance sheet and consistent free cash flow reinforces the safety and sustainability of these payments.
Dividend Overview
The dividend yield on ITT at current prices sits at just 0.69%, which is admittedly modest, and income investors focused purely on current yield may need to look elsewhere for immediate cash generation. But that framing misses the point of owning ITT for income. The company’s approach prioritizes steady, well-supported increases over inflating yield in a way that might compromise financial flexibility or balance sheet health.
Management has maintained the payout ratio well below 25% while still delivering meaningful year-over-year increases. The quarterly dividend moved from $0.319 in 2024 to $0.351 in 2025, representing roughly a 10% increase and bringing the annualized rate to $1.54. That kind of consistent progression, compounded over time, is what makes ITT relevant to a dividend growth portfolio even when the starting yield looks thin.
From a profitability standpoint, ITT’s earnings quality supports this approach. Return on equity of 14.29% and a profit margin of 12.39% reflect a business that converts revenue into real earnings efficiently. The company isn’t leveraging its balance sheet aggressively to sustain returns, which means the dividend rests on a genuinely solid foundation rather than financial engineering.
Dividend Growth and Safety
The dividend growth story at ITT has become increasingly clear over the past several years. Moving through 2023, 2024, and 2025, the quarterly payment stepped up from $0.29 to $0.319 and then to $0.351, each increase representing a roughly 10% advance. That pattern of consistent annual raises reflects a management team that views dividend growth as a core part of the shareholder value proposition, not an afterthought.
Safety metrics are equally reassuring. Annual dividend obligations at the current rate total approximately $123 million, measured against free cash flow of nearly $445 million. That produces a free cash flow coverage ratio well above 3.5 times, leaving substantial headroom for continued increases, reinvestment in the business, and share repurchases simultaneously. ITT does not have to choose between funding growth and rewarding shareholders; it can do both.
The payout ratio of 22.98% against trailing EPS of $6.10 further confirms that the dividend is nowhere near a ceiling. Even if earnings were to contract meaningfully, the company would have significant room to maintain payments without disrupting capital allocation priorities. For dividend growth investors building positions for the long term, that kind of cushion matters as much as the current yield number.
ITT’s pattern of deliberate, well-timed increases points to a disciplined long-term outlook. This is a company that raises its dividend because its financial model comfortably supports doing so, and because it fits the broader capital return strategy rather than being driven by short-term investor pressure.
Chart Analysis
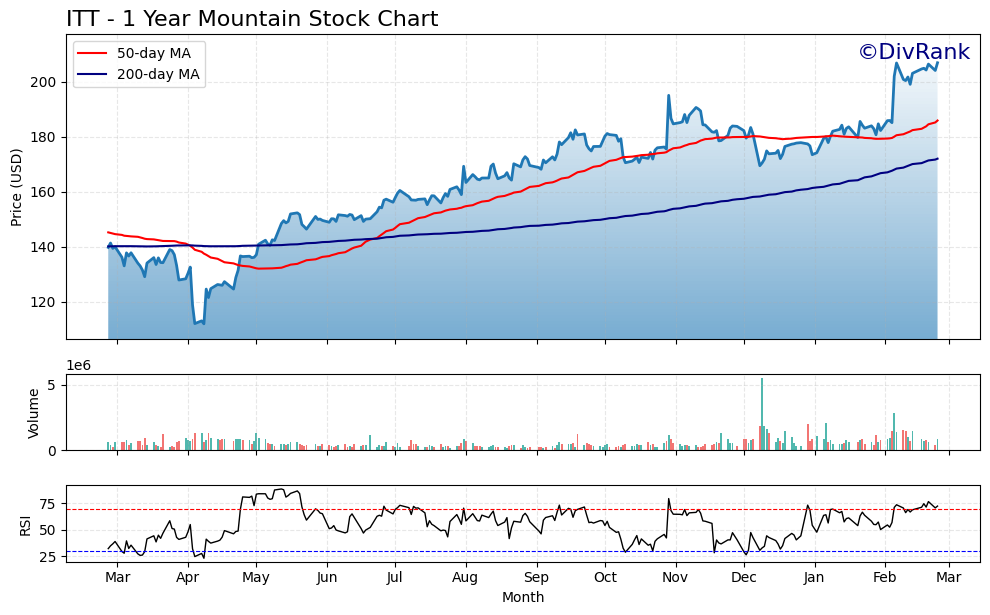
ITT has staged a remarkable recovery over the past year, climbing from a 52-week low of $111.96 to its current price of $206.95, which also happens to be its 52-week high. That 84.84% advance from trough to peak is not the typical profile of a slow-and-steady industrial dividend payer, but it reflects a market that has aggressively repriced ITT’s earnings power and margin expansion story. The fact that the stock is sitting precisely at its 52-week high as of this writing tells you there is no overhead resistance from prior sellers waiting to exit, and price action of this quality tends to attract additional institutional attention rather than repel it.
The moving average picture is unambiguously constructive. ITT’s 50-day moving average of $185.93 has crossed above the 200-day moving average of $172.06, producing the classic golden cross configuration that technical analysts associate with sustained uptrends. More importantly, the current price of $206.95 sits comfortably above both averages, meaning neither the intermediate nor the long-term trend line is acting as a ceiling. When price, the 50-day, and the 200-day are stacked in this ascending order, it generally confirms that buyers are in control across multiple time horizons, which provides a degree of confidence that the trend is not simply a short-term spike.
The RSI reading of 72.53 deserves honest attention. A reading above 70 places ITT in technically overbought territory, and investors entering at current levels should acknowledge that a consolidation or modest pullback is a realistic near-term scenario. That said, RSI can remain elevated for extended periods during strong trending markets, and a stock making new 52-week highs on broad momentum often continues to surprise on the upside before mean-reversion sets in. The signal here is not to avoid ITT, but to recognize that chasing a position at the precise 52-week high carries more short-term price risk than the same thesis would have offered at the 50-day moving average level of $185.93.
For dividend investors, the technical backdrop presents a familiar tension between trend confirmation and entry discipline. The long-term chart is doing everything right, with a golden cross in place, price above all key averages, and a multi-year base that has been decisively broken to the upside. Income-focused investors who prioritize position sizing and are comfortable with the possibility of a near-term consolidation can view the current setup as a valid entry, while those with more flexibility might watch for any pullback toward the $185 to $190 range as a potentially more favorable starting point that would also improve the effective yield on cost.
Cash Flow Statement
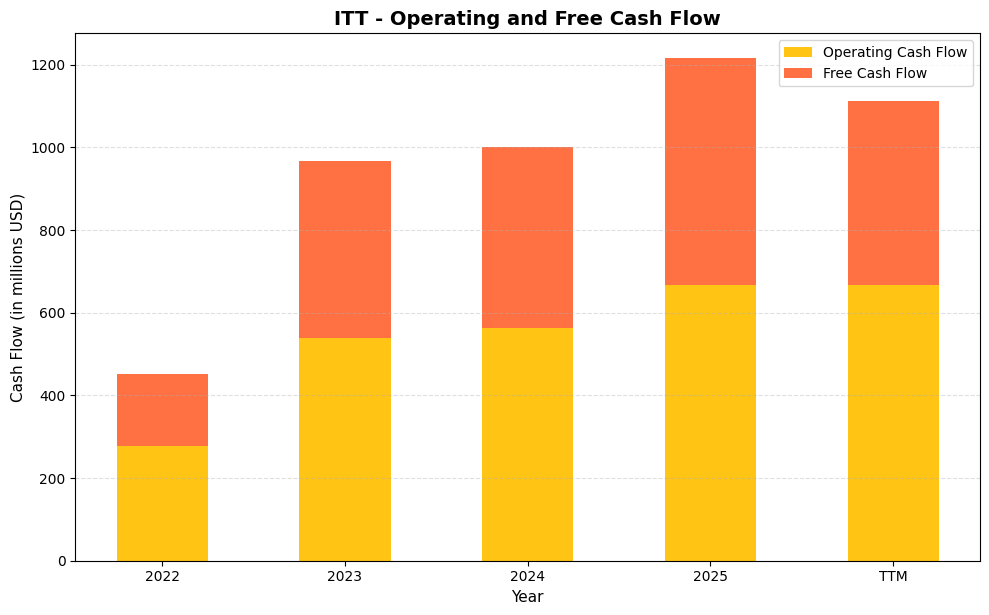
ITT’s cash generation has improved dramatically over the past three years, and the numbers tell a compelling story for dividend investors. Operating cash flow climbed from $277.8 million in 2022 to $537.7 million in 2023, a near-doubling that reflected stronger earnings conversion and disciplined working capital management. That momentum carried forward with $562.1 million in 2024 and $668.3 million in 2025, cementing a clear upward trajectory rather than a one-year anomaly. Free cash flow followed the same path, rising from $173.9 million in 2022 to $438.2 million in 2024 and $547.0 million in 2025. With TTM free cash flow sitting at $445.0 million against a dividend burden that represents a small fraction of that figure, the payout is covered with substantial room to spare. That kind of coverage ratio is precisely what dividend growth investors want to see when evaluating whether a company can sustain and grow its distribution through a full economic cycle.
The longer arc of this data reveals a company that has fundamentally improved its capital efficiency, not simply benefited from a favorable macro environment. The gap between operating cash flow and free cash flow has remained relatively tight across the entire period, which indicates that capital expenditures are being managed prudently even as the business scales. In 2022, capex consumed roughly $104 million of operating cash flow, and by 2025 that figure had grown only modestly relative to the much larger cash base, allowing free cash flow conversion to remain high. For shareholders, this means ITT is generating more distributable cash per dollar of revenue without sacrificing reinvestment in the business. That balance between returning capital and funding organic growth is a hallmark of well-run industrial compounders, and it gives management meaningful flexibility to continue raising the dividend, pursue bolt-on acquisitions, or buy back shares without straining the balance sheet.
Analyst Ratings
The analyst community maintains a broadly constructive view on ITT heading into 2026. Among the nine analysts covering the stock, the consensus rating sits at buy, reflecting confidence in the company’s execution track record and end-market positioning. The mean price target of $228.00 implies upside of approximately 10% from the current price of $206.95, while the high-end target of $274.00 suggests some analysts see considerably more room for appreciation if ITT continues to expand margins and grow its order book. The low-end target of $175.00 represents the more cautious camp, though even that figure is not dramatically below current trading levels.
With shares trading near the upper end of the 52-week range, the price target distribution suggests analysts broadly believe the recent rally is justified by fundamentals rather than valuation excess. The tight clustering of targets around the $228 mean implies a general consensus that ITT is fairly valued to modestly undervalued at current levels, with the bull case hinging on continued strength in defense demand and margin improvement across the industrial process and motion technologies segments. Short interest of just over 1.17 million shares remains relatively contained, indicating the market is not broadly positioned against the stock even after its significant run.
Earnings Report Summary
Solid Start to the Year
ITT delivered a steady full-year result through 2025, with trailing twelve-month EPS landing at $6.10 on revenue of $3.94 billion. While EPS came in slightly below the $6.28 reported in the prior comparable period, the company navigated a more complex macro backdrop with resilience, particularly given headwinds in European auto production that weighed on the Motion Technologies segment. Revenue growth was modest but positive, with the full-year figure representing an increase from the $3.63 billion reported twelve months prior. Order momentum remained a bright spot throughout the year, with defense and industrial connector demand providing consistent underlying support.
Segment Performance: A Mixed Bag
The Connect & Control Technologies segment continued to be a standout contributor, driven by strong defense procurement and robust demand for industrial connectors. Motion Technologies remained under pressure from softer automotive production volumes in Europe and North America, a headwind that ITT has acknowledged openly and has been managing through cost discipline and product mix optimization. The Industrial Process segment performed more steadily, benefiting from project activity in chemical processing and water infrastructure end markets. Despite the unevenness across segments, consolidated operating margins remained healthy, a reflection of the company’s ongoing focus on operational efficiency and pricing discipline.
Cash Flow and Capital Returns
Cash generation across the full year was a clear positive, with operating cash flow of $668.3 million and free cash flow of approximately $445 million providing ample capacity for capital returns. ITT continued its practice of returning capital through a combination of dividends and share repurchases, with the quarterly dividend stepping up to $0.351 beginning in early 2025. The repurchase program remained active throughout the year, reflecting management’s view that buying back shares at current levels is a productive use of excess cash alongside the growing dividend commitment.
Outlook Still on Track
Management maintained a confident tone regarding the company’s trajectory heading into 2026, pointing to healthy backlog levels, ongoing margin initiatives, and a favorable defense spending environment as key support factors. While the softer automotive market remains a watch item, ITT’s segment diversification and cost structure provide meaningful insulation. Investors can reasonably expect another year of dividend growth in 2026, consistent with the pattern of roughly 10% annual increases established over the past several years.
Overall, ITT’s 2025 results reflected the kind of steady, disciplined execution that long-term investors have come to expect. Leadership’s focus on operational improvement and capital discipline continues to translate into reliable results, even when individual end markets face cyclical pressure.
Management Team
ITT Inc. is led by CEO and President Luca Savi, who has been guiding the company since 2019. Savi brings a strong operational mindset developed during his tenure as Chief Operating Officer, and his leadership approach has remained centered on disciplined growth, strategic acquisitions, and continuous efficiency improvement across core operations. His consistent messaging around capital allocation and long-term value creation has built credibility with both the investment community and the company’s operational teams globally.
Working alongside Savi is Emmanuel Caprais, the Chief Financial Officer, who oversees ITT’s financial strategy and capital deployment decisions. The broader executive team blends decades of experience across diverse industrial backgrounds, creating a leadership structure grounded in accountability and sustained performance improvement. The group works cohesively, prioritizing execution while maintaining the flexibility needed to navigate shifting global dynamics in trade, currency, and end-market demand.
Valuation and Stock Performance
As of February 24, 2026, ITT shares are trading at $206.95, placing the stock near the top of its 52-week range of $105.64 to $208.06. The stock has effectively doubled from its 52-week low, a remarkable run that reflects both improved investor sentiment toward high-quality industrials and genuine fundamental progress at the company level. Market capitalization now stands at approximately $17.8 billion, a meaningful step up from mid-cap territory and one that reflects ITT’s growing scale and earnings power.
The trailing P/E ratio of 33.93 is elevated relative to where the stock has historically traded, and it deserves acknowledgment that valuation has stretched meaningfully alongside the price appreciation. The price-to-book ratio of 4.35 against a book value per share of $47.55 similarly reflects a premium that the market is assigning to ITT’s earnings quality and capital efficiency. For investors initiating a position today, the mean analyst price target of $228.00 suggests roughly 10% upside from current levels, which is a more measured return expectation than the stock has delivered over the past year. The bull case target of $274.00 would require continued outperformance on margins and order growth, while the $175.00 low-end target serves as a reminder that the stock is not without downside risk at these valuations.
Risks and Considerations
ITT’s exposure to cyclical end markets remains one of the most relevant ongoing considerations. The energy, mining, and chemical processing sectors that the Industrial Process segment serves are sensitive to capital spending cycles, and any meaningful slowdown in project activity could weigh on order volumes and revenue in ways that are difficult to offset quickly through other segments.
The softness in global automotive production, particularly in Europe and North America, continues to be a headwind for the Motion Technologies segment. While ITT has managed this pressure through cost discipline and mix optimization, a prolonged deterioration in auto build rates would test the segment’s ability to maintain its contribution to overall profitability.
With a global manufacturing and sales footprint, ITT is exposed to currency fluctuations that can affect both reported revenues and operating margins. Exchange rate volatility between the U.S. dollar and the euro, in particular, has been a recurring source of earnings variability and remains a factor worth monitoring given continued macroeconomic uncertainty in Europe.
Valuation at the current price also warrants careful consideration. A trailing P/E of nearly 34 leaves limited room for error if earnings growth disappoints or if the broader industrial sector multiple compresses. Investors purchasing shares near the 52-week high are paying a premium that reflects high expectations, and the stock could face pressure if any of ITT’s key end markets deteriorate more sharply than currently anticipated.
Competition across ITT’s segments remains intense, and the company must continue investing in product development, digital capabilities, and customer solutions to maintain its competitive position. Emerging technologies and new entrants in adjacent spaces could disrupt pricing dynamics or shift customer preferences in ways that require meaningful strategic adaptation.
Final Thoughts
ITT Inc. continues to demonstrate what disciplined execution and a long-term operational focus can deliver in the industrial sector. The leadership team has kept the company financially sound and strategically coherent, with a capital allocation framework that rewards shareholders through consistent dividend growth and active repurchases without compromising the balance sheet or growth investments. The dividend, now at an annualized $1.54 following the 2025 increase, may look modest in yield terms but reflects a safety and growth profile that holds up well under scrutiny.
For investors drawn to steady business models and shareholder-aligned management, ITT offers a compelling combination of reliability and upside. The stock is not cheap at current levels, and new investors should size positions with that valuation reality in mind. But for those already holding shares or willing to take a longer view, the company’s operational trajectory, cash flow strength, and track record of annual dividend increases make it a name worth keeping at the core of an income-growth portfolio.