

Key Takeaways
📈 Insperity’s stock has collapsed to $22.13, down roughly 77% from its 52-week high of $95.98, as the company posted a net loss and deeply negative cash flow over the trailing twelve months.
💵 With a payout ratio of 500% and operating cash flow of negative $278 million, the $2.40 annual dividend is no longer supported by current earnings or cash generation, raising serious sustainability questions.
📊 Analysts maintain a consensus Hold rating with a mean price target of $40.50, suggesting they see significant upside from current levels, though the gap between price and target reflects deep uncertainty about near-term execution.
Updated 2/24/26
Insperity, Inc. delivers human resources and business performance solutions to small and mid-sized businesses across the U.S., operating under a co-employment model that allows clients to outsource many employer responsibilities. With a 13-year track record of dividend growth and a current yield of 11.43%, the company continues to attract attention from income-focused investors, though the financial picture underlying that yield has deteriorated sharply over the past year.
The stock has suffered a staggering decline, falling from nearly $96 to just above $22 over the past 52 weeks. Rising healthcare costs, negative earnings, and deeply negative free cash flow have compressed the company’s financial flexibility to a point that is difficult to ignore. Management remains committed to their strategic partnership with Workday and their co-employment growth model, but the market is clearly demanding proof before extending any benefit of the doubt.
Recent Events
Insperity has been navigating one of the most difficult stretches in its public company history. The past several quarters have brought a combination of surging healthcare claims costs and deteriorating operating leverage that has fundamentally changed the financial profile of the business. The company reported a net loss of $7 million over the trailing twelve months, a dramatic reversal from the profitability it sustained for most of the prior decade. This shift from profit to loss has been the central story driving the stock’s collapse from its 52-week high of $95.98 to its current level near $22.
The ongoing Workday partnership remains one of the few forward-looking narratives management has offered as a growth catalyst. The collaboration is designed to modernize Insperity’s technology platform and deepen its appeal to mid-sized businesses, but leadership has consistently noted that meaningful revenue contribution from this initiative is still developing. In the meantime, the core business is absorbing the weight of elevated benefit costs that have proven stickier than initially anticipated.
With short interest at approximately 3.64 million shares, a segment of the market continues to position for further downside. The stock’s beta of 0.46 suggests relatively low sensitivity to broad market moves, meaning the selling pressure here has been company-specific rather than macro-driven. For a business that spent years building a reputation for steady, predictable performance, the current environment represents a genuine inflection point that investors are watching closely.
Key Dividend Metrics
📈 Forward Dividend Yield: 11.43%
💸 Forward Annual Dividend: $2.40 per share
📅 Most Recent Dividend Payment: $0.60 per share (December 9, 2025)
🪙 Last Ex-Dividend Date: December 9, 2025
📊 Payout Ratio: 500%
📉 5-Year Average Yield: 2.04%
🧾 Dividend Growth Streak: 13 years
📦 Last Stock Split: 2-for-1 on December 19, 2017
Dividend Overview
An 11.43% dividend yield on a company with a 13-year growth streak would normally be cause for excitement. In Insperity’s current situation, it is more accurately read as a distress signal embedded in a collapsing share price. The $2.40 annual dividend, paid at $0.60 per quarter, has remained unchanged throughout 2024 and 2025, with the most recent payment on December 9, 2025 confirming that management has not yet moved to reduce the payout. But the math surrounding that commitment has become increasingly untenable.
A payout ratio of 500% means the company is distributing five times its reported earnings in dividends. With a net loss of $7 million over the trailing twelve months, there are no earnings at all to cover the dividend. The yield now sits nearly six times above the company’s five-year average of around 2%, which is entirely a function of the stock price falling rather than the dividend rising. Investors who look at that yield as an income opportunity need to weigh it against the realistic probability that the dividend is reviewed in the near term.
Management’s decision to hold the quarterly payment at $0.60 through all four quarters of 2025 demonstrates a stated commitment to shareholder returns, but without a meaningful recovery in earnings and cash flow, that commitment will face increasing scrutiny as each quarter passes.
Dividend Growth and Safety
Insperity’s 13-year dividend growth streak is a genuine achievement and reflects decades of disciplined capital allocation under consistent leadership. The dividend history shows steady per-share increases from $0.52 in early 2023 through $0.57 and ultimately to $0.60 by mid-2024, where it has held ever since. The fact that the company did not cut the dividend through what has been a punishing 12 months for the stock is notable, but it does not resolve the fundamental safety question.
Operating cash flow came in at negative $278 million over the trailing twelve months, and free cash flow was negative $307 million. These are not modest shortfalls that a cash reserve can comfortably absorb over time. When a company is burning cash at this rate and simultaneously paying out approximately $90 million annually in dividends, the math points toward an eventual choice between preserving liquidity and preserving the dividend streak. The return on equity of negative 9.79% and return on assets of negative 0.26% reinforce that the business is currently consuming rather than generating value.
The book value per share of just $1.22, against a price of $22.13, reflects how much of the company’s market value rests on intangible factors such as brand, client relationships, and the expectation of an earnings recovery. For dividend investors, the honest assessment is that the growth streak is at meaningful risk unless profitability returns within the next one to two quarters. The dividend is still being paid, and management has shown a preference for maintaining it, but the safety cushion that existed in prior years is effectively gone.
Chart Analysis
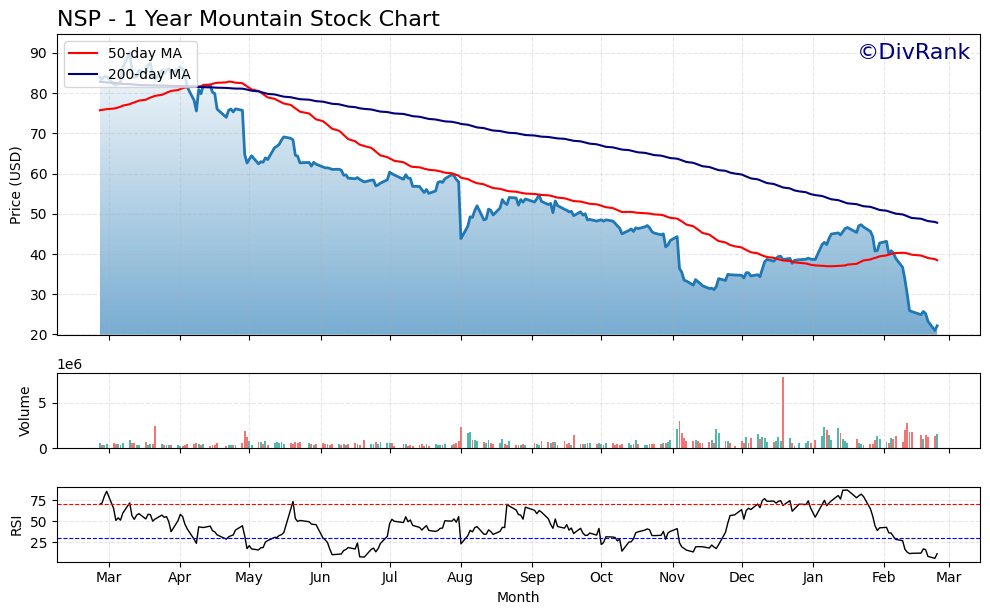
NSP has experienced a dramatic and sustained collapse over the past year, with shares falling from a 52-week high of $90.13 to a current price of $22.13, representing a decline of more than 75% from peak levels. The stock is now trading just 5.43% above its 52-week low of $20.99, which means the chart offers almost no technical cushion before setting a new multi-year floor. This is not a routine pullback or a sector rotation dip. The price action reflects a prolonged and accelerating downtrend that has systematically destroyed shareholder value across every meaningful time horizon over the past twelve months.
The moving average picture reinforces how deeply entrenched this downtrend has become. NSP is trading well below both its 50-day moving average of $38.46 and its 200-day moving average of $47.78, sitting roughly 42% beneath the nearer-term average and more than 53% beneath the longer-term one. The 50-day has crossed below the 200-day, forming what technicians call a death cross, which is a classically bearish signal that confirms downside momentum has been dominant long enough to drag both averages lower in sequence. For the stock to recover to either moving average from current levels would require a doubling or near-tripling of the share price, which underscores just how far the technical structure has deteriorated.
The RSI reading of 11.55 is extraordinary in its severity and deserves careful interpretation in context. An RSI below 30 is conventionally considered oversold, and a reading below 20 is rare, so a print of 11.55 places NSP in deeply extreme territory that most stocks never approach. In a healthy dividend compounder experiencing a temporary market overreaction, a reading this low might signal a contrarian entry point. In a stock that has already fallen 75% from its highs and is within striking distance of a new 52-week low, extreme oversold readings can persist far longer than expected, and they frequently reflect fundamental deterioration rather than irrational selling pressure alone.
For dividend investors, the chart presents a challenging picture that should temper any instinct to treat the low price as an opportunity without first conducting rigorous fundamental due diligence. The combination of a confirmed death cross, a price near 52-week lows, and an RSI in the single digits suggests the market is pricing in material stress, whether operational, financial, or structural in nature. Until the price can reclaim and hold above the 50-day moving average with meaningful volume, the technical evidence continues to favor caution over accumulation for income-focused investors who prioritize capital preservation alongside yield.
Cash Flow Statement
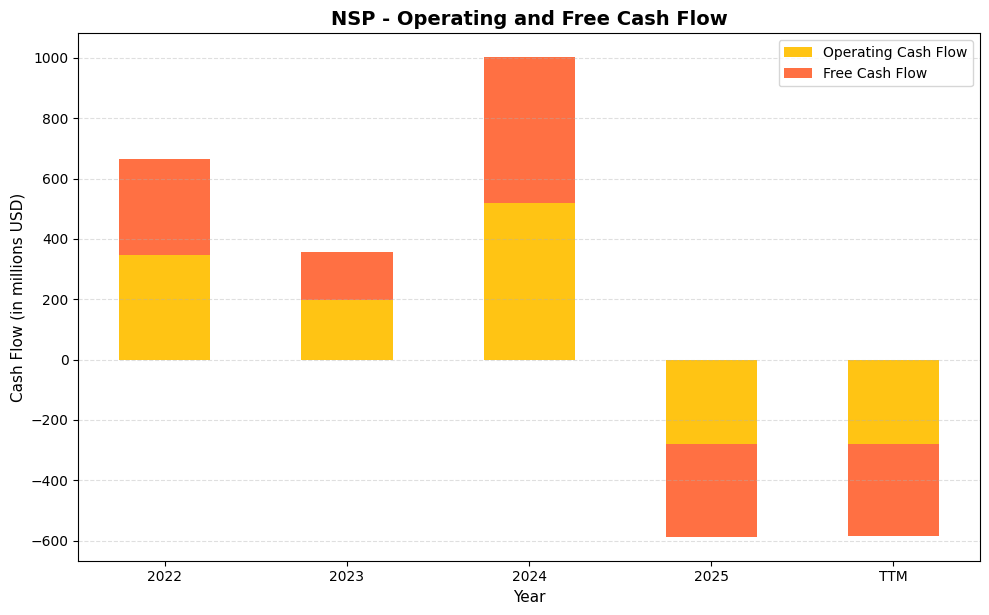
NSP’s cash flow profile has taken a sharp and concerning turn in the most recent period. After generating $520.0 million in operating cash flow and $482.0 million in free cash flow in 2024, the company swung to negative $278.0 million in operating cash flow and negative $309.0 million in free cash flow in 2025, with the trailing twelve month figures confirming the deterioration at negative $278.0 million and negative $307.2 million respectively. A company producing deeply negative free cash flow cannot self-fund its dividend from operations, and that reality places NSP’s distribution in a precarious position until management can demonstrate a credible path back to positive cash generation. For dividend sustainability, free cash flow is the most direct measure of whether a payout is organically supported, and at current levels that support is simply absent.
Zooming out across the full data set, the volatility in NSP’s cash flow history is striking and warrants caution. The company earned $347.0 million in operating cash flow and $317.0 million in free cash flow in 2022, then saw both metrics compress significantly in 2023 to $198.0 million and $158.0 million respectively, before rebounding strongly in 2024 to the highest levels in the series. That 2024 recovery may have reflected favorable timing in working capital or client billing cycles rather than a durable improvement in underlying business fundamentals, given how quickly conditions reversed into 2025. For shareholders focused on dividend income, the pattern suggests capital efficiency at NSP is lumpy and unpredictable rather than compounding steadily, which makes forward income planning more difficult. Investors should monitor upcoming quarters closely for any signs of normalization in cash generation before drawing comfort from the headline dividend yield.
Analyst Ratings
The analyst community has settled into a cautious Hold consensus on Insperity, with four analysts covering the stock and a spread of price targets that tells its own story. The low target of $35.00 implies roughly 58% upside from the current price of $22.13, while the mean target of $40.50 implies approximately 83% upside and the high target of $56.00 would represent more than 150% appreciation from current levels. The fact that even the most conservative analyst target sits well above the current price suggests that the selloff has been viewed by Wall Street as excessive, even accounting for the deteriorated fundamentals.
No specific analyst actions are available in the current data feed, but the positioning of those price targets relative to the stock’s 52-week collapse implies that at least some of the target reductions that likely accompanied the earnings deterioration have already been made. The consensus Hold rather than Sell also suggests analysts believe the downside from current levels is limited, even if near-term catalysts for a recovery are not obvious. A stock trading at $22 against a mean analyst target of $40.50 is one that the coverage community believes is fundamentally undervalued at these prices, though they are not willing to issue conviction Buy calls while cash flow remains negative and the dividend situation is unresolved.
Earnings Report Summary
A Business Under Significant Pressure
Insperity’s trailing twelve month financials reflect a business experiencing genuine operational stress rather than a temporary blip. Revenue of $6.81 billion represents continued scale in the co-employment model, but that top-line figure is doing little to translate into bottom-line results. Net income came in at a loss of $7 million, with earnings per share of negative $0.19. The profit margin of negative 0.10% means the company is essentially running at breakeven on a reported basis, and the cash flow picture is considerably worse than the income statement suggests.
Cash Flow and Cost Pressures
The most alarming figures in the current financials are the cash flow numbers. Operating cash flow of negative $278 million and free cash flow of negative $307 million indicate that the business is consuming cash at a rate that cannot be sustained indefinitely. Healthcare costs, which have been the primary driver of margin compression over the past several quarters, appear to have worsened rather than stabilized. The co-employment model is inherently exposed to benefit cost volatility because Insperity absorbs healthcare risk on behalf of its worksite employees, and when claims experience runs hotter than actuarial expectations, the financial impact flows directly through the company’s cost structure.
Strategic Direction
The Workday partnership continues to be management’s primary long-term growth narrative. The integration of Workday’s technology platform into Insperity’s service offering is intended to position the company more competitively for mid-market clients who demand sophisticated HR technology alongside traditional co-employment services. Management has maintained that this initiative represents a differentiated capability that competitors will struggle to replicate quickly. The question investors are asking is whether the company can sustain its financial position long enough for that strategy to produce measurable revenue and margin improvement. With the stock near $22 and the dividend yield above 11%, the market is clearly assigning a low probability to a smooth recovery without some form of restructuring or capital action.
Management Team
Insperity’s leadership is anchored by a seasoned team with deep roots in the company and the HR outsourcing industry. At the helm is Paul J. Sarvadi, co-founder and CEO, who has been guiding the company since its inception in 1986. His long tenure provides continuity and a clear vision for the company’s strategic direction, and he has consistently communicated confidence in the Workday partnership and the co-employment model’s long-term appeal even as near-term results have disappointed.
Supporting him is A. Steve Arizpe, President and Chief Operating Officer, who joined Insperity in 1989. Arizpe oversees key operational areas, including sales, marketing, human resources, client services, and information technology, ensuring the company’s services align with client needs and market demands.
James D. Allison serves as Executive Vice President, Finance; Chief Financial Officer; and Treasurer. His role encompasses financial strategy and oversight, and the current environment places particular pressure on the CFO function as the company navigates negative cash flow and a dividend payout that exceeds earnings by a wide margin.
Kathy Johnson, Executive Vice President of Strategic Development, focuses on long-term growth initiatives and the execution of the company’s strategic plans. Her responsibilities include enterprise analytics and corporate communications, areas vital for data-driven decision-making and stakeholder engagement.
The broader executive team includes Christian P. Callens, Senior Vice President and General Counsel, and JaNette Connell, Senior Vice President of Corporate Human Resources, among others. This experienced group has steered the company through prior economic cycles, and the current test of their leadership is among the most demanding the organization has faced.
Valuation and Stock Performance
Insperity’s stock is trading at $22.13, near the lower end of its 52-week range of $20.89 to $95.98. The magnitude of that decline, approaching 77% from the peak, is extraordinary for a company with $6.8 billion in revenue and over three decades of operating history. The market capitalization has shrunk to approximately $835 million, a fraction of where it stood just a year ago. For context, the company generates annual revenue more than eight times its current market cap, which is either a compelling value signal or a reflection of how seriously the market views the structural challenges in the business model.
With a net loss on the books, there is no meaningful P/E ratio to reference. The price-to-book ratio of 18.14 against a book value per share of $1.22 reflects just how asset-light the co-employment model is, and how much of any valuation case rests on the earnings power of the franchise rather than hard assets. The beta of 0.46 confirms that the stock’s volatility has been driven by company-specific developments rather than broad market swings, which means a recovery will also need to be driven by fundamental improvement rather than a rising tide lifting all boats.
The mean analyst price target of $40.50 implies that the coverage community believes intrinsic value is substantially above current levels, likely anchored to a normalized earnings scenario where healthcare cost trends stabilize and the Workday integration begins contributing to revenue growth. At $22.13, the stock is pricing in a fairly pessimistic outcome. Investors who believe management can restore profitability within the next few quarters may find the current price interesting, but the risk of further deterioration before any recovery is real and should be sized accordingly.
Risks and Considerations
Healthcare cost volatility is the most immediate and consequential risk facing Insperity today. The co-employment model requires the company to absorb benefit costs on behalf of worksite employees, and when claims experience exceeds pricing assumptions, the financial damage flows directly through the income statement and cash flow. The current cycle of elevated inpatient, outpatient, and pharmacy costs has been more severe and more persistent than management anticipated, and there is no guarantee that trends will normalize on any particular schedule.
The dividend sustainability question is no longer theoretical. With a payout ratio of 500% and negative operating cash flow, the $2.40 annual dividend is being funded through means other than current earnings and operations. Every quarter that passes without a meaningful improvement in profitability increases the probability that the board will need to reduce or suspend the dividend to preserve liquidity. A dividend cut of any size would likely trigger additional selling pressure in a stock that has already lost the majority of its value.
Economic sensitivity poses an ongoing structural risk. Insperity serves small and mid-sized businesses, which are disproportionately affected by economic slowdowns. A weaker employment environment or a recession scenario would reduce the number of paid worksite employees, compressing revenue and making the fixed cost structure more burdensome at exactly the moment when the company can least afford additional margin pressure.
The competitive landscape for HR outsourcing has become more crowded and more technology-driven, with both large enterprise software vendors and nimble payroll platforms encroaching on the market that Insperity has historically served. The Workday partnership is management’s primary response to this competitive pressure, but execution risk is real and the timeline for measurable commercial impact has already slipped relative to earlier expectations.
Regulatory complexity adds another layer of operational risk. The HR outsourcing industry operates within a dense framework of federal and state employment regulations, and any changes to co-employment liability rules, benefits mandates, or labor law could increase costs or require service redesigns that strain an already pressured cost structure.
Final Thoughts
Insperity finds itself at one of the most consequential crossroads in its history. The company that spent over a decade building a reputation for steady dividend growth and reliable earnings has, in the span of roughly twelve months, transformed into a turnaround story trading at a fraction of its former value. The 11.43% dividend yield reflects that reality, not a generous income opportunity in the traditional sense.
For long-term income investors, the calculus here is genuinely difficult. The 13-year growth streak, the $6.8 billion revenue base, the client retention history, and the experienced management team are all real assets. So is the risk that negative cash flow, a 500% payout ratio, and an unresolved healthcare cost problem could force a dividend reduction before any of the strategic initiatives bear fruit. The analyst community’s mean target of $40.50 against a price of $22.13 suggests there is recovery potential, but recovery timelines are uncertain and the path runs through a period of continued financial strain. Investors considering a position here should approach it with a clear-eyed view of both the upside scenario and the genuine possibility that conditions worsen before they improve.