

Key Takeaways
📈 Hillenbrand’s dividend yield is currently 4.32%, well above its 5-year average, and the company has maintained a steady payout even amid earnings pressure, though the high payout ratio means investors should watch future coverage closely.
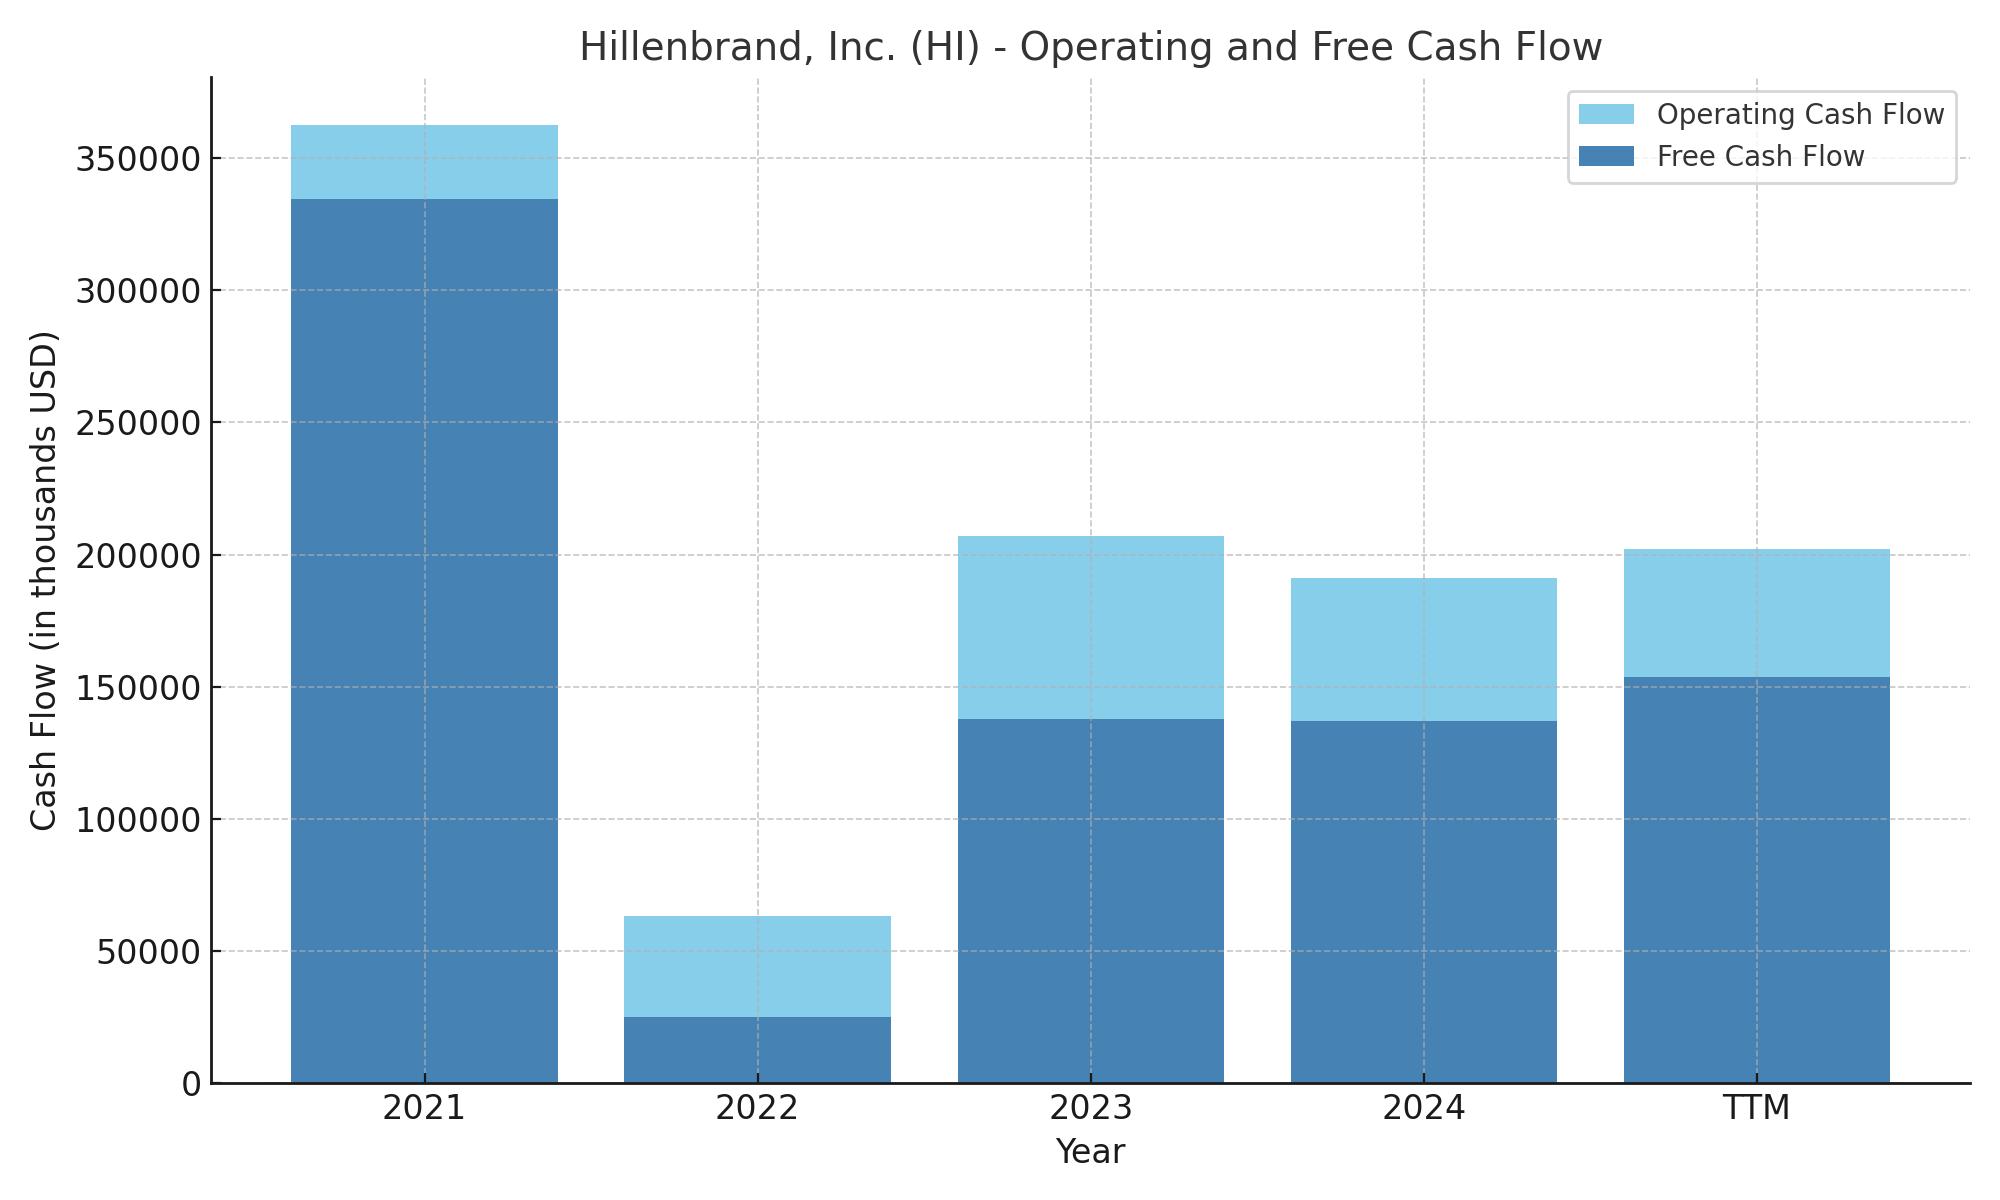
💵 Free cash flow remains strong at $153.6 million in the trailing twelve months, comfortably covering the dividend, while operating cash flow continues to support day-to-day operations despite revenue declines.
🧐 Analysts have recently downgraded the stock due to earnings softness and macroeconomic uncertainty, but the average price target of $32 suggests some see potential upside if the company can stabilize.
Last Update 5/11/25
Hillenbrand, Inc. is a diversified industrial company that has undergone a strategic transformation, shifting from its legacy funeral products business toward advanced processing solutions and engineered equipment. With operations spanning sectors like food, plastics, and pharmaceuticals, the company is now focusing on long-term growth through streamlined operations, disciplined capital allocation, and a clear shift toward higher-margin markets.
Despite short-term pressure on earnings and revenue, Hillenbrand continues to generate solid free cash flow and maintain its dividend. The stock has seen a sharp decline over the past year, but management remains committed to improving margins, managing costs, and executing its broader repositioning strategy.
🕒 Recent Events
Hillenbrand’s stock has had a tough year. It’s down more than 50% over the last 12 months, and a glance at the numbers makes it clear why. Revenue has declined year-over-year by nearly 9%, now sitting at $3.05 billion. The bottom line shows a loss of $271 million over the trailing twelve months—an uncomfortable turn for a company that’s spent years building a more diversified industrial portfolio.
Margins are also under pressure, and while operating margin is holding at 8.45%, net margins are deep in the red. Debt is high, sitting at $2.01 billion, with a debt-to-equity ratio over 147%. That kind of leverage puts added weight on the balance sheet, especially as earnings remain negative.
Despite these headwinds, Hillenbrand still holds a decent cash cushion—just over $458 million. Free cash flow remains positive, which gives them a bit of breathing room. But investors are clearly demanding more. The stock is now trading at less than half its 52-week high, and valuation metrics like price-to-sales (0.48) and price-to-book (1.10) suggest a steep discount compared to recent years.
📊 Key Dividend Metrics
🔵 Forward Dividend Yield: 4.32%
🟢 Annual Dividend Rate: $0.90
🟠 5-Year Average Dividend Yield: 2.23%
🔴 Payout Ratio: 75%
🟡 Dividend Date: June 30, 2025
🟣 Ex-Dividend Date: June 16, 2025
These numbers stand out, particularly for income investors. A yield north of 4% is not easy to find in the industrials sector—especially from a company with Hillenbrand’s track record of regular dividends. But that 75% payout ratio needs to be viewed in the context of the company’s current loss position.
💵 Dividend Overview
Hillenbrand has built a reputation over the years for consistent, measured dividend growth. The current payout of $0.90 annually hasn’t come out of nowhere—it’s the result of years of slow and steady increases. Even as the business has changed dramatically, the commitment to dividends hasn’t wavered.
That kind of dependability has real value, especially in times like these. The company is going through a rough stretch, but it hasn’t hit the brakes on shareholder returns. That tells you something about how they view their dividend—not just as a financial obligation, but as a core piece of the shareholder relationship.
Still, the picture isn’t perfect. Earnings aren’t covering the dividend right now. Instead, it’s being supported by free cash flow and cash on hand. That can work for a time, but it adds a layer of risk. The dividend doesn’t look like it’s in immediate danger, but it’s no longer as bulletproof as it once was.
📈 Dividend Growth and Safety
There’s a long history here of dividend increases, albeit at a moderate pace. Hillenbrand isn’t the kind of company that surprises with double-digit hikes. Instead, it’s been a slow grind higher over time—something many dividend investors actually prefer.
What’s changed is the context. The current yield of 4.32% is almost double the company’s five-year average. That jump isn’t because the dividend suddenly spiked—it’s because the share price dropped sharply. When a yield moves this much, this fast, it’s often a sign that the market is nervous.
And there’s good reason for that. The payout ratio, at 75%, is high—especially considering the company is currently losing money on a GAAP basis. But free cash flow paints a more forgiving picture. Hillenbrand generated about $395 million in levered free cash flow over the trailing twelve months. That’s more than enough to cover the dividend for now.
Where the uncertainty lies is in the future. Can the company stabilize its earnings? Will the strategic transformation finally begin to bear fruit? These are the questions that will ultimately determine how safe the dividend is over the next few years.
Hillenbrand’s management seems committed to preserving the dividend, even during this rocky stretch. That’s encouraging. But dividend investors should be aware that this is no longer a “set it and forget it” payout. It needs to be watched carefully—alongside the broader turnaround story that’s still playing out.
Cash Flow Statement
Hillenbrand’s trailing twelve-month cash flow statement shows a business maintaining positive operating cash flow despite earnings pressures. Operating cash flow came in at $202.1 million, slightly ahead of the prior year’s figure, suggesting that core operations are still generating meaningful cash. Capital expenditures totaled $48.5 million, leading to free cash flow of $153.6 million—a healthy margin for a company navigating strategic shifts.
The investing side of the ledger shows a notable reversal from prior years. After two consecutive years of significant outflows tied to acquisitions, investing cash flow swung to a positive $145.5 million. This shift likely reflects a pause or completion in major capital deployment. On the financing side, the company repaid more debt than it issued, resulting in net cash outflows of $84.9 million. Altogether, Hillenbrand increased its ending cash position to $487.9 million, more than doubling year-over-year. Despite some volatility in past periods, the latest snapshot shows a more stable cash flow profile with disciplined capital spending and improved liquidity.
Analyst Ratings
📉 Hillenbrand has recently seen a shift in how analysts are viewing the stock. On May 8, 2025, the company was downgraded by KeyBanc from “Overweight” to “Sector Weight.” This move stemmed from rising concerns about trade-related costs and the company’s fading pricing leverage in certain segments. Analysts pointed to increasing pressure on margins and the broader impact of global economic shifts on Hillenbrand’s diversified industrial operations.
📊 Earlier this month, DA Davidson also adjusted its stance, lowering the price target from $33 to $24 while keeping a “Neutral” rating. This revision followed the company’s latest earnings release, which revealed a year-over-year revenue decline and a widening net loss. The downgrade reflected growing skepticism about near-term earnings visibility and the timeline for margin recovery as management continues to push through its portfolio transformation strategy.
💸 Despite these recent adjustments, the broader analyst community still sees room for potential upside. The current average 12-month price target sits around $32 per share, suggesting a notable premium to where the stock is currently trading. While the downgrade activity signals caution, the consensus target indicates that many still view Hillenbrand as undervalued if it can stabilize operations and navigate its ongoing transition effectively.
Earning Report Summary
A Tough Quarter with Some Bright Spots
Hillenbrand’s most recent earnings report for the fiscal second quarter of 2025 was a mixed bag, leaning more toward the challenging side. The company posted $716 million in revenue, which marked a 9% drop from the same time last year. A big part of that came from softer demand in its Advanced Process Solutions segment, especially around capital equipment orders. That kind of slowdown can sting, and it certainly showed up in the bottom line. The company reported a net loss of $41 million, or 58 cents per share. That’s a clear departure from the modest profit it put up a year ago.
One of the bigger swings in the numbers came from the sale of most of its Milacron injection molding and extrusion business. That decision, while strategic, hit earnings in the short term. Adjusted earnings per share came in at 60 cents—down around 20% year-over-year. A drop, yes, but not completely out of step given the current climate.
Leadership’s Outlook and Strategy
Despite the rough quarter, CEO Kim Ryan’s tone remained measured. She acknowledged that tariffs and broader economic uncertainty are putting a dent in how customers are spending—especially when it comes to big equipment. That said, she pointed out that demand is holding steady in areas like food, health, and nutrition, where longer-term trends remain strong. Aftermarket services also offered some stability, which helped cushion the dip elsewhere.
The team at Hillenbrand isn’t just sitting back and hoping things improve. They’ve started rolling out price surcharges and looking for new suppliers to manage cost inflation and supply chain friction. These aren’t flashy moves, but they’re the kind of behind-the-scenes work that matters when margins are tight.
What’s Next
Looking forward, the company has revised its guidance to reflect these new realities. Full-year adjusted earnings are now expected to land somewhere between $2.10 and $2.45 per share. For the upcoming quarter, they’re projecting adjusted EPS between 46 and 53 cents. These aren’t blockbuster numbers, but they do show that Hillenbrand is trying to stay grounded and realistic while keeping one eye on recovery.
This latest update gives investors a sense of a company that’s in the middle of a transition—working through short-term headwinds while laying the groundwork for more stable footing ahead.
Management Team
Hillenbrand’s leadership is anchored by CEO Kim Ryan, who stepped into the role in December 2021. Her journey with the company began in 1989, and over the years, she has held various leadership positions, including President of Batesville and President of Coperion. Ryan’s deep understanding of Hillenbrand’s operations and culture positions her well to navigate the company’s ongoing transformation.
Supporting her is CFO Robert VanHimbergen, who joined Hillenbrand in April 2022. With a background as Vice President and Corporate Controller at Johnson Controls, VanHimbergen brings a wealth of financial expertise to the table. His experience is crucial as the company focuses on strengthening its financial position and exploring growth opportunities.
The broader executive team includes leaders like Aneesha Arora, the Chief Human Resources Officer, and Bhavik Soni, the Chief Information Officer. Their combined experience across various industries adds depth to the leadership bench, ensuring that Hillenbrand is well-equipped to tackle the challenges of a dynamic market environment.
Valuation and Stock Performance
Hillenbrand’s stock has experienced significant volatility over the past year. After reaching a 52-week high of $46.92, the stock has declined by over 50%, reflecting investor concerns about the company’s earnings performance and broader market conditions. Despite this downturn, there have been recent signs of recovery. On May 8, 2025, the stock rallied by 6.64% to close at $20.88, outperforming some of its industry peers.
From a valuation perspective, the company’s price-to-book ratio stands at 1.10, and its price-to-sales ratio is 0.48. These metrics suggest that the stock may be undervalued compared to its historical averages. Analysts have a consensus 12-month price target of $24.00, indicating potential upside from current levels.
However, it’s essential to note that the company’s financial metrics have been under pressure. The trailing twelve-month return on equity is negative, and the debt-to-equity ratio is elevated at 1.25. These figures highlight the importance of monitoring the company’s financial health and strategic initiatives closely.
Risks and Considerations
Investing in Hillenbrand comes with its set of risks. The company has disclosed numerous risk factors in its recent filings, with a significant portion related to finance and corporate matters. These include challenges in executing corporate strategies and financial reporting complexities.
Macroeconomic factors also pose risks. Global economic uncertainties, including potential recessions and trade tensions, can impact customer demand and supply chain stability. Additionally, the company faces legal and regulatory risks, especially as it expands its global footprint.
Environmental regulations are another area of concern. New sustainability-related rules could necessitate costly changes in manufacturing processes or sourcing materials, potentially increasing operational expenses.
Lastly, the company’s high debt levels could limit its financial flexibility. While the company has positive free cash flow, the elevated debt-to-equity ratio underscores the need for prudent financial management.
Final Thoughts
Hillenbrand is navigating a complex landscape marked by internal transformations and external challenges. The leadership team’s deep experience and strategic initiatives aim to position the company for long-term success. While the stock has faced significant headwinds, recent performance suggests potential for recovery. However, investors should remain vigilant, keeping an eye on the company’s financial health, regulatory developments, and broader economic indicators.